Financial Wave. BitcoinOur priority scenario in BTC is wave b up to $17329. A break of the $16,955 level will confirm our view. If the price of Bitcoin falls below $16373, our marking will change.
Bitcoinforecast

BTC Maintains Sideways Movement! HAPPY NEW YEAR!!!!
On the BTC 4hr chart, we can still it's still stuck in its range between 16.7k and 16.3k. There's massive resistance above 16.7k from the 3 EMAs (50, 100, 200) and the horizontal resistance at 16.7k and 17.3k.
Right now I'm waiting for it to approach the 16.3k level to long or the 16.7k or 17.3k levels to short. The MACD is still curving to the upside which is bullish but RSI has lost steam (conflicting signals), therefore we're getting a lot of chop.
If you enjoyed my TA, please send a boost my way and leave a comment below :)

Bitcoin: Bullish divergence on weekly rsiBitcoin has made a bullish divergence on the weekly rsi, meaning the price went lower while the rsi is making a higher high. Not only do we see a bullish divergence, the divergence is happening in a falling channel.
The only thing missing is a third confirmation of this bullish divergence. That confirmation can happen in 2 ways:
1: making a lower low on the price, while making an higher high on the rsi
2: makinga a double bottom on the price, while making an higher high on the rsi

Kingpinwin House of Pi 2023 Pt.1Using Sacred Geometry/Fruit of Life and Circle Fibs to create the House of Pi in order to identify likely price ranges (3, 6 and 12 months) for Bitcoin for 2023


BTCUSDTBitcoin showing a retest to 17k before the final dump, trade with caution apply good money management

Btcust Wyckoff Accumulation Setup bull run 14k+ or 13.5k+Btcust Wyckoff Accumulation Setup
bitcoin also completed Accumulation Phases A,B, so now we are in Are Of Accumulation Phase C ..
our spring Area will be 14k or 13.6k+
after retest we can Buy or hold Bitcoin ..
PS—preliminary support, where substantial buying begins to provide pronounced support after a prolonged down-move. Volume increases and price spread widens, signaling that the down-move may be approaching its end.
SC—selling climax, the point at which widening spread and selling pressure usually climaxes and heavy or panicky selling by the public is being absorbed by larger professional interests at or near a bottom. Often price will close well off the low in a SC, reflecting the buying by these large interests.
AR—automatic rally, which occurs because intense selling pressure has greatly diminished. A wave of buying easily pushes prices up; this is further fueled by short covering. The high of this rally will help define the upper boundary of an accumulation TR.
ST—secondary test, in which price revisits the area of the SC to test the supply/demand balance at these levels. If a bottom is to be confirmed, volume and price spread should be significantly diminished as the market approaches support in the area of the SC. It is common to have multiple STs after a SC.
Note: Springs or shakeouts usually occur late within a TR and allow the stock’s dominant players to make a definitive test of available supply before a markup campaign unfolds. A “spring” takes price below the low of the TR and then reverses to close within the TR; this action allows large interests to mislead the public about the future trend direction and to acquire additional shares at bargain prices. A terminal shakeout at the end of an accumulation TR is like a spring on steroids. Shakeouts may also occur once a price advance has started, with rapid downward movement intended to induce retail traders and investors in long positions to sell their shares to large operators. However, springs and terminal shakeouts are not required elements: Accumulation Schematic 1 depicts a spring, while Accumulation Schematic 2 shows a TR without a spring.
Test—Large operators always test the market for supply throughout a TR (e.g., STs and springs) and at key points during a price advance. If considerable supply emerges on a test, the market is often not ready to be marked up. A spring is often followed by one or more tests; a successful test (indicating that further price increases will follow) typically makes a higher low on lesser volume.
SOS—sign of strength, a price advance on increasing spread and relatively higher volume. Often a SOS takes place after a spring, validating the analyst’s interpretation of that prior action.
LPS—last point of support, the low point of a reaction or pullback after a SOS. Backing up to an LPS means a pullback to support that was formerly resistance, on diminished spread and volume. On some charts, there may be more than one LPS, despite the ostensibly singular precision of this term.
BU—“back-up”. This term is short-hand for a colorful metaphor coined by Robert Evans, one of the leading teachers of the Wyckoff method from the 1930s to the 1960s. Evans analogized the SOS to a “jump across the creek” of price resistance, and the “back up to the creek” represented both short-term profit-taking and a test for additional supply around the area of resistance. A back-up is a common structural element preceding a more substantial price mark-up, and can take on a variety of forms, including a simple pullback or a new TR at a higher level.

at 11k I will start fishing BitcoinI do not think that the price will go below 10-12. But the goal has logic.

This is NOT Clickbait!!!Ok maybe it is.
But let's discuss something, as I always appreciate people's inputs to my POV.
-
-
-
All everyone is talking about is support this, resistance that, trends, historical data and it's a complete 50/50 long/short among retailers.
So here's me asking you the following, and stating some opinions.
Nothing matters now. Altcoins are being converted to BTC (which holds/pushes BTC price a little bit), and when the time is right, it will have a mass dump.
And this is backed up by my idea of supply and demand ideology, where no one who is looking to make profit would buy an asset at its current cost of production price (or even at a premium). Just like we'd look to buy bargains to make profit (or even go at a sale to buy something at a decreased price), it's the same ideology here.
Just like when a real estate titan would not go and buy property at their all time high prices and would go buy them when the market is in need to sell.
So, if the production cost for example of BTC is at 15,000, how does anyone expect the price of BTC to start going up, if no one that has the power to purchase it and make a difference would touch it?
Another point, Bitcoin used to be the main way of making anonymous payments which offered a competitive advantage to this solution in the market. Where is this competitive advantage now when 99% of the platforms require KYC and everything is tracked. The only way for someone to move the money and make it untraceable would be these laundering systems that break them down etc.
So if there is no utility for it, and all we're talking about is the prospects, then what is the real worth of BTC right now? And why would it increase in value to people who actually understand and can access the utility?
Thanks everyone. Looking forward to your thoughts.

BTCUSD on way to 11700 within next couple of monthsBefore looking at the current chart, let's look at the BTCUSD log chart on a monthly scale
As we can see, BTCUSD has broken it's long term support trendline since its inception (the yellow line) and then rejected it on retest which has confirmed the breakdown. Now, it's only a matter of time, within next couple of months, with 80% probability, we should see 11700 on BTCUSD. What's in store after that, we'll see later. A no brainer short IMO. Be careful and avoid leverage as there can be bounces along the way.
SL : If we confirm above the yellow trendline, the bitcoin bottom will be confirmed then and it validates this short thesis.

BTC outlook - Bearish Trend continuesHere's a quick look at the 3-day BTC chart. As we can see, the price has been oscillating within the bigger descending triangle. If DXY (Dollar Index) keeps rising, we should expect the price of BTC to go further down!
There are some unfilled Fair value gaps between 11k and 12k. Also, there is an unfilled CME gap at 9.7k! These gaps tend to get filled at some point! These gaps will likely get filled in this bear market since the DXY is expected to rally from its current level - when the DXY goes up, the BTC price will go down!
I firmly believe the bottom will be close to the 10k area. We have yet to see the last capitulation, IMO, yet! Trade Safe!
-------------------------------------------
If you like the content, then make sure to comment and like the post :D
Follow me for daily profitable trading setups
BTC dictates the market. If BTC falls, then Alts will fall as well. Trade safe!

Insane short on Bitcoin this New Year!Hello, everyone!
It’s time to refresh the Bitcoin analysis. BTC stacked it the annoying flat. This is the corrective wave and I think it’s has not been finished yet.
Let’s take a look at the 4h time frame BTCUSDT chart of the WhiteBit exchange. The first downward impulse consists of clear 5 wave cycle. Now there is a corrective wave 2 which is going to be represented as a zigzag ABC. I consider that wave C has been already started and we are going to see the 5 waves cycle inside this wave.
Here we have 2 targets. The conservative one is $17200 . The imbalance candle was formed in the impulsive downward wave and usually such imbalances should be filled at least for 50%. The optimistic target is $17500 because the Fibonacci retracement 0.61 level is here. Also this target coincides with the start of the imbalance. I am holding ADA for the potential bounce, but wanna warn you that I am not good in corrections defining. If you are not sure it’s better to skip trades in corrective wave and wait for the insane short.
I am going to count waves inside wave C and open short the the reversal bar in wave 5. Let’s see what will happen.
Best regards, Ivan!
________________________________________________________________________________________________
If you like my trade ideas, please smash the boost button to stimulate me make more quality analytics!

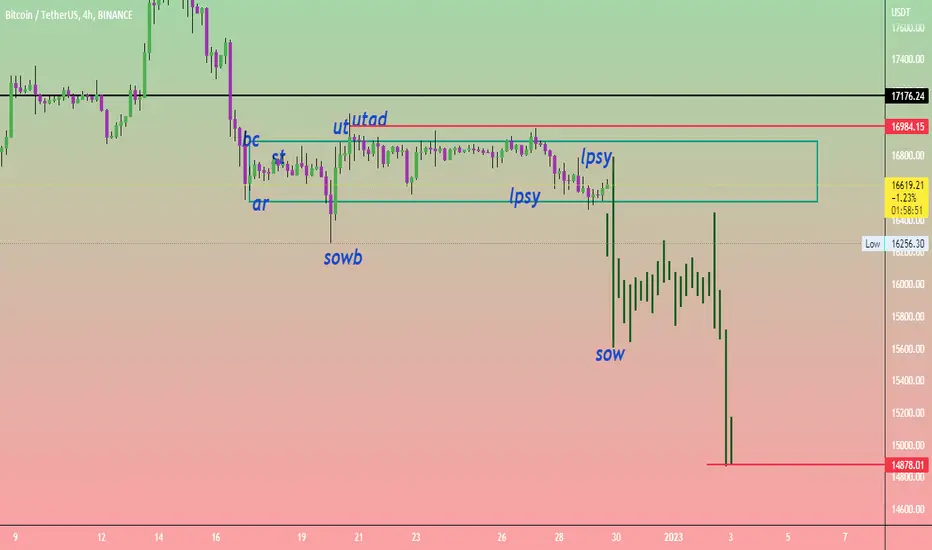
btcusdt bearish structure Btcusdt structure is still bearish ..
next Move ahead to Sow area ..
after Sow our disribution setup confirmation ll be done
if it happen then btc ll be on 15k or near to 14k+
$RSR- Looking For A Fill Followed By A Push Up To Weekly Lows1:7 R:R on this trade- RSR looks to have bottomed temporarily on LTF. Looking to scalp long the push up, and then short the retest

Bitcoin Four Hour (MTF) AnalysisCurrently consolidating in between two major fvgs, I expect BTC to make a push up to fill the daily (hence the long at golden ratio) or a stark sell off to fill the 6h. Around 16,000 is where I'm looking to long, and will gradually DCA in that area. On the off chance we lose this level (which would be major), we will see another 5-15% drop.

Bitcoin Long Scalp$BTC looks bullish in the short term, I am entering a short term scalp trade.
After this bounce from the falling wedge and after it at least reaches target 1, I am exiting the trade.
$BTC is currently very choppy and still in downtrend so longing is unsafe as we can fall down below $16k very easily.
My Targets:
TP1: $16,659
TP2: $16,800
My Stop loss:
STOP LOSS: $16,430

BTC Still Stuck in a Range! What Next?BTC broke below our 16.7k support and continues to remain in a range between 16.7k and 16.3k. I would not take a trade here until it gets to one of the aforementioned levels.
The Wave Fusion indicator still hasn't given a buy and I'm waiting for a sharp move in either direction to get some volatility and create some mean diversion.
The 50, 100, and 200 EMA still remain big resistance from 16.7k-17k so I expect it'll take a catalyst to break above them this time. This still leads me to more downside. I'm targeting at least 16,3k for BTC then 16.1k (where I'll be DCAing both times).
If you enjoyed my TA, please send a boost my way and leave a comment :)

Financial Wave. Bitcoin, 1hOur priority scenario in BTC is wave b up to $17329. Upward movement may start from the level of $16373, if the price falls below this level, we’ll reconsider the scenario.

BTC/USD LongAn idea with a broad perspective on bitcoin. My assumption is that if it breaks the ~17700 level , with upward direction then possibly we can see the price hitting the 20000 level , in order to complete the pattern. So i will enter in the trade if the price closes above 17700 level on a 4H chart :)

BTCUSDT 4H:27/12/2022
You can see possible scenario and important area on the chart.
If you have a question, feel free to ask.
💡Wait for update!
🗓️27/12/2022
🔎 DYOR
💌It is my honor to share your comments with me💌

#btcstarburst Are We really off TRACK?A closer look, off the track we need to be on… The gann lines may tell a different story this is just a study DYOR DCA SAFELY…??

BTC Analysis Log.= = = = = = = = = = = = = = = = = = = = = = = = = = = = = = = = = = = = = = = = = = = = = = = = = = = = = = = = = = = = = = = = =
All contents published here are my ideas / opinions and for reference purposes. Use these contents at your own risk.
I will try to use a single article to aggregate my analysis and monitor price movements.
= = = = = = = = = = = = = = = = = = = = = = = = = = = = = = = = = = = = = = = = = = = = = = = = = = = = = = = = = = = = = = = = =
First of all, I noticed that there are 07 price areas that I am paying attention to and there is a high probability that the market will react in these areas.
Please note: These areas are not fixed and will constantly change over time.
📍 Range: 6300 - 7650
📍 Range: 9000 - 10300
📍 Range: 16150 - 17400 ( ⚓ The trading price is in this range )
📍 Range: 18800 - 20700
📍 Range: 22700 - 24000
📍 Range: 29200 - 30600
📍 Range: 38350 - 39650
As of the time of this analysis, BTC is trading between 16150 - 17400 about 4.5% below its most recent low around 17590 on June 18 and is still holding up.
🔼 Positive opinion:
BTC will continue to fall to 15500 before rising to 18800 - 20700 or better straight to 22700 - 24000.
🔽 Negative opinion:
BTC will continue to rise to 18800 - 20700 and then continue to drop to 9000 - 10300 ( equivalent to 50% of value ) or drop directly to 9000 - 10300 ( equivalent to 40% of value ).
📊 I will continue to update in the update section below. ⬇️

BTC Continues Sideways! What's Next?On the 4h chart for BTC, you can see we broke above the 50 EMA, but are still below the 100 and 200 EMA at 16.9k and 17.1k respectively.
Our Wave Fusion indicator still hasn't flashed a buy but we are close to support at 16.7k so I remain cautiously bullish until we break that. If we go below 16.7k, I'm afraid we're heading to 16.3k, where I'll still be DCAing next. Although if y we break above the moving averages, I'll be looking for a short at 17.3k which is heavy resistance.
If you enjoyed my TA or have any questions about my indicators, please send a boost my way, leave a comment below, or send me a PM :)
