BTC Trying to Break the 50 EMA! We're currently in a very tight range for BTC with the majority of levels being resistance. On the 4h I currently have three moving averages:
Pink - 200 EMA
Blue - 100 EMA
Purple - 50 EMA
As you can see, the purple line (50 EMA ) has acted as resistance for BTC since Dec 20th on the 4h, along with the 100 EMA. The thing we have to realize is there's also support for BTC right below it at 16700. Looking at the indicators, we can see this:
1. RSI had a sharp bounce to the upside recently and is looking to break the signal line (bullish)
2. MACD is starting to flatten out and looks like it wants to cross up (bullish)
3. Above the 50 EMA , we also have horizontal resistance at the 17300 level which coincides with the 200 EMA
With all of this said, my bias unfortunately leans to the downside (4 levels of immediate resistance w/ horizontal and EMAs vs 2 levels of horizontal support at 16700 and 16300). In saying that, BTC is right near support so it's risky taking a short, but you could play your stop right above the 50 EMA at 16900 and set your TP at 16300 for a 3:1 reward to risk ratio. NFA.
If you enjoyed my TA, please send a boost my way and comment below. Thanks :)
Bitcoinforecast

Financial Wave. Bitcoin, 1hBTC found support at $16560, our priority scenario is to start an uptrend from these levels with an upside target of $17300-17500. If the price of BTC drops to $16100, this scenario will be cancelled.

BITF will pump hard (but not yet) - 270 % profitBITF similary to other bitcoin mining stocks has been in a downtrend since 2021.
Bitfarms Ltd., founded in 2017 and is one of the top Bitcoin Mining Companies.
The price is approaching our buy zone. We expect one more drop to retest lows from 2020 and next the accumulation phase before the explosive move up.
RSI on weekly is already pretty oversold but taking into an account bearish sentiment overall, most likely we see one more drop.
In our opinion this stock is very undervalued now. Once crypto market starts recovering, we expect this stock to recover fast. Bottom for crypto market may be not far away (Many analysts believe that the bottom on BTC will be around 10k-12k $) therefore accumulating BITF may be a good idea too.
Good luck

COIN Coinbase: Where Is It Headed?Hello friends, today you can review the technical analysis on a 1D linear scale chart for Coinbase Global, Inc. (COIN), a stock traded on the Nasdaq exchange.
Please review the chart as it is self explanatory. The overall pattern is a bearish one so there is concern for potential downside.
Also noted in the chart: Volume, Support and Resistance Lines, RSI (relative strength index), MACD, and Fibonacci Retracement.
If you enjoy my ideas, feel free to like it and drop in a comment. I love reading your comments below.
Have you read my recent Bitcoin chart and analysis on finding the bottom. See below:
Disclosure: This is just my opinion and not any type of financial advice. I enjoy charting and discussing technical analysis. Don't trade based on my advice. Do your own research! #cryptopickk

Bitcoin could rise above 20k in medium termBack at the beginning of November, Bitcoin has broken under important 18k zone support and had 2 or 3 spikes under 16k.
The drop was expected, considering that it was the fourth month of consolidation before the break. However, the main crypto didn't continue to drop as low as one would expect and instead bounced back up from 16k.
This for me is a bullish sign and a relief rally could come next.
Technically, 16k offers support, and 18k and slightly above zone is resistance.
In the eventuality of a new rise and test of this resistance, I expect a break above, and bulls could look for a rise to the next important level at around 21k.

Bitcoin Market UpdateBitcoin Market Update
Entry $16600
Entry $16400
SL $16240
TP $17200
As new traders here, we're waiting for your feedback. Please like and comment on our ideas, and feel free to ask any questions in the comments. We'll do our best to respond to them all.
We wish you all a nice day and success in your trading today!

Bearish trend continues for BTCHere's a quick look at the 6 hr. BTC chart. A couple of days ago, the price attempted a breakout to the upside from the bear flag but couldn't close above it. This led to a semi-heavy move to the downside, which broke the bear flag to the downside instead!
If the DXY (dollar index) keeps rising, we should expect BTC to continue its move down. And if DXY retraces to lower levels, then BTC may see some upside. Make sure to keep an eye on DXY!
-------------------------------------------
If you like the content, then make sure to comment and like the post :D
Follow me for daily profitable trading setups.
BTC dictates the market. If BTC falls, then Alts will drop as well. Trade safe!

Bitcoin Outlook: 2023 - 2025My outlook for the Bitcoin price for the next 2+ years in detail:
- End of 2022 - Q1 2023: I think this will be the time where we see Bitcoin make a last low around $10,000 - $14,000.
((Accumulation))
- Mid 2023: I think we will see some volatility (50-80%) with possible prices of $25,000 - $28,000. Bear Market rally as 2019, nothing sustainable.
((Taking some of the table))
- Summer 2023: Due to the announcement of a recession I guess we will revisit our previous low, or even make a new low ($10,000 - $14,000). This will be our last flush before the next Bitcoin halving and the bull market.
((Accumulate again))
- Q4 2023 - Q1 2024: This will be our grind to the 2023 high (around $25,000 - $28,000 as previously mentioned)
((Enjoy your filled bags))
- Q2 2024 - Q4 2024: Full on Bull Market where we will see a 6 figure Bitcoin and prices as high as $140,000 - $160,000. (A 10x move from the lows)
((Start taking profits))
- 2025: The next Bear Market will start.
------------------------------------------------
*Not Financial Advice, just my 2 cents*

Bitcoin past & futureI discovered some major periods.
Mark this: 371 day and 553 days. Plusminus couple days or weeks. When was the first halving, we have got new significant peak after 371 day, and a second peak at 553 day. It happened again in 2016-2017 and 2020-2021.
The bearmarket started after halving 553 days, and it was 476 day long two times (2015,2018). There was an accumulation zone, which was 258-406 long two times.
So if I count these periods, the descent slowly ends, and we jump to the accumulation zone, which will starts in March 2023.
After the next halving i count a rapid rising between 100k-300k. If the history repeats itself, we will got new peak in April 2025 and October 2025.
Fingers crossed.

Can BTC Hold Above the 16.8k Support?Over the past few days Bitcoin has shown good resilience, bouncing off of our $16300 support. Now we need it to hold above $16800 for any chance of maintaining this bullish momentum. Here's a couple things that has been concerned:
1. The RSI is crossing to the downside, getting closer to the signal line. This would indicate a change in the momentum and traders taking profit from the recent pump
2. The MACD is starting to flatten out. This indicates losing momentum as well as possible continued downside
Both of these factors are coming into play as we get closer to the weekend. $16800 was such a pivotal point the past few days that I'm thinking we may stick around it for a little while longer. With that said, if you're thinking of taking a long, I would place my stops around $16600. If you're thinking of taking a short, wait until we get to the $17300 level. There's major resistance including horizontal and the 4h 200EMA. I doubt BTC breaks these on the first try.
If you enjoyed my TA, please send a boost my way and comment below. Thanks :)

BTC Bitcoin - Weekly Chart Death CrossToday you can review the technical analysis idea on a 1W linear scale chart for Bitcoin (BTCUSD).
Bitcoin price on the weekly chart shows some concerns as the 200 and 50 SMA looks like it will be crossing forming a Death Cross. This would be the first time a Death Cross happens on the weekly chart for BTC in its history. It is estimated to happen in between January-February 2023. There may be a chance the Death Cross may be avoided if the price moves much higher or lower quicker. I see price come down to $7K-$8K. I still don't think that will be the bottom, but it may be a temporary bottom.
I have been calling drops on BTC since November and December of 2021. I am more concerned than before that more drops are coming. Be careful.
If you enjoy my ideas, feel free to like it and drop in a comment. I love reading your comments below.
Disclosure: This is just my opinion and not any type of financial advice. I enjoy charting and discussing technical analysis . Don't trade based on my advice. Do your own research! #millionaireeconomics

Bitcoin Dump 12000$ ? CRYPTO MARKET UPDATE
Bitcoin support levels - $16,700 and $16,300 strong Support
Bitcoin resistance - $17,300 and $17,800 strong resistance
———————————————————————
Analysis -
BTC Support is at $16,700 and $16,300. Resistance is at $17,300 and $17,800. Trade carefully and manage risk according to mentioned support and resistance levels.
BTC closed its daily candle green at 16895.
Looking at the 1-hour timeframe, 50 MA has been able to provide support to BTC which is around $16,700. 200 MA resistance is around 17,100. BTC needs a high volume to successfully break out from 200 MA resistance. If BTC is unable to maintain 16700 support then there will be a higher probability towards testing of the next support which is at 16,300.

Bitcoin Next ALL Time High If $15,473 is actually the #Bitcoin bottom, we will have an All Time High of $185,068 in the next cycle.

Bitcoin BTC Price prediction for the end of the yearThis week we have the CPI report and the FED meeting. I expect the stock market to go down and cypto to follow it.
My price target for Bitcoin BTC for the end of the year are the following:
BTC/USDT short
Entry Range: $16900 - 17100
Price Target 1: $16280
Price Target 2: $15990
Price Target 3: $14990
Stop Loss: $18265

BITCOIN - CHRISMAS MOVES Usually, in the first moment Bitcoin will get a high retest of new range. First Range would be retest of 17600 - 17800 , where from that range we would see a nice decrease to retest 16950 - 17120 level, after which Bitcoin will take a second steep to retest 18120 - 18200 range. Somehow from there.. Bitcoin may retest lower range again at 17120 - 17300 level. This somehow will make Bitcoin to do an potential Double Bottom Pattern, and this somehow will result a nice increase in price towards 19200 - 19800 level.

Bitcoin AnalysisAt This Moment Bitcoin Is In 5th Wave Which Started From 25200
In 5th Wave We Know There Are 5 Subwave 1 & 2 Already Completed, 3rd Subwave Started From 21400, In This 3rd Subwave, There Are Total 5 More Inner Subwave (2 on theme are complete at 18380).
3rd Inner Subwave of 3rd Subwave of 5th wave wave 5 wave aswell - In this chart I am showing you those 5 wave in this chart
I hope this clear for you all

BTC Decending Triangle ConformationIt looks like Bitcoin just get the conformation for Decending Triangle pattern in weekly.
If the price goes down 15.5 k, more drop can be expected. In that case, let's see if the 12-10 k range will hold the Bitcoin or not...
If price can hold up on 15.5 k or go above 18.5k, this formation will not be valid anymore.
This is not a financial advice. This is just a trial.

BTC Bitcoin Price Review - Short TermToday you can review the technical analysis idea on a 1D linear scale chart for Bitcoin (BTCUSD).
The Bitcoin price looks like its forming a lower high as part of the downward market structure. There is a chance for the price to go higher as shown in the chart before heading down lower. Targets shown in the chart. To support the analysis, I have included the Ichimoku Cloud, RSI, Volume Profile (VPVR) and Fibonacci Retracement.
I have been calling drops on BTC since November and December of 2021. I am more concerned than before that more drops are coming. Be careful.
If you enjoy my ideas, feel free to like it and drop in a comment. I love reading your comments below.
Disclosure: This is just my opinion and not any type of financial advice. I enjoy charting and discussing technical analysis . Don't trade based on my advice. Do your own research! #millionaireeconomics

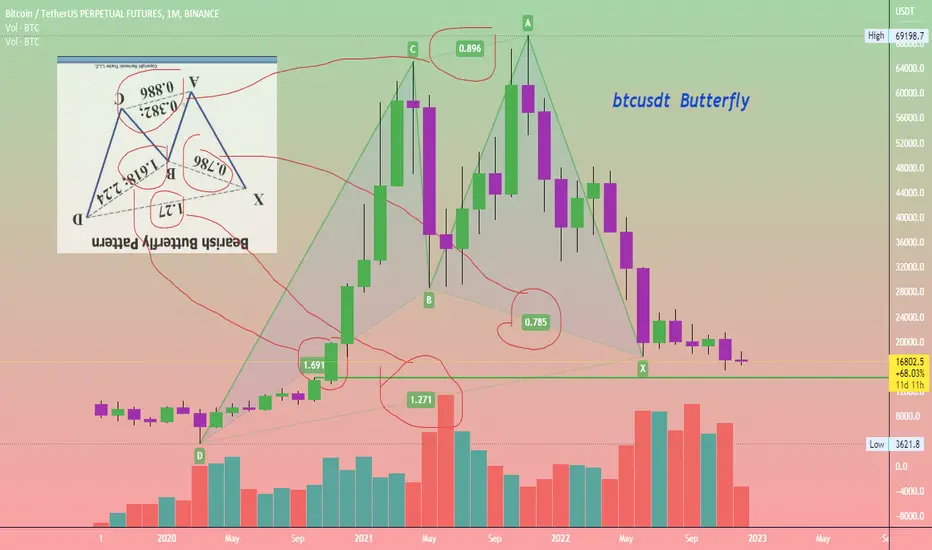
Btcusdt also Completed Harmonic on 1 Month time frameBtcusdt also Completed Harmonic (Butterfly) Pattern in Different way on 1 Month time frame
we can Expect we are near to to the Bottom .
DYOR
NFA
Bullish Divergence on Bitcoin Bitcoin has been in a downtrend a long time, last bear market i was here, i called the bottom, i longed 3,700 i will do the same this time too, bullish divergence on bitcoin 1 hour does not look great for bears.
Currently bitcoin is stuck in a liquidity lock but over the new years period this liquidity will decline and the liquidity lock will become reduced. From a fundamental perspective many are expecting global markets to worsen, i think these people are negative parrots that refuse to understand the technology and the adoption of that tech. I am a Bitcoin bull right now, below $20,000 bitcoin is a bargain, people would have done anything to buy here just a few months back, bitcoin needs to fill the liquidity gaps around 25-30k so this would be my target for early next year heading into tax season as weird as that sounds.
If you want to know more about my thoughts, follow me on YT.

BTC [BITCOIN] | POSSIBLE ROAD TO 10K. ???BTC ROAD TO 10K. ???
Now i see bitcoin price drop and drop again but till now wait for Lower low for confirm to 10K.
It possible ?? look on lower line it's relative So it has a chance to go down to 10k.
Ton Day_Trader

Bitcoin, 15minOur priority scenario in BTC is the rise in the price in wave b to the range of $17300-17500. If the price continues to rise above $17,500, our markup will change.

BTCusdt - local up, pls.
If you like the idea, please "Like" it. This is the best "Thanks!" for the author 😊
P.S. Always do your own analysis before a trade. Put a stop loss. Fix profits in installments. Withdraw profits in fiat and please yourself and your
your friends.
