Financial Wave. BTC m15Bitcoin has consolidated above $17,000, which confirms our priority scenario. Growth to $18000-18800 looks most likely. A drop below $16,500 cancels this scenario.
Bitcoinforecast

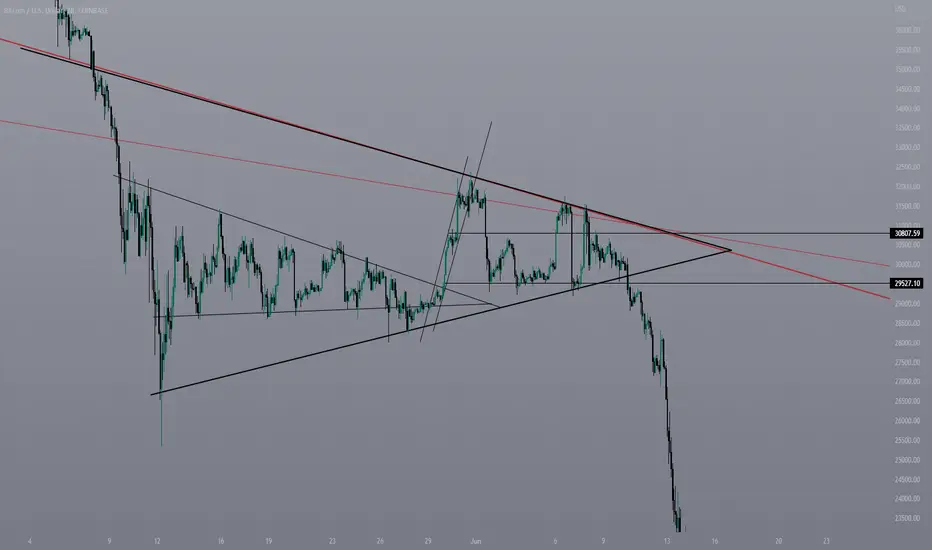
BTCUSD 1DAfter breaking the range of 18,360 to 17,650, the price is pulling back to this range, and it is also in a descending channel, now it is expected that the price will complete its pullback and then continue to fall, and the targets of 13,870 to 13,000 (orange box) and The next target is the range of $10,560 to $9,800 (green box) available

💥Bitcoin to rise to $20k before a dump below $15k#BITCOIN (UPDATE)
Clearly shown on the chart is bearish breakout from the trendline support and a pullback in play. When the pullback is complete, then another drop below $15,000
Not a financial advice🙅🏼♂️
Share your opinion in the comment section✍️
Please support this idea with a LIKE👍 if you find it useful🥳
Happy Trading💰🥳🤗

BTC/USDT - Short Setup Brewing?🔮💰Looking at the Bitcoin 4h chart, we've mapped out some key level and a potential short setup. 📉
The first being the 17.3-17.4K resistance. If we work up to that area, it might be worth looking at some shorts.🔨
A move back down to 16.9K or lower in the near term would be ideal.
If we do leg down beyond that, we might be in for a serious leg back below 16K, into the 15K range.
Macro environment will also be at play here with the PPI #'s coming in pretty ugly. 📰
It will be interesting to see how we close out the last month of a brutal 2022 for all markets.
As we say in almost all of our breakdowns, we think 2023 will be pretty ugly and recession is HIGHLY likely.
Only time will tell. Stay safe & eyes peeled out there on the charts! 👀
-TucciNomics
Chief Overlord, AlgoBuddy

Bitcoin will take another upward move to 20Kthe big falling wedge will bread soon toward the upside
this is my opinion but not a financial advise

BTC: Ascending Wedge w/ Liquidity TrapHere is the second part of my "There will be blood" chart (check it out below), which accurately forecasted the next redistribution event for BTC. It's becoming a familiar occurrence: an unmistakable ascending wedge pattern emerging with dominant supply expansion in the pullbacks presupposes more downward action to come, but perhaps not before a quick liquidity grab to the north. Since July there have been a myriad of rising wedge redistributive ranges in the PA. This appears to be yet another.
** If you have strong hands, patience, and like big wins, be sure to SUBSCRIBE to this channel. Here's why: I track all USD-paired cryptocurrencies on all the major CEXs and seek out the most lucrative swing trades and runners. All my charts are clean, straightforward, and easy-to-follow with exceptional win rates ranging between 80-85%. Check my chart history and see for yourself. My TA is based on a combo of Volume Spread Analysis, Wyckoff, EW theory & Fibonacci ratios. Stop getting smashed and start winning in crypto. My charts will teach you how.
*Not financial advice. DYOR and trade at your own risk.

Bitcoin buy (long term investment)I position myself as a scalper in the forex market, but as many other traders, I'm interested in Bitcoin as the main tool in the crypto market. Therefore, I consider investing in Bitcoin only for a long-term period.
By looking monthly chart we can see two clear break of strucures (BoS). So I'm looking for buys.
The next step I draw my point of intrests (POI) which are 50% and 75% of high and low of first BoS (red purple circles). That's my buy zone.
Then I build Fibonacci extensions from highiest levels and I've notiesed the main key level. It's just near my buy zone (50%). With high probability price will reach my first entry - 6940.00
I also recognized that there is liquidity (LQD) line (from 2972.01 till 3955.25). Half of the liquidity range falls under my second long entry (75%) so most likely is that price will also reach my second entry - 3470.00 for 1 Bitcoin.
Let see how it will work.
Good luck to everyone;)

Bitcoin Right Now looks like when Bitcoin was at $32,000 Price is behaving similarly to when Bitcoin was at $32,000, lots of bull traps then a huge drop to $20,000 I think we could soon see $10,000 for Bitcoin.
Drop to $14,000 for Bitcoin SoonI cant predict or know how price will go but I have a strong feeling we wont be making any more highs now, this pump was the highest we will see bitcoin for a while. We could see another pump but I would short.
I highly doubt we will break above the white semi circle as there is strong rejection from those levels.
NFA, do what you believe at the end of the day.

Bitcoin Will Hit 100k Bitcoin MARKET UPDATE
Bitcoin support levels - 17000$ and 16500$ strong Support
Bitcoin resistance - 17500$ and 18000$ strong resistance
———————————————————————
Analysis -
BTC Support is at 17000$ and 16500$
Resistance is at 17500$ and 18000$
Trade carefully and manage your risk according to mentioned support and resistance levels.
Looking at 1 hour timeframe, currently Volume is slightly decreased Currently BTC RSI is at 67.95 BTC dominance is at 40.65 and Total Crypto Marketcap is at 858.3Billion

Bitcoin – bears dominate below this levelHello, everyone!
My last call was quite accurate, after trendline resistance Bitcoin has started it’s dump, but today it faced with difficulties to break down the strong support. Today I defined the invalidation price level and first target if I am correct.
Let’s take a look at the 1h time frame BTCUSDT chart of the WhiteBit exchange. Bitcoin has finished the upward Elliott waves cycle at $17300 where I opened short. This cycle represented wave C of higher degree. Hence I considered that the market is about start new impulsive wave to the downside. Now I suppose that wave 1 have been already ended, wave 2 was represented as the flat correction which hit exactly 0.38 Fibonacci level and dumped to $16700. I think it is the wave 1 inside wave 3. Current bounce is the wave 2 inside wave 3. The most rapid dump is about to start if I am correct.
If you have not still executed short trade, I think is is proper time to do it. Stop loss is tight. Potential reward is great. If I will be wrong it means that Bitcoin will break the $17400 local high and I am not so good as I think about myself and will continue studying trading chaos (of course I will continue anyway).
Best regards, Ivan

BTCUSSDTForming Falling Wedge In Daily Timeframe
After Upside Breakout Can Bounce Massively
Wait Patiently For Breakout
Its Not a financial advice Do your research Before Taking any Action

BTC Possibility part 2 BTC getting local resistance and volume is dipping. Its still above trend line and forming a triangle pattern but has been respecting it but its too much glued to the lower side. Any Volatility can break it and push BTC to re-test Trendline again. BTC dominance has a resistance at 40.3 so we might see BTC dominance head down which might push BTC further up. Overall the sentiment is still bullish.

Bitcoin Bounced As Predicted! What's Next?From our previous idea, we can see that Bitcoin played out perfectly :)
BTC bounced off of our upwards channel and continued to the 200 EMA (as we previously predicted). Now I'm watching to see if it can break above that 200 EMA (17,300 level). If not, then I'm looking to retest the bottom of the channel again (16,800).
If Bitcoin does break the 200 EMA then I'm looking for it to touch the 17, 640 level (major resistance).
If you enjoyed my TA, please leave a comment or send me a PM :)

Get the Picture?this chart should fill in quite nicely over the years, looking forward to watching it progress, and will be documenting all the way to the top

BTC Overbought Distribution & Volume Spread AnalysisThis is an expansion on my previous Wyckoff distributional schematic. On this chart I've highlighted the regression trend, starting at the top of the UTAD and following the waves down to the second LPSY re-distributional consolidation. At the top of the macro trend are overbought areas where the MMs are dropping supply to strangle the army of weak-handed retail longs. If this schematic plays out, this LPSY (#2) should mitigate the PSY point in the last markup before the price drops out of the present trading range and freefalls down to the lower Fibonacci retracements.
The VSA reads support distribution as well. Intra-range we saw clear supply predominance, with the systematic shrinking of demand as the TR consolidated. Now, in the regression trend, the volume is again confirming the bearish bias with expanding supply in the pullbacks and diminishing demand in the upthrusts.
** If you have strong hands, patience, and like big wins, be sure to SUBSCRIBE to this channel. Here's why: I track all USD-paired cryptocurrencies on all the major CEXs and seek out the most lucrative swing trades and runners. All my charts are clean, straightforward, and easy-to-follow with exceptional win rates ranging between 80-85%. Check my chart history and see for yourself. My TA is based on a combo of Volume Spread Analysis, Wyckoff, EW theory & Fibonacci ratios. Stop getting smashed and start winning in crypto. My charts will teach you how.
*Not financial advice. DYOR and trade at your own risk.

Financial Wave. BTC m15Our priority scenario is confirmed by the growth of Bitcoin. The price of BTC may reach the range of $18000-18800 in the next few hours. Bitcoin price drop below $16500 cancels this scenario

BITCOIN 1h Update 08 December 2022Hey is is Artem update on BTCUSD price action on 1h TF. Looking for movement in range 16660 up to 17200 during weekend.
Price consolidating at rising support lines before fake breakdown and rise. According to this behaviour I am thinking price will rise afterwards and break Green Resitance line to move up 17200.

Classic BTC Wyckoff Distribution RangeBTC has formed a classic Wyckoff distribution range, and if my hunch is correct, we are currently trending in the final LPSY (last point of supply). This is where retail traders hoping for a moonshot rush into positions only to get smashed by a battery of short positions put in place by Smart Money. We've already seen this happening, with the rally to 17.5 a few days ago, only to retrace back to the 16.8 zone on increased supply. I've been swing trading and analyzing cryptocurrencies for a long time. These Wyckoff schematics are wickedly accurate and rarely deviate off the beaten path, because, ultimately, human beings are controlled by fear and greed in the markets, and until these twin motivating factors are dealt with, price action will create these predictable waves.
If you have strong hands, patience, and like big wins, be sure to SUBSCRIBE to this channel. Here's why: I track all USD-paired cryptocurrencies on all the major CEXs and seek out the most lucrative swing trades and runners. All my charts are clean, straightforward, and easy-to-follow with exceptional win rates ranging between 80-85%. Check my chart history and see for yourself. My TA is based on a combo of Volume Spread Analysis, Wyckoff, EW theory & Fibonacci ratios. Stop getting smashed and start winning in crypto. My charts will teach you how.
*Not financial advice. DYOR and trade at your own risk.

My plan for the next 10 days on BTCI dont really feel for making a long description..
Personally i find it likely we hit these blue marked price targets in the time period of 10 days.
NFA, DYOR - we shall see.
Im swing trading it (short)

BTC/USDT Binance technical analysisHello,
Today I will look at the BTC/ USDT pair on Binance in the 4h timeframe. The demand zone is sitting around 16K, and the supply zone is around 17K. I can see that the descending triangle is formatted, and I am expecting that the price will go downward from its current position. I am expecting a downtrend, bearish movement, and the price of Bitcoin to go down to at least $16200 in the next few days. Even if we had some small uptrend situations in the past few days, we are still in a bearish cycle. If the opposite happens (a bullish movement), we can expect the price to rise around $18,000, but I doubt it.
Enjoy & have an amazing day!
BF

BTC Bounced Perfectly Off Our Support!Looking at BTC on the 4hr chart, we can see it continues to be in our upwards channel, bouncing PERFECTLY off of the bottom of the channel/horizontal support at $16,750.
Right now I'm expecting it to continue upwards and retest the previous resistance of $17,167 (red line) which also coincides with the 200 EMA a little higher at $17,300. If it breaks both of those levels, we're going to $17,640.
If Bitcoin can't break the $17,167 level, then I'm expecting it to come back down to $16,736 and if that breaks then unfortunately we're going to $15,900 (next major support).
I'm also watching the Wave Fusion indicator for any major signals that coincide with said support/resistance levels.
If you enjoyed my TA or have any questions about it or the indicators used, please leave a comment below or send me a PM :)
Check out my profile for other indicators and trading alpha! Thanks for reading!

BItcoin Possibility Bitcoin has been holding above the liquidity zone and also has been following the trend line. It can retest the trend line and then move our if we hear anything terrible from the fed we might retest the 16500 zones. else we already see the gap filled so we might see a move to 16800 and then a move to 18k and then a dip back. Liquidity hunting and Stop loss hunting are now a daily part of manipulation game.
