BTC/USDT Elliott Wave count 4H TFBictoin bullish and bearish scenarios.
Bullish scenario: Bitcoin could go up correctively with an extended flat pattern if the formation in the ellipse is a 12 12. The confirmation of this scenario could be if Bictoin breaks above 17500. Also look at the realted idea for the bullish scenario.
Bearish scenario: Bitcoin could go down if this correction is a triangle for a wave B, which is not yet completed. The proof of this scenario could be if Bictoin forms this triangle and breaks below 16000, which would also invalidate the bullish scenario.
If you like my analysis, give it a like and click subscribe for future counts.
Good luck!
Bitcoinforecast

BTCUSDT 📈 Flash-Crash or Slow-Bleed ?Hi Traders, Investors and Speculators 📈📉
Ev here. Been trading crypto since 2017 and later got into stocks. I have 3 board exams on financial markets and studied economics from a top tier university for a year. Daytime job - Math Teacher. 👩🏫
We're looking at a grim situation on the BTCUSDT chart; the next local support zone / demand zone is anticipated only around $11500 . This is confirmed by a bearish technical indicator Phoenix Ascending, where the red RSI is around 20 and the grey momentum points towards bears being in control. Now the question remains, is it going to be a flash crash down or a long, cold crypto winter with a slow bleed down to $11K?
Since you're here! Here are a couple of bullish reversal patterns to look for:
_______________________
📢Follow us here on TradingView for daily updates and trade ideas on crypto , stocks and commodities 💎Hit like & Follow 👍
We thank you for your support !
CryptoCheck

Paid in Cryptocurrency: The Salary Of The Future?With the introduction of cryptocurrencies into our lives, there have been changes in the economy and our habits. In this century everyone wants to access everything easily and quickly. Likewise, employees want to be paid in time without any effort. So, now we talk about the new idea of salary with cryptocurrencies. These days some brands have started to pay in cryptocurrencies. However, we should take a
look at positive and negative effects and also how and where we can find that kind of job.
First of all, I want to explain how and when cryptocurrencies started. At first it was a long time ago when they found the crypto.
Over years they developed the cryptocurrencies and in 2009 Bitcoin has joined our lives. After Bitcoin came out,
most people realized the importance of crypto.
Actually, it was a good idea to invest in Bitcoin because it was so expensive and you could double your money.
After Bitcoin, some altcoins have started. Ethereum, Dogecoin and many more altcoins are also quite famous.
In fact, a lot of people earn money thanks to cryptocurrencies. But you should be wise about it because it’s like gambling.
Therefore, you should be aware of the risks.
POSITIVE ASPECT OF BEING PAID IN CRYPTOCURRENCY
First and foremost, when receiving payment with cryptocurrency, it doesn’t include any tax. Also the transaction of crypto money is so easy. You can do it
from an application. Another positive aspect of being paid in cryptocurrency is that it can be converted into any currency internationally.
Moreover, for companies looking to hire more employees to work online, crypto can be a great way to pay staff evenly and then have them convert to their local currency.
NEGATIVE ASPECT OF BEING PAID IN CRYPTOCURRENCY
Like every good thing, crypto also has a lot of risks as I mentioned before. In particular, you can either earn good or lose for good, so it can be tricky in many cases. In fact, you can check data and do your research but in the end, you never
know for sure. There are lots of parameters that affect the market prices.
Sometimes that relies on other markets, or politics, or sectors, or even a person. By ‘a person’, you might have an idea of who we are talking about. Of course, it is no one other than, mighty Elon Musk.
In 2021, Elon Musk changed the whole market prices by just mentioning Bitcoin in one of his tweets. Something similar happened when he put the symbol of Bitcoin into the description part of his account. But of course, he is fully aware of his
actions. These actions may be a game to him but ethically, the situation he caused is not fair. In times like this, what is fair is not so important. This is because there is nothing to do to change what happened. Crypto-market can get affected by many different concepts. Because of all this, paying in crypto can be risky and should evaluate positive and negative aspects carefully.
HOW AND WHERE CAN YOU FIND A JOB PAYING IN CRYPTO?
If you want to find a job and receive payment with crypto money, there are a lot of websites and applications for that. For example, you can check out these; Bitcoiner Jobs, Proof of Talent, Crypto Jobs, AngelList. You need to apply them with your CV and you should explain why you are interested in this kind of job. Also you should highlight that you know all the risks. There are vacancies for social media managers, product managers, Graphics designer, Bitcoin Developer etc. So, if you are curious or just fond of trying something new, here is your chance!
I hope you found this post informative and beneficial. Feel free to leave a comment :)

Bitcoin Scalp Signal for Day Trading🖥️ We have determined there is a 60% chance Bitcoin will RISE from our current entry point.
📉 LONG - BTC : $16,965 📉
💵 Length of trade: we are expecting BTC to hit a 200 scalp, with a high end of $350 - minimum expectation $200.
🕰️ Duration of trade: we are expecting this to occur within 5 hours of this signal for the Min. Profit Target. Then we see this trade playing out till U.S. markets open Wednesday.
📊🖥️ INDICATOR SHOWN ON CHART : Scot Signal Indicator

COINBASE accumulatingHello traders,
I invested to COINBASE and still buying... It is almost same as buying Bitcoin. May be a bit more safer than buying bitcoin. I believe within next 12 months it will reach 350 USD min. and if bitcoin reach to 120K than COINBASE will be min. 800 USD.
(It's just my idea, not a investing advice, don't listen me.)
What do you think? Share your ideas at comments.

BITCOIN: FUNDAMENTAL ANALYSIS AND NEXT TARGET - LONGBitcoin's bears are advancing with renewed vigor. The digital currency is trading around $16,900, but fears of further complications from the FTX crash, recession, inflation, and geopolitical risks in China could push the rate down to $15,000. Understandably, even the staunchest investors who buy bitcoin on the decline are now worried.
Now $16,900 is a significant pullback from the previous support level of $20,000 that bitcoin maintained over the summer. So far, so good. While you're buying it now, you're still buying on the decline. But now comes the moment of truth: do you buy if the rate falls below $15,000?
Until the FTX incident, $15,500 was considered the worst-case scenario for bitcoin. But then what happened happened, and now there is a new worst-case scenario: $6,000. This would mean a huge 65% drop from current levels and would inevitably lead to more bitcoin bears. It would also lead to a final mass capitulation and runaway investor exit or complete market capitulation.
Previous bitcoin bear markets have required such panic before bitcoin reached its final bottom. In short, the cryptocurrency market must have a moment of such intense pain that even the staunchest bitcoin investor decides to wave the white flag. Most likely, the market needs a final downward move to achieve complete capitulation. Only when bitcoin reaches a final bottom can we expect a new long-term rally.
The good thing about all this is that bitcoin at $6,000 will still be double the bottom of the 2018 bear market. If you buy it at $6,000, you are setting yourself up for a potentially exciting price rise in the coming months.
For example, consider the price projections of California-based crypto hedge fund Pantera Capital. It has set a price target for bitcoin at $149,000, based on its expected performance during the next halving period, scheduled for 2024. According to this model, bitcoin will bottom out by the end of 2022, followed by a gradual recovery in 2023, and a sharp acceleration in growth by 2024. Pantera Capital predicts that the cryptocurrency will hit $36,000 by 2024, and then jump sharply to $149,000.
Of course, that $149,000 price forecast is probably at the upper end of most investors' expectations range. But even if bitcoin retreats only to $20,000, investors who buy that bottom will make incredible profits. This event may not be very likely, but it is definitely in the range of possibility; in mid-June, bitcoin was still trading near the $20,000 mark after the initial market downturn caused by Terra Luna.
There is a popular saying in cryptocurrency circles, "Bear markets are where millionaires are made." That's when regular, everyday investors can buy valuable crypto-assets at the lowest prices. Buying bitcoin at $6,000 and waiting patiently for it to rise in value to $149,000 is the kind of investment that can make you a millionaire.
Yes, it's a very risky investment strategy, especially given the historical volatility of cryptocurrency. And yes, for it to work, you will have to buy and hold it by going through a real experience. The final surrender of the bitcoin market will be head-turning and debilitating. But when that day arrives-when every one of your neighbors says you've gone crazy investing in bitcoin that's when the market will hit an absolute bottom.
Total capitulation in the cryptocurrency market sounds terrible, but it's not terrible. It's just a feature of the system. It helps remove all the selling pressure from the market. Risk-averse investors are being replaced by risk-tolerant and risk-seeking investors, and the market has nowhere to go but up. That's why many remain optimistic about bitcoin. Buy on the downside - and especially on the double dip when the rate drops below $15,000.

Bitcoin is moving exactly as predicted!Hello, everyone!
My last forecast on Bitcoin has been perfectly completed. I don’t want to be too self confident but it looks like I have now better understanding of the Trading Chaos by Bill Williams. It is the best motivation for me to continue studying and practicing this approach and I hope my articles are useful for you. What is next?
Let’s take a look at 1h time frame of the BTCUSDT chart of the WhiteBit exchange. Wave 5 reached the minimal target at $17400 where I have successfully executed short trade. I decided that wave 5 have been ended because of the divergence with the Awesome oscillator. Moreover the wave 4 minimal condition have been met – the zero line crossover on the AO. I wanna tell you that you should confirm Elliott waves with the AO, because without it there is the high probability of misunderstanding the waves counting.
The previous Elliott waves cycle have completed the corrective wave C and now I consider the new bearish wave 5 have been started. Watch out my analysis updates because the market is alive and we have to change our decisions when market shows us the new information.
Best regards, Ivan

BTC is in the last stages of the corrective cycleOur view about the Bitcoin situation.
The corrective cycle that started one year ago is reaching the last stages.
Even though the current price could be an excellent option to buy BTC, we still believe BTC will make new lows until it goes down to the 12,000 level and reaches the Inflection Zone (green area) to end the corrective cycle. From there, we expect it will resume the uptrend and start the bullish cycle that will break the historic highs during 2023.
We strongly believe this will be the last chance to buy BTC at this low price as we forecast that once wave 2 starts (II in orange, the new bullish cycle), the BTC price will never return to this price level.
We will continue monitoring BTC and update you accordingly.
Have a fantastic trading day

Bitcoin rising wedgeHi traders this is my current view of btc, bitcoin was going up for 2 weeks and forming rising wedge pattern.
The latest swing downwards occurs with increasing volume and momentum divergence.
The green line 17841 & 16373 is weekly range of bitcoin options contract with weekly maturity date.
Resistance : 17200 ; 17577 ; 17841
Support : 16805 ; 16635 ; 16373

Bitcoin mini-bull run > NASDAQ reversalBitcoin just passed a massive 28 week MA with a lot of momentum and NASDAQ is poised to go sideways, tentitively/inevitably passing its 28 week MA Friday.
With all the bankruptcies out of the way and the house inviting SBF to an upcoming hearing regarding FTX, welcoming enough positive sentiment to see 21k in the next two weeks.
In addition for alt coins, Crypto.com’s CRO is poised to pass it’s 1 day moving average by the end of the week. CRO correlates 91% with Bitcoin.

Bitcoin about to fall to sub 13kEverything is planned; bitcoin is about to make a big dump to sub 13k
The stage is set
This also means nasdaq and S&P500 are about to take a dump also

Trading opportunity for BTCUSDTBased on technical factors there is a Buy position in :
📊 BTCUSDT
🔵 Buy Now 16988.95
🧯 Stop loss 16669.37
🏹 Target 1 17300.00
🏹 Target 2 17789.35
💸RISK : 1%
We hope it is profitable for you ❤️
Please support our activity with your likes👍 and comments📝

Bitcoin: Recovery modeAfter Bitcoin's short but steep drop, we expect the coin to sink further into the green target zone and finish the green wave 4 between $17 111 and $16 759 before heading back North. Rising to the green target zone between $18 109 and $19 418, the orange wave iii should be completed around the $18 600-mark before dropping down again to end the orange wave iv.

BTC & ETH - Winter Is Coming 🐺📉Taking a look at the Bitcoin and Ethereum Daily charts.
We'll preface this with this; these are solid long term entries if you're not looking for trade setups in the short to mid term.
Bitcoin at $16K and ETH at $1.2K in 10 years is likely going to look like a great deal.
That being said, we think that we're in for a nice move to the downside in the coming weeks/months.
Our latest Bitcoin target is set at $14K, with $10K very possible still. Ethereum we can see dipping down into the 3 digit range with $900 the near term price target.
We can definitely see the worst case of the two play out since we are overall bearish given the current macro climate.
Crypto unfortunately will not find its "bottom" until we see equities find theirs, that being the SP500 and DJI.
Only time will tell if we're being overly bearish.
Until then, we will continue to look for solid trade setups in the short term!
-TucciNomics
Chief Overlord, AlgoBuddy

Bitcoin 30000 ? Bitcoin MARKET UPDATE
Bitcoin support levels - 16,500$ and 16,850$ strong Support
Bitcoin resistance - 17600$ and 18100$ strong resistance
———————————————————————
Analysis -
Bitcoin forming a Rising Wedge which is Bearish pattern. Bitcoin price settled above the $17,000 resistance zone and able to clear the $17,100 and $17,200 resistance levels.
The price even spiked above $17,400 and traded close to the $17,500 resistance zone.
However, the bears were active near the $17,500 resistance zone. A high was formed near $17,440.

BTC Rejects at our Trend Line! I tried to be as detailed as possible with the TA above. Please boost if you enjoyed this thread :)
Bitcoin has been in an upward channel for the past two weeks and just rejected perfected off of the upwards channel resistance at $17,400. It broke down through the micro support of $17,167 and I believe it will reach our next target of $16,700 before having a relief bounce to retest the new resistance of $17,167 and possiblly climbing to $17,640 (our next MAJOR resistance).
If we continue to break the $16,700 support and break down out of the channel, then my next MAJOR support for BTC is $15,900 and $15,600 which were our previous supports Nov 13th and Nov 21st. I'm personally waiting for another buy/sell signal from Wave Fusion, especially if it coincides with a support/resistance level.
If you enjoyed my TA or have any questions about the indicators used and how to gain access (Wave Fusion), then comment below or send me a PM :)
Thanks for reading!

#BITCOIN CRASH IT ABOUT THAT TIME BINANCE:BTCUSDT
Hello everyone bitcoin is about to make another scary move again (11k or 10k range),
I'm not always happy to see bitcoin falling but what do we do?
Yet every fall Is always an opportunity for those who understand. so let go to the main discussion where I'll be expecting the next stop of #BITCOIN price movement.
no long story if you have been following my previous BTC IDEAS if you haven't watched my previous bitcoin ideas go and do so now to understand my price tags and movements.
so, my next stop where I'll be expecting bitcoin is at price ($11,620.45 ---- 10,086.26) at this range do not expect bitcoin to go lower meanwhile this could possibly be the golden button ever!!!!

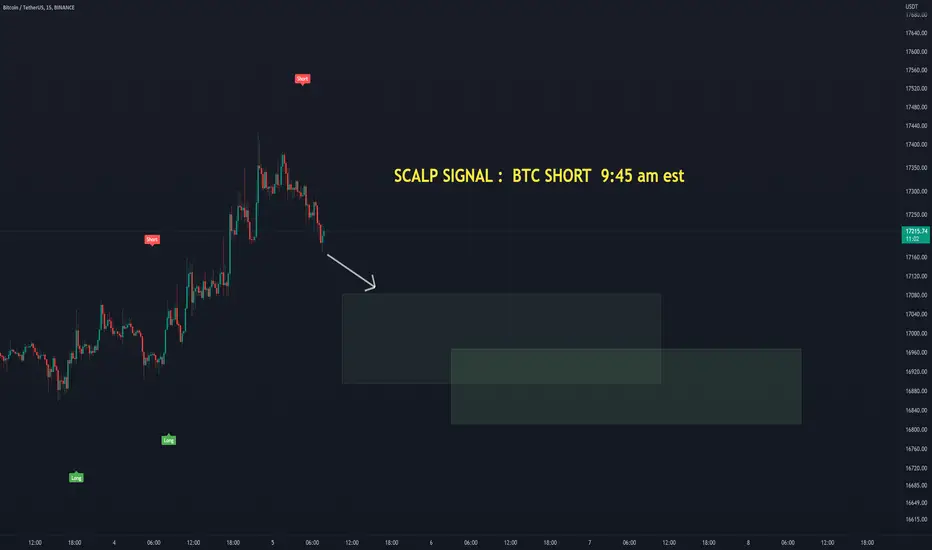
Bitcoin Scalping Signal for Day Trading🖥️ We have determined there is a 60% chance Bitcoin will Fall from our current entry point.
📉 SHORT - BTC : $17,210 📉
💵 Length of trade: we are expecting BTC to hit a 225 scalp, with a high end of $325, and a minimum expectation of $150.
🕰️ Duration of trade: we are expecting this to occur within 1.5 hours - 4 hours. Then we see a maximum duration of 14 hours.
📊🖥️ INDICATOR SHOWN ON CHART : Scot Signal Indicator
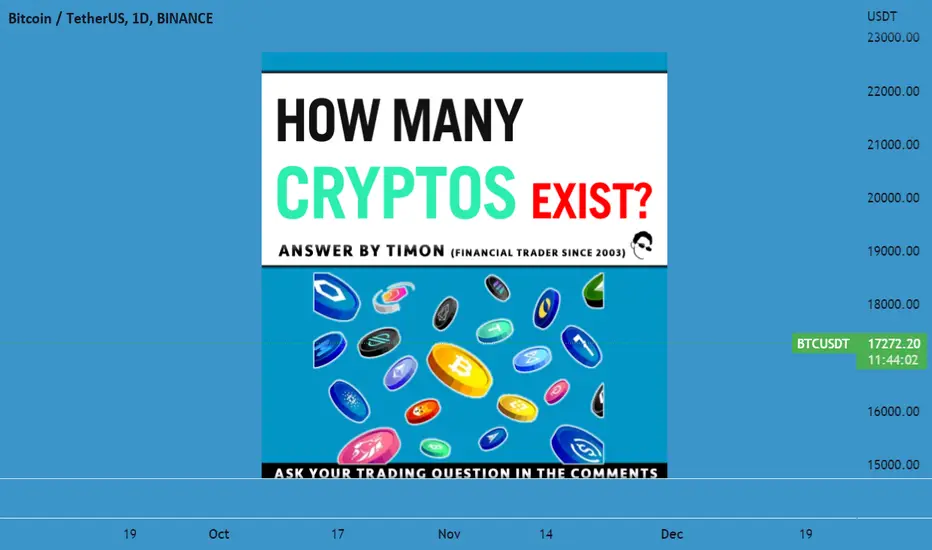
How many Crypto Currencies are there?You’d probably think there are around 100, 200 maybe 1,000 crypto currencies.
And that’s because the news only covers a handful, but I think you would be surprised at the actual number.
Right now, there are over 12,000 different crypto currency coins out there.
And they are increasing by 1,000 new crypto currencies every month.
The amazing thing is, unlike shares, these coins are very easy to create and regulate - YOURSELF.
You can even hire someone from Fiverr to make you a crypto-currency for less than $20.
I could even get a MATI Trader coin made if I wanted to.
But this isn’t good news in my opinion.
You see, most crypto currencies have very little purpose other than making money for their developers through investors buying and selling the coin.
So which cryptos do I trade?
For me it’s only down to two crypto currencies.
Bitcoin and Ethereum. The Father and the mother of the crypto market.
They are the biggest, most recognized and understood than any other crypto in circulation.
But the crypto winter is not over and the bottoms are not set yet.
There still needs to be a lot of fixing and regeneration of confidence before we see any upside with crypto…
I’m sitting on my hands right now, until we see a change in the trend.
$BTC : First Support , Go for 18K ?By reviewing the Bitcoin in the 4 -hour frame time, we see that the price reacted to the first Institutional support level I specified and prevented the price of more fall , we have to see if this level of $ 16900 could make the price rise up to $ 18180 or whether We have to wait for $ 16500 support! I specified the possible scenarios on the chart!
Follow me for more analysis & Feel free to ask any questions you have, I'm here to help.
⚠️ This Analysis will be updated ...
👤 Arman Shaban : @ArmanShabanTrading
📅 12.04.2022
⚠️(DYOR)
❤️ If you apperciate my work , Please like and comment , It Keeps me motivated to do better ❤️

BTC Bitcoin - is this the bottom?Today we take a look at the BTC long-term chart compared to the DXY - Dollar Index.
Negative correlation
The dollar index has a strong negative correlation against the BTC. A negative correlation of -1 means that when DXY makes +1%, BTC makes -1%.
In other words, when the dollar rises, the BTC falls and vice versa.
Top and Bottom Formations
In the chart it is very easy to see when the dollar formed a bottom, BTC formed a top and when the dollar formed a top, BTC found a bottom.
Current situation
We are currently in a top formation of the dollar and as mentioned several times with BTC, we are also already assuming that BTC is starting to form a bottom. This chart and their history would confirm the bottoming. Further we see also in the lower blue chart the correlation coefficient (+1 to -1). Each time before or during which the bottoms and tops were formed, a positive correlation was found. We can see this right now as well, especially the last 2 weeks BTC was able to build a positive correlation with the Dollar Index.
Forecast
Even though the long-term indicators are all already bullish and set for a trend change, we are still waiting for now. As in the 2015-2016 BTC bottom, the TOP formation of the dollar took almost 2 years and thus the bottom formation of BTC also took more like 1 year. This could happen this time as well, especially since we expect a strong recession in 2023.
Another low to $10,000 to $14,000 is still possible.
For all Hodler, it already offers itself to carry out first small long-term entries.
We will keep you updated!

BTCUSD Weekly Volatility Analysis 5-9 Dec 2022BTCUSD Weekly Volatility Analysis 5-9 Dec 2022
We can see that currently the implied volatility for this week is around 9.08%, down from 9.35% last week according to DERIBIT data
With this in mind, currently from ATR point of view we are located in the 54th percentile, while according to DERIBIT, we are on 19th percentile.
Based on this, we can expect that the current weekly candles ( from open to close ) are going to between:
Bullish: 4.6% movement
Bearish: 7.91% movement
At the same time, with this data, we can make a top/bot channel which is going to contain inside the movement of this asset,
meaning that there is a 19.4% that our close of the weekly candle of this asset is going to be either above/below the next channel:
TOP: 18700
BOT: 15500
Taking into consideration the previous weekly high/low, currently for this candle there is :
65% probability we are going to touch previous high of 17250(already hit)
25% probability we are going to touch previous low of 16000
Lastly, from the technical analysis point of view, currently from
Weekly timeframe POV 80% bearish trend
Daily timeframe POV 13% bullish
4H timeframe POV 66% bullish

Bitcoin – my insane swing trade revealed!Hello, everyone!
The information from the previous analysis is still actual, locally we can expect for the local pump to $18k. As you know in my local trades I made a lot of mistakes and try to fix it with the new knowledges and practice in Trading Chaos. But in swing trader I am pretty good. As you know I believed in the bear market continuation when the Bitcoin costs $21500. Now I can see that the bear market still has not been ended, but we can use the opportunities which the bear market will give us.
Let’s take a look at the 1D timeframe of the BTCUSDT chart of the WhiteBit exchange. I drew the wave Elliott waves structure. Now Bitcoin is printing wave 4 inside wave 3. Maximum target for wave 4 is the $18k (just below wave 1 bottom). I wanna to accumulate short to catch the massive move to the downside because wave 5 inside wave 3 is anticipated. $12k is the target. It’s about 25% decrease in price!
$12k is the super safe buy zone. Here I am going to close my swing short and buy BTC with 50% of my deposit. wave 4 which is going to follow after that can easily hit $17k. I am sure that all traders will believe in the new bull market after this move. But all of them is going to be disappointed becuase the wave will turn their mood into depression. That’s what we need to enter the market before the new bull market. Let’s wait!
Best regards, Ivan
