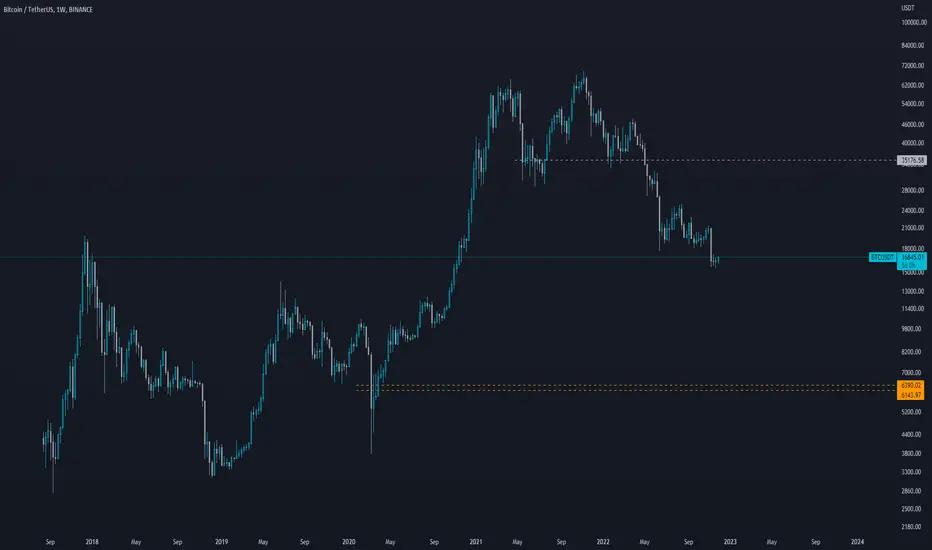
Bit takes the Bite - And away she goes!Double Top, Head and Shoulders formation - Breaking the Neckline... What a NASTY picture. All while Money Flow and RSI are stair stepping down. Beware! Breaking the Neckline can produce a 40% correction.
Readable target @ ~ $25,000
Bitcoinforecast

BTC - What December Holds HistoricallyHi Traders, Investors and Speculators 📈📉
Ev here. Been trading crypto since 2017 and later got into stocks. I have 3 board exams on financial markets and studied economics from a top tier university for a year. Daytime job - Math Teacher. 👩🏫
In today's analysis, we take a look at Bitcoin over Decembers from the past. Which direction does the price usually go, bullish or bearish ? It's no surprise that it seems to be a near equal amount of months up vs. down. Over the 11 months observed, we notice 6 green Decembers and 5 red Decembers. This makes probability near equal. However, we could take a look at a few other interesting observations:
💭 Highest increase for Bitcoin was +58.92% when the lowest decline was only -33.15%
💭 More often than not, two months of the same color follow
💭 The biggest yearly increase was during December 2012 - December 2013 with a whopping yearly increase of 9,899.19%
💭 The second biggest increase after that was from Dec 2016 - Dec 2017 with +2,681.15%
💭 The biggest yearly decline was from December 2017 - December 2018 with BTCUSD losing -84%
The crypto winter that started in December 2018 was one of the worst yet... But with the industry under pressure, could this year be the new record? IF BTCUSDT were to drop to $11 000, that would be a -81% decline from last December.
From all the above... Which way do you think the price will go during December 2022 ?
_______________________
📢Follow us here on TradingView for daily updates and trade ideas on crypto , stocks and commodities 💎Hit like & Follow 👍
We thank you for your support !
CryptoCheck

btc to 14400 winter is comingBitcoin trend is obviously is downtrend and will hit 14400. at 21000 ready to get short positions

Are the bad days of crypto coming to an end? List good cryptos Almost 11 months ago, I suggested that if you haven't left the market yet, it's time to sell your cryptos. Some of my colleagues thought I was crazy, but some who were more experienced had realized the reality even earlier than me. "WE WERE IN EUPHORIA STAGE" As if crypto traders were drunk.
With sincere thanks to @LewisGlasgow
According to the idea I've published on tradingview.com I've sold my holding gradually and start to take more short positions than long ones!
Now I believe we are around dip of the market! We have seen effect of halving before, I think it is going to work well for crypto holders in around 2 years.
The only bad news is war! China threatens Taiwan! Islamic republic may attack Persian Gulf neighboring nations and the most important one is Putin invasion of Ukraine. I wish peace for the world and I also wish people stop crazy dictators soon but unfortunately this war seems to be continued.
The other good sign is last super bearish week of BTC! Yeah you may be surprised but it's almost a good sign! Of course, this phenomenon is so rare that it cannot be a decision reference for the market, but it can help us to be more confident if we have the stronger reason to buy (Halving) .
Just before 2019 and in early weeks of 2020 two super bearish weekly candles was observed under moving averages of 20 and 100! in those candles we see a net bearish move that was bigger than 1.5 times of AHL (20). by AHL (20) I meant average high-low of the last 20 weeks.
We see a great bullish move after that!
Those weeks were definitely dip of the market and traders never see the price like that till now!
Right now! there are again a super bearish candle! It seems BTC like to take the last steps bigger.
If market is going to be bullish, which cryptocurrencies do you recommend for hold? please comment.
What do you think about these 6 ones!
LEO
XCN
TWT
OKB
BNX
GMX
My suggestion is to start buying slowly, even if this scenario is true, the process of starting to climb may take up to a year.
Also, don't forget that this is not a trading proposal and don't forget capital management and risk management. Only amateurs speak with 100 percent confidence in the market and there is always a possibility of failure of an idea.

Is the SPX500 about to break this massive resistance?!!This resistance line is in place since all the way back in January '22. The moment we break this I am expecting a massive relief rally for the SPX500. And if the DXY falls more this will give it even more fuel to make a good upwards move. If the SPX500 breaks we could see the Bitcoin price go up as well.
The break would ne around 4115 ish (Dec 5)
Trade safe!

Bitcoin is about to crash!Hello, everyone!
As I mentioned in my last analysis the correction was not over and I am waiting for the wave C to $17600. Today we saw this pump and I suppose that it’s about to the end.
Let’s take a look at the 4h time frame of the BTCUSDT chart of the WhiteBit exchange. The Bitcoin price found support exactly as was predicted at the 0.61 Fibonacci retracement. Wave B have been ended and the wave C started there. Now I can see that wave C could be close to it’s finish because of internal waves structure. Now the price is printing the wave 5 inside wave C.
According to the liquidity zones analysis we can notice very strong one above $17300. I suppose that the market maker will collect this liqudity before the new deep dive. I have already opened short position at $16800 and will enhance it at the $17200 and $17500. Take profit is below $14k.
Best regards, Ivan

Time to rise !?Greetings crypto people !
As we all know when this positive divergence happen on the chart that means the price already reached the end of descent and we can expect to start new ascending trend soon !

BITCOIN PROJECTIONS 2030Bitcoin to the moon 2030!
I build my analysis based on HIGHS & LOWS at any timeframe; but mostly the long term lately (1H, 3H, 6H, 12H, D, 3D, W, M, 3M, 6M and Yearly).
• Time + Volume = Trend
I will break it down the best possible way.
Any questions?
BINANCE:BTCUSDT BINANCE:BTCBUSD
CME:BTC1!

Financial Wave. BTC m15Our preferable scenario for BTC - the rise in wave C to the level of $19500 - remains the same. We have added short-term targets to our wave scenario that BTC can reach quickly. A rise in small wave 3 could take Bitcoin prices to $18,000 and $18,800. A drop in the BTC price below $16,000 cancels this scenario.

Dear BitcoinAfter the short growth and the liquidation of short orders, the price will start to fall to 12,000 dollars by hitting the static resistance and the EMA 100.

Bitcoin target 20300Bitcoin MARKET UPDATE
Bitcoin support levels - $16,600 and $16,300 strong Support
Bitcoin resistance - $17,000 and $17500 strong resistance
———————————————————————
Analysis -
BTC Support is at $16,600 and next Support is at $16,300. Resistance is at $17,000 and next resistance is at $17,500. Trade carefully and manage your risk according to mentioned support and resistance levels.
BTC closed its daily candle green at $16,442.
Looking at 1 hour timeframe, BTC was able to break out its $16,600 resistance with high volume and turned it into support. Currently BTC is trading around its resistance area $17,000.

BTC Bottom TheoryTheory that im currently working with would dictate that we take out these previous lows before flipping momentum. Meaning there is significant amount of pain to come. I think if the casual traders in general had a better idea of what they were doing, than the market would find equilibrium easier. As it stands, there are too many easy targets out there with the ICT and "smart money concept" traders misunderstanding price action that the market just gobbles them up. Be careful out there folks, and good luck traders. I would say not to get truely macro long until this 7k level is swatted at the very least by a wick. Ideally these lows are taken out.
Is this the Future for Bitcoin? $200,000, $800,000 & $2,100,000Just for fun, assuming bullmarkets and bearmarkets behave similar for the next 10 years.
I bet we will see Bitcoin at $1,000,000 By 2028-2030

A Second Guess? or On Second ThoughtTyme Sycles (aka Time Cycle s )
This nifty tool tells you much about the ebbs and flows.
1. Use previous Lowest Low
2. Use previous Highest High
3. Notice how it aligns with all the major tops and bottoms in this bear market.
Bonus: our next High is on Jan 4th 2023, though we haven't met our bottom (as that calculation takes a different tool).
Very simple way of keeping track of the rollercoaster ride.
Comment below and give it a like now. Good work @everyone now lets get it!

BTC going Sub 40k!? then 20k? Buy zones BTCAs shown on chart, Daily moving averages are on a strong buy signal however weekly is still falling from overbought, trading both ways is best.
I'm looking to buy in either zone on confirmation as a fakeout play of the rising wedges. 20k looking increasingly likely medium term, but nice bounce should happen sub 40k first unless equity markets crash hard and appetite becomes really bearish.
Personally I think we will see the usual Santa rally later this month first before further falls.

BITCOIN overview March 25, 2024Hello traders! The new halving event is being closer and closer, and as we previously saw at this events, we can expect the price creating an all time high, again. Until then, the price is retesting once again a strong zone of support, which was acting as resistance at the all time high back in 2017 and 2019, and we can expect some accumulation in this zone, after which the price to move horizontally until March 2024, when an all time high is expected.
What's your opinion? Let's discuss!

Bitcoin Next Possible Target is $20k ?Bitcoin MARKET UPDATE
Bitcoin support levels - $16000 and $15600 strong Support
(Buyers)
Bitcoin resistance - $16,300 and $16,600 strong resistance
(Sellers)
As you know Market depends upon Bitcoin movement so trade with risk management.
———————————————————————
Analysis -
BTC Suport is at $16000 and Strong support is at $15,600. Resistance is at $16,300 and $16,600. Trade carefully and manage your risk according to mentioned support and resistance levels.
BTC closed its daily candle red at $16212.
Looking at 1 hour chart, BTC bounced back from $16,000 support indicating there are signifcant buyers around this level and got resistance from $16,300 . Sideways movement can be expected between this range $16,000 and $16,300 for sometime. Be careful and watch volume. Next immediate support after $16,000 will be around $15800.

BITCOIN 2022Hello dear traders, I hope you had a nice rest and weekend, currently in a few hours we are starting a new trading week, so let's take a look!
BItcoin has been setting the trend for us in the last few months, especially during the Asian session when there were always the highest trading volumes which of course then set the trend.
Since last weekends significant weekly trend setting came during the first Asian session of the new week we can now see what this week will be like and if the Asians can give us a clue as to how to direct our trades.
Bitcoin overall last year which has been all down has become the most traded over Asian time and the whales there have been sending bitcoin lower for a long time. How next ? I have one simple opinion
UNLESS THE FED START PRINTING MONEY AGAIN, THE BEAR MARKET WILL NOT END, WE MAY SEE A SHORT-TERM TREND BUT NOT A BULL MARKET !!!
I THINK WE REALLY NEED TO FORGET ABOUT CYCLE ADOPTION AND ALL SUCH FUNDAMENTALS AND ESPECIALLY CHART INDICATORS AND THINK ABOUT WHY EVERYTHING IS PROBABLY DOWN.
If we look not far into the past we find that BTC had already reacted to one single thing earlier in the last bearmarket and ran up when the nasty but mighty stop loss hunter Jerome Powell said enough is enough and started printing money again because interest rates were high and people were already going crazy.
This tells you very simply that high interest rates do not have an acute negative effect on stock markets, in the past years stocks only started falling when interest rates were already high as they are now and we have been going down for a year! The current problem of the US dollar, that is, the advantage problem it has for cryptocurrencies. consists of a very simple thing and that is quantitative tightening, simplistically, pulling printed money out of the market.
IF UGLY POWELL DOESN'T TURN HIS MACHINE ON, THERE WILL BE NO BOTTOM!!

Bitcoin Worst case scenarioI know so many of you may hate me for this price target but this is just chart facts not me 🥴️
as I mentioned in my previous idea, I still belive BTC has strong support at 13.7k and then 12k, but 4k target just worst case scenario IMO and the facts we all can see on the chart.

Bitcoin – fake pump ahead!Hello, everyone!
Last time I considered the ABC correction for the Bitcoin and thought that wave B is going to be represented as the triangle correction, but it looks like now that price decided to print the irregular correction. It’s about to end, hence we have the nice long trade opportunity.
Let’s take a look at the 1h time frame of the BTCUSDT chart of the WhiteBit exchange. If we look in detailes inside the wave B we can notice that it consists of ABC correction also. Wave A has abc 3 waves structure – it is the early sign of the irregular corretcion. In this case everything what we need is to count the 5 waves inside wave C and enter the position next to target zone.
Target zone have been reached – Fibonacci retracement 0.618, but we have to wait for another one leg down – wave 5. After that I anticipate the push to the $17800. Let’s see!
Best regards, Ivan

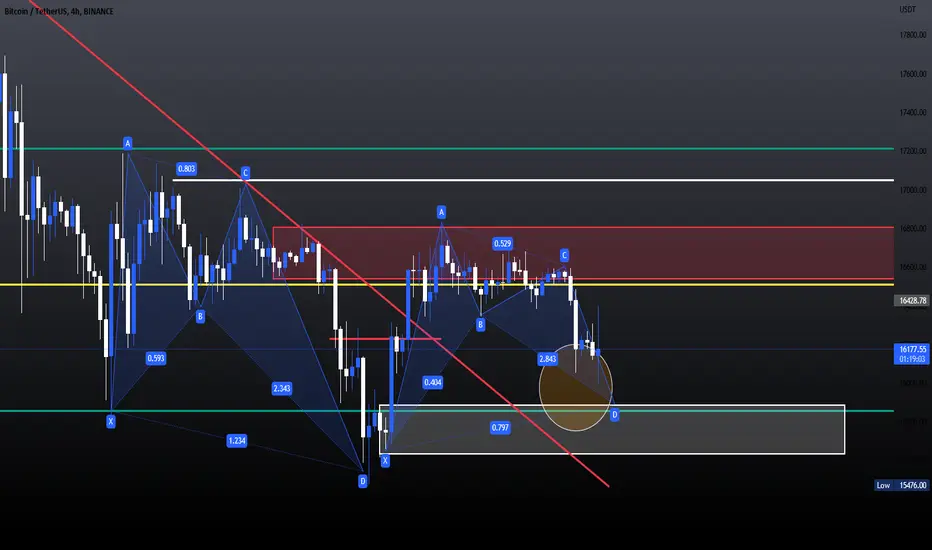
Bitcoin Harmonic Chart PatternBTC has been looking upside for some time now. However, it's been selling off hard now, the bottom support line has held several times, so it will be key that it holds. If BTC falls through the support, I have my sights set at $14,500 to $15,500. Now BTC Bullish targeting these levels.
💢SELL BITCOIN at the best place and price💰🔰You can see Bitcoin analysis in 30 minutes time frame (BTCUSD_ 30min) 🔍🎁
⚡The price has taken a downward trend from the SUPPLY zone, and due to the breaking of the up trend line🖤 and pullback💜 to it, if the price can once again reach the meeting point of the pullback💜 and Resistance🧡, it can fall to the DEMAND zone 🔻
Do you think this analysis can be profitable❓
I hope the analysis was useful for you🤍🌹
_______📈TRADER STREET📉________

BTCUSDT Historic Overlap LONG-TERM Our indicator shows that we are approaching historic data overlap transpired on 18/JAN/2021 .
Somewhat early but we expect next week to be a final decider for Bitcoin trend direction.
We expect another SHORT term retraction to 15,700 k mark and proceed towards 20k Mark with 2 weeks period if successful we shall expect rapid ascend to 40k Mark in a matter of 2 months.
Our Entry for Long-Term position LONG would be set @ 15,700-15,800 mark in a meantime we expect SHORT market with HIGH Volatility.
