Bitcoin Today Next Target 30k ? Bitcoin MARKET UPDATE
Bitcoin support levels - 19500$ and 19000$ strong Support
(Buyers available at this position )
Bitcoin resistance - 20000$ and 20500$ strong resistance
(Sellers available at this position )
Market depends upon Bitcoin movement so trade with risk management. We updated you about Bitcoin movement.
———————————————————————
Analysis -
BTC Support is at 19500$ and 19000$
Resistance is at 20000$ and 20500$
Trade carefully and manage your risk according to mentioned support and resistance levels.
Looking at 1 hour timeframe, currently Volume is low and BTC Price below EMA 10 20 50 100 200 Currently RSI is at 27.8
BTC dominance is at 40.57 and Total Crypto Marketcap is at 978Billion
Bitcoinforecast


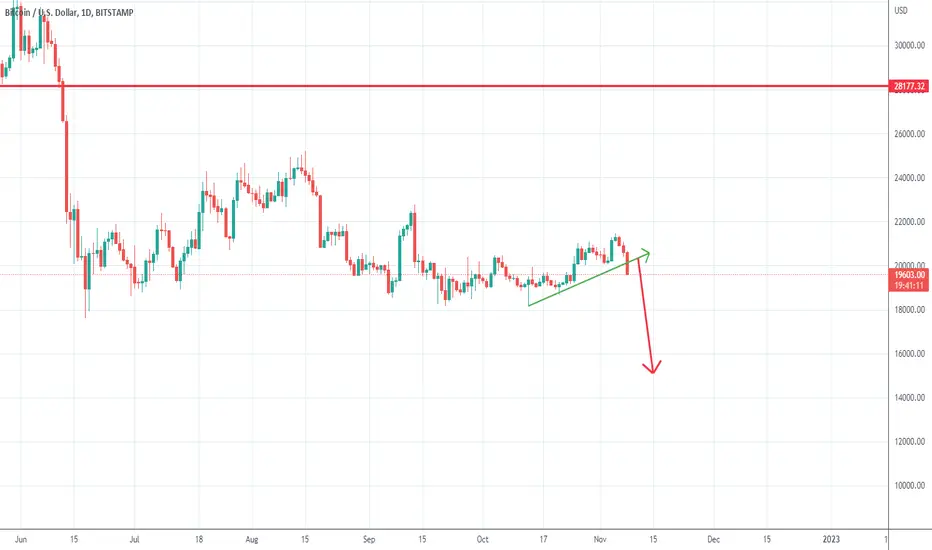
PRESSURE IS BUILDING FOR BITCOINIf the green triangle doesnt hold and the first red line gets breached its lights out for BTC

Bitcoin Hold the UpTrendBTC has been looking bullish for some time now. However, it's been selling off hard now, the bottom support line has held several times, so it will be key that it holds. If BTC falls through the support, I have my sights set at $19,000 to $19,800. Now BTC Bullish targeting these levels.

Bitcoin Dump Big Move Why ? Bitcoin MARKET UPDATE BY
Bitcoin support levels - 19,300 and $18,700 strong Support
Bitcoin resistance - $20,000 and $20,800 strong resistance
———————————————————————
Analysis -
Bitcoin price formed a swing high near the $21,469 level and recently started a downside correction.
Fundemental Analysis
______________________________
As Sam Bankman-Fried's FTX witnesses an intensive selloff in its native token, FTT , Bitcoin , Ethereum , and Dogecoin saw $17.37 million in liquidations, or 45% of the total market liquidation, in the past hour.
Binance topped the table for market liquidation accounting for $24.30 million in liquidations. Market is very volatile so be careful and trade Safe.
Manage your trades according to Market update.

What is going on with Bitcoin?!!!As we see this falling wedge being broken down to the price of approximately 19.7k we did wick to 19.3k to hit some stopp-losses and retested some important key price levels.
Should we be worried? No! Well no for now.... let me explain.
We need to see Bitcoin holding above some key levels. Those levels are:
19.3k
19.750k
20k
If we break 19.3k we could go down to 18.6k
Trade safe!

BTC going to $12,374 (or pretty darn close). #BTCAnalysis Based on inverse fibonacci. You can see where the 227 extension had a price reaction previously, showing this fibonacci is clearly in play.

Bitcoin- Will it break down this time?Since June, Bitcoin is trading in a range and for 6 weeks now, the price evolution is annoying, to say the least.
After a new dive under 20k in October, the price recovered but, looking at the posted chart we can see that bulls are lacking power and this rally is a dead cat rally.
As I was writing this post, Bitcoin lost 500usd and is trading now under 20k.
I expect more downside and this time we can have the break under the recent low.
Rallies above 20k are to be sold and only a daily close above 22k would change this perspective.
BTCUSD intraday trading & back to the home ⬇︎ 08 NOV 2022BTCUSD intraday trading alert
3 steps must fulfill before entry
1. 1st breakout done
2. Retracement done
3. 2nd breakout and see you in the home ⬇︎
More info in my profile..
Good luck traders..

BTC Ascending Wedge BTC & ETH are both in rising wedge patterns, which coincides nicely with the VSA (volume spread) reads I've been getting for the last two weeks when analyzing them. As usual, rarely do we see a direct pullback or rally when these biases have been identified; that would be too easy. Instead count on BTC continuing to draw bull investors and pump riders into the game via micro-rallies, with the intention of trapping them within this geometric pattern when the supply floor suddenly gives way on the cusp of another so-called markup. Beware: the crypto ocean is teeming with sharks.
*Be sure to subscribe for more easy-to-follow charts with high win ratios (80-85% average) in hitting the Fibonacci profit zones. I've been trading crypto fulltime since 2017 and handpick all the runners myself after conducting a series of volume-to-spread reads and Wyckoff schematic comparisons. Check out my past charts & see the wins for yourself.
**Not financial advice. Always DYOR and trade at your own risk.

Can Bitcoin Hit 30,000$ in This Week ?Bitcoin MARKET UPDATE
1: Bitcoin support levels - $20500 and $20,000 strong Support (buyers available at this position).
2: Bitcoin resistance - $20,800 and $21050 strong resistance (sellers available at this point)
Trade with risk management according to the market updates because market depends upon Bitcoin movement.
———————————————————————
Analysis -
As we can see on chart BTC touched 20582 and now trades at 20680. Currently BTC dominance is 38.6 and RSI at 43 and the total market cap is 1.03T. And 1.92% decrease over the last day. So manage your trades according to Market update.

BTCUSD bottom may be in! Pi Cycle bottom !Every week chart presents a new data and there are more reasons to believe that we already saw a final capitulation.
1. By now, the support´s held and the double bottom is still valid (until it breaks).
2. As we can see in the chart, Pi Cycle bottom indicator suggests that the bottom is in.
3. Moreover, RSI hit its lows in June just before Pi Cycle bottom indicator signaled that the bottom is in and it was also the case in the 2018 when the price found its absolute bottom.
4. Bitcoin Rainbow Price Chart Indicator also shows that it´s a right time to buy now. www.lookintobitcoin.com
We expect the price to consolidate for a few more weeks. If double bottom holds, we may not see lower prices and the Parabola will start.
Sentiment on social media is still very bearish. Everyone expects lower prices. It would not be surprising if market does not give us a chance to buy cheaper and many people will be left behind waiting for lower prices.
Below 20k may be a good price for a long term investment. DCA below 20k !

Bitcoin: Down the Rabbit HoleThe future of Bitcoin seems just as unknown as the adventure ahead of Alice in wonderland. It feels like we're currently falling down the rabbit hole and don't know for sure where it's stopping. Primarily, we expect the course to drop further below the support at $17 689. If it continues to drop into the blue target zone between $17 572 - $10 919, the yellow wave (2) should ideally be completed around $16 148 to move out of the blue zone. If Bitcoin finds its way out of the blue zone and heads above the support at $17 689, it should head towards the $22 802 resistance. Furthermore, after touching the $22 802 resistance, Bitcoin will continue to move above $25 200.
In the secondary scenario with a chance of 40%, Bitcoin should continue to move upwards if it touches the $22 802 resistance and could climb its way back to the top if it reaches the $25 200 resistance. We'll specify the future of Bitcoin in our upcoming posts.

Bitcoin hit our target! Now what?Yesterday we spoke about breaking down. We hit the target but what can we expect for the next move?
Well we need to see Bitcoin going back above 21k for more upwards momentum and the possibility to break 21.5k if we don't get enough volume we might eveb break below 20.4k
Trade safe!

Bitcoin BTCUSD Next Possible Move#BTCUSD ( Bitcoin / U.S Dollar )
RISING WEDGE in Long Time Frame #LTF
Rejecting from the Upper Trend Line #UTL
ELLIOT WAVE - Completed " 12345 " Corrective Wave
Break of Structure #BOS need to wait for the Retracement
Selling Divergence

BTC weekly reviewBTC weekly closed NEUTRAL . above $20K but rejected by $21K. overall indicator still favor to the bull (MACD crossed up, Stochastic bounce from oversold region)

Will Bitcoin ever break above it's old trend line? #2 Hey fellow traders and Bitcoin enthusiast,
A month a go I made chart labeled "will bitcoin ever break above it's old trend line?' It was met with overwhelming response from the community as it was my most popularity chart. The charts focus was a look into the indicator "BTC Log Rainbow" coded by BullRider802. I wanted to look even deeper into this chart and indicator and see if there is any confluence to it with any other indicator.... Well I have found one.
"HTF Log Curves Oscillator" coded by quantadelic is the one on the bottom and it's showing the same exact thing. So we have to different Indicators coded by two different coders literally telling us the same thing! As we can clearly see the HTF was in a clear trading channel bitcoins entire existence and then show's a breach in 2020 as the other did, price action then shows a quick recovery to the eventual lack of hitting the top of the channel and the ultimate break though the bottom.
What does this mean? To me, first off, It means the math and coding used is sound. Both indicators separate from each other are reacting in the same way, and we might need to pay attention.
Why do we need to pay attention? The age old saying in investing is why, what was previous support is future resistance. These could very well show us the next bitcoin top and or bottom.
The one thing that is for sure is they are both either showing a slow down in bitcoins parabola or a consolidation period. That still remains to be seen.
Follow along with me and let's find out together.
I would like to thank everyone who has recently followed me, liked the chart and the Tradingview team for recognizing my work and helping this view get out. Once again the support and response has truly been overwhelming.
Thank you.
Please feel free to comment your thoughts or questions down below.
Remember, WeAreSat0shi
Stay blessed!

BITCOIN trade for the weekendWe hope that the market has already processed the news related to the Fed's actions and statements and has calmed down a bit.
So we can try a conservative trade of buying Bitcoin:
Entry $18651
Stop $18089 (-3%)
Take profit $21444 (+14.98%)
P/L ratio 5/1
_____________________
Did you like our analysis? Leave a comment, like, and follow to get more

BITCOIN - BULLISH MOVE 🚀🚀the BTCUSD price breaks the daily Resistance level ,the old resistance becomes new support level ✔
the last higher high is broken 🔥
so, i predict a bullish move 📈 i'm waiting for a pullback 📉
TARGET: 22380.92🎯
if you agreed with this IDEA, please leave a LIKE, FOLLOW or COMMENT!

BTCUSD Weekly Volatility Forecast 7-11 November 2022 BTCUSD Weekly Volatility Forecast 7-11 November 2022
We can see that this week our volatility is at 8.02% which declined from 8.27% last week.
Currently according to ATR we are on 27th percentile, and according to DVOL we are on 8th percentile, indicating in both cases, that we are currently is a quiet market.
And as a matter of fact we can that this was case for the last months, but at the same time , one has to be aware that during this "quiet times", things can change radically.
Now, based on the implied volatility data that we have for this week, lets look into further details.
We can see that currently there is 20% chance, that our candle is going to close at the end of the week either above/below the next channel
TOP: 22600
BOT: 19200
This can also be translated as a 80% chance that the market is going to move within this established range.
At the same, looking at the previous high/low values of the candle, and taking into account the entire history available of data, we can expect that there is going to be a
70% chance that we are going to touch the previous high of 21500
30% chance that we are going to touch the previous low of 20000

Bitcoin is breaking down! What can we expect?As we see Bitcoin breaking down we are looking at the price target of approximately 20,7k. But this can still be a fake-out. If we break back above 21k with enough volume and shoot up to around 21.2k we can conclude that this break down is fake.
Trade safe!

Can Bitcoin Hit 30k in Few Days ?Bitcoin MARKET UPDATE
1: Bitcoin support levels - $20,800 and $20,500 strong Support (buyers zone).
2: Bitcoin resistance - $21,250 and $22,000 strong resistance (sellers zone).
Market depends upon Bitcoin movement so we updated you now trade with Risk management.
———————————————————————
Analysis -
BTC is about to test its support at $20,800 and next immediate support will be at $20,500. Resistance for BTC is at $21,250.
BTC closed its daily candle red at $20,905.
Trade carefully and manage your risk according to mentioned support and resistance levels.
Looking at 1 hour timeframe, volume is high. BTC breaking its $20,800 support would increase probabilities for downtrend and testing of support $20,500 and $20,000. $20,000 is strong support for BTC.

October closing price $20,498 - could be a Buy signal for Nov it is quite obvious what bitcoin is about to do here.
Bitcoin is about to pump our bags. you dont have to short this.
dont get me wrong. nothing in the crypto market is for sure. . .
June - short (-76%)
July - Long ( +28%)
Aug - short ( - 21% )
sep - short ( - 18% )
oct - Long ( +13% )
Nov - Long ( +? )
Dec
Do I really need to go into detail here?
i think the bears in this quarter of the year got nothing to dump. anymore
the entire market in the past month has been on a selling spree,
i would speculate based of TA that bitcoin would hit the levels respectively
Level 1 - $ 23,288
Level 2 - $ 31, 861
tell me what do you think
