Bitcoin Pump Over? - BTC/USDT 🔮Bitcoin (and crypto) seems to be losing some of the weekend / last week steam.
Looking at the 1H and 4H charts on BTC/USDT.
On the left we see signs of a bull flag, however overall sentiment and psych is driving our thoughts on this "potential" move down to 20,000.
On the right, AlgoBuddy showing some confirmation for this move by printing a sell signal on the 4H.
We'll be eyeing up 20K as a key level regardless.
What do you think? Do we breakthrough higher or free fall in the coming days/weeks?
-TucciNomics
Chief Overlord, AlgoBuddy
Bitcoinforecast

Is Bitcoin ready to break out?!As we see a bull flag forming Bitcoin will likely break it to the upside with a price target of approximately 21.6k if we hit that expect a retest of 21.5k before moving up more.
Trade safe!

Bitcoin local support and resistance and next TPsHi hope everyone doing fine.
based on my previous analysis the price reached the first Target , i expect some healthy correction to 22k-21800 because some traders will going to save profit which increase selling pressure , in another hand many sort position with high leverages got liquidate which is good sign of upward pressure .
now price is on important level which can breaks the MA200 (1D) and if it happen and remain for the one more daily candle ,bulls will take the full control.
also RSI is near to level 70 which is good sign for upward movement.
happy trading

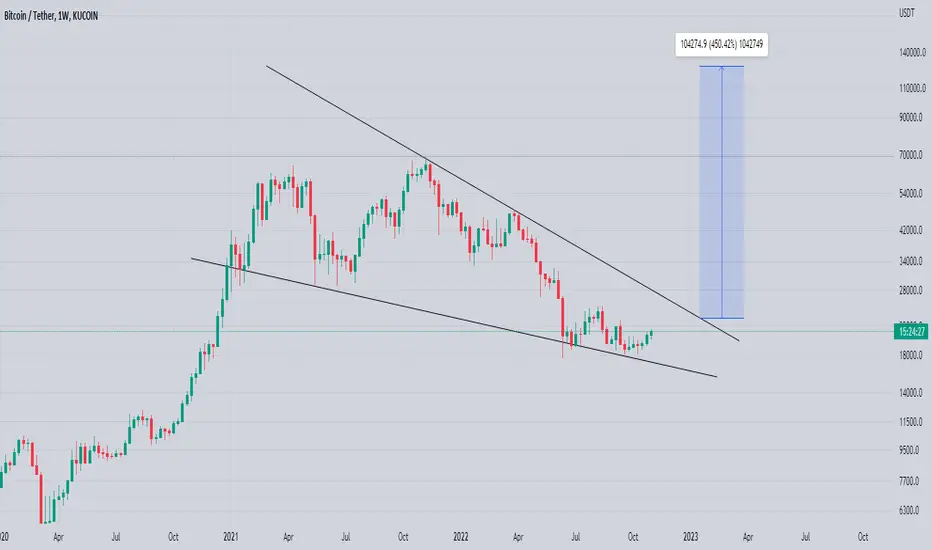
BITCOIN 450% PROFIT POTENTIALforming falling wedge in weekly tf
incase of breakout expecting minimum4 to 5x profit
but we needs to wait for breakout patiently
btc will remain bearish untill breakout
Bitcoin Go Long Above 21530 and Go short below 21053 and 20386This is a short term analysis for 15 mins time frame for bitcoin
Execute Long position only above 21530 with 5 mins candle confirmation breakout for targets of 21645/21768/21919/22089/22193 ( Stop Loss will be strictly 21289)
Execute Short position only below 21053 with 5 mins candle confirmation breakdown for initial targets of 20908/20763/20667/20572 ( Stop loss will be strictly 21190)
For further breakdown wait for 20386 level to break and enter new short position with 5 mins candle confirmation for targets of 20155/19785/19410/19173 ( Stop Loss will be strictly 20572)

bitcoinLook at my chart, MACD & RSI show divergence. I drew some important lines in RSI, MACD and in the chart, the price broken the orange line in the chart and couldn't breakdown 19000 for 20weeks. I think most of traders waiting for DXY, if it come back down, BTC will start new trend to up. What do you think? tell me about your analysis.

Bitcoin Bitcoin MARKET UPDATE
1: Bitcoin support levels - $21,000 and $20,500 strong Support (
2: Bitcoin resistance - $21,500 and $22,050 strong resistance
———————————————————————
Analysis -
As we can see on chart BTC touched 21476 and now trades at 21283. And at 21250 has 9MA which is behave like support. Currently BTC dominance is 38.6 and the volume is low due to weekend. So manage your trades according to Market update.

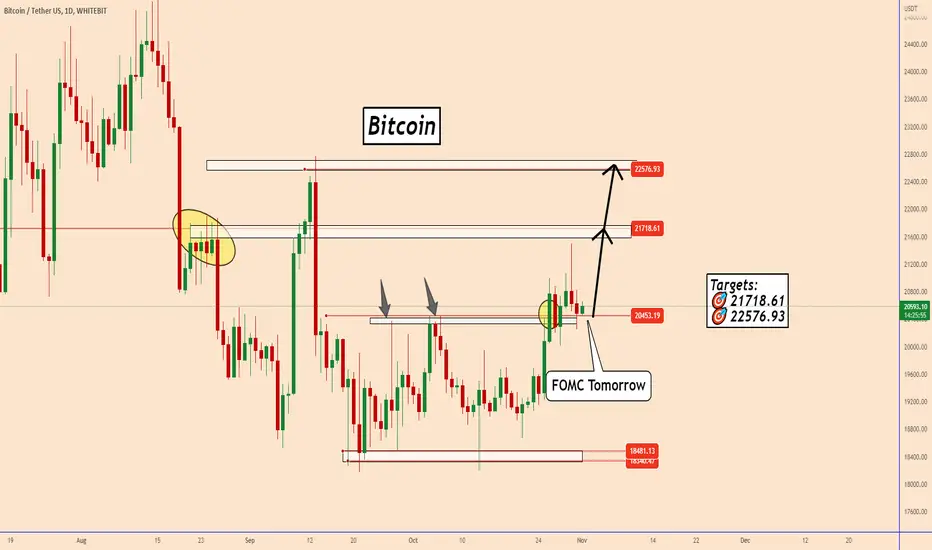
BTC: 20K Support Zone is Keeping The Price Very StrongBTC: 20K Support Zone is Keeping The Price Very Strong
After the price reached 21K we can see that it was broken a major resistance zone.
This is obvious because since the previous week the price correct lower than 20K
and we can say that the buyers are well-positioned in that zone now.
All the focus is on FOMC Press Conference that will be tomorrow.
I am expecting BTC to rise more considering that the accumulated volume was
very high.
Targets:
🎯 21718.61
🎯 22576.93
Thank you and Good Luck!
What can we expect for Bitcoin?As we see this triangle forming we can expect a breakout soon! Will this breakout be on Sunday it might will be a fake-out.
Breaking it to the upside we can see 21.6k
Breaking it to the downside we can see 21k
Trade safe!

Bitcoin Bitcoin MARKET UPDATE
Bitcoin support levels - $21,000 and $20,800 strong Support
Bitcoin resistance - $21,550 and $22,000 strong resistance
———————————————————————
Analysis -
As we have already stated, closing over the daily timeframe support level of 20,800 dollars will boost the chances of an upward move for bitcoin, Positively, Bitcoin closed above the 100 EMA on the daily chart. As a result, it went higher and attempted to test the 21,500-dollar level of resistance but was rejected. The price of bitcoin, meanwhile, is still above $21,000. If bitcoin maintains its stability and closes its weekly candle above 21,000 dollars, the market may see another upward rise.
Currently bitcoin dominance is testing it's previous support which is now resistance (40.42%) If bitcoin dominance gets rejection we might see another good move in altcoins if bitcoin stays stable on the other hand,
Volume is low due to global financial markets being closed at weekends. Trade carefully and manage your risk according to mentioned support and resistance levels.

BTCUSD forecasteHi.
I think that btc should register a new LOW. The desired range for opening a sell position is specified in the picture, but we must wait for the sell trigger in the lower time frame.
good luck

Bitcoin to 20k again? As we can see a rising wedge pattern in btc daily chart . Breaking out the resistance in 21500 and 21800 will give the price of 22k and above. Please do you own analysis trade.

Bitcoin – big danger is incoming!Hello, everyone!
This pump on Bitcoin price was predictable. I told you that the wave 5 is incoming, which has two targets – $21500 and $22000. Today I can say that the pump can be already ended.
Let’s take a look at the 4h time frame BTCUSDT chart of the WhiteBit exchange. Here we can see the the price have formed the wave 4 as the flat correction. Wave 4-b could be interpret as the wave 5 by mistake, but the Awesome Oscillator helps us to identify it. Wave 4 can be ended (in most of cases) if the AO crossed the zero line. We saw it only when the 4-c wave have been formed.
Wave 5 has the minimum target at 0.61 Fibonacci extension, approximately $21500. The maximum target is the $22000 – 1 Fibonacci level. The minimal target have been already reached. Thus we can see the reversal from the current prices. Moreover the divergence is forming on the Awesome Oscillator, whci is another one confirmation. I am waiting for the last sell-off, but have 23% of deposit in crypto in case I am wrong. Market did not give me the nice entry point in long trades with the full deposit, hence I am patiently waiting for the bottom.
Best regards, Ivan

BTC Bitcoin Trading Setup Bitcoin, BTC MARKET UPDATE
Bitcoin support levels - $21,000 and $20,800 strong Support (buyers available at this position )
Bitcoin resistance - $21,600$ and $22,000 strong resistance (sellers available at this position)
You need to trade according to bitcoin update because market depends upon Bitcoin movement so trade with risk management.
———————————————————————
Analysis -
BTC closed its daily candle green at $21,148.
Bitcoin Follows a double-bottom pattern and showed a positive movement. Also, break the resistance level of $21k and the Price is now Holding above 21,000$
Next Major resistance is near $21,900. RSI is also in the overbought area so we may see some retest in Bitcoin price.
According to CryptoCompare’s 2022 Outlook Report, Bitcoin users with over 10,000 BTC in their wallets have also seen an increase, which is likely a result of growing institutional adoption
Volume is low due to global financial markets being closed at weekends. Trade carefully and manage your risk according to mentioned support and resistance levels.

XRPUSD top-down analysisHello traders, this is a complete multiple timeframe analysis of this pair. We see could find significant trading opportunities as per analysis upon price action confirmation we may take this trade. Smash the like button if you find value in this analysis and drop a comment if you have any questions or let me know which pair to cover in my next analysis.

BTCUSD top-down analysisHello traders, this is a complete multiple timeframe analysis of this pair. We see could find significant trading opportunities as per analysis upon price action confirmation we may take this trade. Smash the like button if you find value in this analysis and drop a comment if you have any questions or let me know which pair to cover in my next analysis.
