Why are you sitting on your hands?There are numerous indicators screaming buy for the last 4 months. we are in the best buy zone of our time RIGHT NOW!!. The evidence is over whelming that the bottom is in!!! Why are you waiting? Why are you listening to the news? is it different this time? Not really.
In previous history by the time the lower BLUE band flashed the CM ADX the bear market was ending . so lowered prices preceded the blue. This time was different... what?? yes it was. the BLUE flashed and then the price followed, however the stochastics are CM MACD is about to cross up and this is a bullish indicator. One other trend is this blue buy zone is getting smaller every time it happens.
The bear market looks like it will be ending by March/April of 2023.
Thanks for looking
comments and questions down below.
Bitcoinforecast

Protesting Your Acquiescence!Stop denying the facts!
Your acquiescence is just fear, conquer it and you will see and think clearly!
The bottom is in, everything you need is right in front of you!
Come, March with me into April and beyond. REMEMBER, WE ARE SATOSHI!!
If you need help comment below.
*Look first, then jump. Tradingview.com*

The Grand Inquisitor & Kenobi #2This chart is to be looked at like an inquisition.
You are the Grand inquisitor and Kenobi is Bitcoin . You simply track him to gauge possible future movements. Prices points and time lines are all hypothetical, but are based off past movements. This charts purpose is to get a greater perspective on where we are and where we might be going, seeing the big picture . So, will Kenobi be predictable or does he have some tricks up his sleeve.
In the chart we can clearly see diminishing returns and also there are signs of possibly lengthened cycles, however I'm not fully convinced of that just yet.
I hope so far you can follow up to this point. If you are having trouble understanding please ask in the comments.
Thank you for looking
WeAreSat0shi

The Grand Inquisitor & Kenobi!I do believe that the trend line we are currently on, eventually will break, but when? We are currently testing it with this drop in June of 2022. In my opinion if we break this trend line in the near future (RED) then we will obviously drop much lower possibly even breaking 10k. If not, I see either a retracement (BLUE) then dump and go lower. Or, hit new highs and the eventual break it in the ensuing bear market afterwards (YELLOW) that restarts the cycle over.
So the question of the Grand Inquisitor is... Where Is Kenobi on this timeline?
Be careful, Kenobi is clever.
Let me know what you think down below.
This chart is just for fun with long term outlook. It is not financial advice.

The strongest evidence that bulls are gaining momentumSo here we have The CM ultimate Moving average MFA on the 2 week time frame with the PI Cycle Bottom. On the bottom we have the Stochastic RSI. Combining these three indicators is showing a very powerful case for the bottom being in and that we will in the next few weeks flip bullish. The interactions of these indicators go back all the way to 2011.
The PI cycle bottom is has been modified to only on show the short MA and the color has been changed to orange while the long MA has been deleted to keep the chart clean as it's not useful in this chart.
As we can see here for the entire bitcoin history, when ever the PI SHORT MA has crossed into the ULTIMATE MA it sparked the beginning of the downfall and the ULTIMATE MA only weeks later turned red and prices would start to plummet. The bear market on every occasion has ended when the PI SHORT MA crosses back up through the ULTIMATE MA and shortly after would confirm the bull market by turning Green again. We also have the stochastic backing all this movement by showing the rise in momentum.
This indicator is so good it even caught the COVID crash of 2020 and warned that trouble was brewing weeks in advance.
So... where are we now on the timeline? It's showing that not only is the bottom in most likely but the the bull market could be only weeks away as the stochastics have made a cross up and momentum is building. also the PI SHORT has stopped it's downward momentum and is preparing for it's eventual cross up of the ULTIMATE MA.
The only question left is, where do you stand? Have you bought the dip or are you waiting for lower prices?
My evaluation from this analysis is that we are at least half way through the bear the market.
Please feel free to ask questions or add any comments below
Thanks for your looking and please hit the like.
*Chart analysis is risk management... There is always risk, hence the reward*

Bitcoin Supercycle theory - bottom inBull theory – Bottom is already in for Bitcoin INDEX:BTCUSD
There are severeal technical indicators and measurements that suggest it could be.
Firstly, the 50-week MA already crossed the 100-week MA. Each time this occured, the bottom was already in, both times as the weekly RSI dipped into oversold conditions. The price behavior has also been similar to the 2014 bear market for months with a drawdown of -53% below the 50-100WMA. (-But there is more time for that special fractal in another post.)
Secondly, this current level happens to be a 0.786 Fibonacci Retracement of our entire run up from Covid-19 to the November top in addition as it is the support oft he previous all time high(2017). Furthermore sitting right now on the weekly 300MA.
The Fear and Greed Index has only registered prolonged periods in Extreme Fear(below 10) as we have witnessed at the 2018 capitulation bottom and the 2020 Covid-19 selloff.
Therefore the capitulation happened in June, with Luna (+UST), the depegging of USDT, 3AC, blockfi, Celsius… which are all max fear events. But everyone is now expecting 13-15k thinking we are in the middle of a bear market rally. While the GBTC Grayscale Bitcoin Trust value sitting already at chart comparable 11k.
From technical analysis we couldn’t have bottomed more.
Even on chain indicators signal the bottom is near. NUPL, RHODL Ratio, Puell Multipli, Entity adjusted Dormancy-Flow, MVRV-Z Score, 2Year MA Multiplier, CBBI-Bull Run Index. We have already seen arguably the most extreme network capitulation in Bitcoin‘s history, with now also a Hash Ribbons blue ball on the daily timeframe.
Bitcoin is trading at a fair value. I am still hoping for an expanding flat 3-3-5 elliot wave correction, a double three WXY pattern, or even a simple overshooting B of an ABC.
But if that 17,6k gets structural taken out we are not talking about recession but deflationary depression and just the start of a longer bear market.
Fortunately the global narrative is shifting. People are now saying we are going into a deep recession. CNBC‘s Cramer saying to avoid all speculative investments like crypto, while the worst is priced in already. It starts to look like the main worry is becoming recession with deflation and not inflation now. That idea gets strengthened by US-CPI showing a second month of decline. Based on the 5-year break-even inflation rate, a leading indicator, it can already be said with certainty that we have seen the short-term peak in inflation. And that inflation is expected to recover further through 2023. Keep in mind every time inflation tops - Stock market rallies! Once the consumer price index print comes in significantly lower (September~7,9% but October ~7%) the stage will be set for a Powell flip flop. FED pivots systematically lead to strong rallies. So November FOMC potentially for a midterm or year-end Christmas rally. This means that the Fed will step back on better CPI-data and inflation will eventually start running again in 2023.
Nobody does see a fruitful future for investments right now. To trick the retail there is no need for a positive narrative so everyone keeps being bearish. Only technical analysis matters.
Afterwards we will see what the news catalyst was.
Btc may range more than equities first, then rotation into more risk happens later.
Hence Bitcoin Dominance will rise and Altcoins will pump after Bitcoin. But Btc is not yet in a multi-year bear market within its 4 year cycle because BTC.D would be at that point much higher while we are seeing new 4 year lows. Something is different.
As a trader you have to adapt the possibilities. Invalidation of that bull scenario if we set a new low in Bitcoin. Then there will be much bigger problems in the market. So all eyes on the DXY and the behavior oft he FED, because Btc is at this time just the risk-taking follower of Nasdaq and SPX.
Special greetings to Blockchain Backer, following him for almost a year.

Clear skies ahead in the landscape.The time to build mountains in the landscape has come again. Looks like clear skies could be ahead for the next few months into the summer.
This is not meant to be financial advice. The work has already been done.
When climbing mountains... First look, then leap
Also marked is the finish line (top) and start line (bottom)
On the bottom is (Steve's NVT/HV Indicator). The way it works is simple, When the moving line red and or white line dips below the yellow line means that the volatility is low and will eventually come up and et more volatile. The color says which way the move will be, Red is upward price action and white is lowered price action.
Thank you
WeAreSat0shi

BTC final leg higher to $42k-44kBTC looks like it's ready for it's final leg higher to retest the structure it originally broke down from.
The final target should be somewhere between FWB:42K -44k.
I do not buy into the bull market narrative, this is a bear market bounce.
So just be cautious when people call for new highs as we approach those levels.
Alts can have 5-10x moves if this move plays out.
Let's see if it happens over the next 1-1.5 months.

Bitcoin Fibonacci Rising ChannelBitcoin's price movement is meticulously adhering to the contours of a Fibonacci Rising Channel, illuminating potential future resistance zones and critical levels.
Here's a detailed breakdown of the current outlook:
As of now, Bitcoin is poised for a significant move, targeting the key psychological level of $50,000. The Fibonacci Rising Channel provides a clear roadmap for this ascent, indicating potential resistance areas along the way.
Anticipated Move:
Upon reaching the $50,000 mark, a retracement is expected. A pullback to approximately $40,000 appears to be a plausible scenario, aligning with the dynamics of the Fibonacci Channel. This correction is an inherent part of the price cycle, offering potential entry points for strategic investors.
Elliott Waves Analysis:
Adding depth to our analysis, we incorporate Elliott Waves (EW) to discern the broader market structure. According to EW principles, the level of is a crucial invalidator, residing at $30,900. A breach of this level would challenge the current wave count and necessitate a reassessment of the broader Elliott Waves pattern.
Key Levels to Watch:
$50,000 Resistance: An area of significant psychological and historical importance. Observe price action closely as Bitcoin approaches this level.
$40,000 Support: Anticipate a retracement to this level post the $50,000 test. This could present an opportunity for traders seeking entry points.
Elliott Waves Rule:
Invalidator: Rigorously monitor the $30,900 level. A sustained move below this point would trigger a reevaluation of the Elliott Waves structure, potentially signaling a shift in the overall trend.
Bitcoin's trajectory within the Fibonacci Rising Channel, coupled with insights from Elliott Waves, provides a comprehensive framework for traders and investors. As we approach the pivotal $50,000 level, vigilant monitoring and a well-defined strategy are paramount.
Happy Trading!

Bitcoin - How to trade BOLLINGER BANDSHi Traders, Investors and Speculators📈📉
Ev here. Been trading crypto since 2017 and later got into stocks. I have 3 board exams on financial markets and studied economics from a top tier university for a year.
When it comes to Technical Indicators, speculators have many options to choose from. Do you prefer to keep it simple? If your answer is YES, the Bollinger Bands are for you.
First, a little about the genius behind it, John Bollinger. Bollinger Bands were created by John Bollinger in the 1980s. He is still very much alive and well, and very active on Twitter. He constantly engages the community through seminars and interviews. As you can see, I'm a huge fan of his work! This revolutionary technical indicator offers insights into price potential and possible volatility.
Let's get technical : The higher the price action trades at the top/ upper part of the BBands, the more volatility and volume you can expect. The same is also true for the opposite - the lower the price trades on the bottom of the BBands, the more volatility and volume you can expect. It is also true that when the price trades at the top for an extended period of time, the market can be considered overbought; thus it is a good time to consider selling. The same is true for the opposite. When the price trades on the bottom of the Bollinger Bands for an extended period of time, the market is considered oversold and it is a good time to consider opening a position / buying. Important to note that the Bollinger Bands are especially useful and reliable in higher timeframes. To make overbought conditions and oversold more clear, let's take a look at a few examples on SOLUSDT:
From the Solana chart above, we see clearly that when the price action touches an orange band, it is often time to exit / enter. You can wait as the price continues upwards, but the longer you wait, the more your risk increases. Careful not to be greedy, take profits during a bullish cycle.
To make volume in conjunction with BBands more clear, let's take a look here on ETHUSDT:
You'll notice that usually on higher timeframes, the turquoise upper / lower band, is where you start paying attention. This is where firsts profits can safely be taken, with the possibility of the price still wicking towards the orange or red.
To get a little more technical, let's take a look at accumulation options with the Bollinger Bands. When the BBands contract, it is usually before a big move up or down. Now you'll need to view the chart from a macro perspective/ Fibonacci trend based retracement and trend based extension on a weekly chart to get an idea in which direction it may go. This proves another point that often, technical indicators are only useful if used correctly with chart analysis. Let's take a look at a few examples on XRPUSDT :
These are not the Bollinger Bands as they were created y John Bollinger, instead, they have Fibonacci lines added. I prefer to use them this way, it's an improvement on top of the original BBAnds. They become especially useful if you use it with another indicator called Phoenix Ascending. Find below at related ideas a quick guide on Phoenix Ascending.
Have a great weekend 🚀
__________________________
👀Follow us here on TradingView for daily updates and trade ideas on crypto , stocks and commodities 📉
Hit like & Follow 🔔
We thank you for your support !
CryptoCheck

Crazy Week in Bitcoin and Cryptos📰 Double Whammy: Bittrex Shutdown and CZ's Legal Woes Unsettle Crypto Markets!
🚨 Bittrex Shutdown Impact:
Despite the looming closure of Bittrex Exchange on Dec. 4, BTCUSD on the platform soared to $46,000, creating a buzz in the crypto sphere. Explore the chart:
🔒 Binance's Legal Turmoil:
Adding to the turmoil, former Binance CEO Changpeng Zhao (CZ) faces legal constraints. As per federal prosecutors, CZ, having pleaded guilty, cannot leave the U.S. ahead of his February sentencing for violating the Bank Secrecy Act.
💔 Binance's Guilt and Heavy Penalties:
In a shocking turn, Binance pleaded guilty to multiple charges related to allowing users from sanctioned regions without proper compliance measures. The exchange agreed to a staggering $4.3 billion in penalties, marking one of the largest fines in the history of the U.S. Department of Justice.
🌐 Global Implications:
Prosecutors express concern about CZ's minimal ties to the U.S. due to his UAE citizenship, fearing he may not return if allowed to leave. They're not seeking pre-sentencing detention, only requesting that CZ remain in the U.S. His sentencing is slated for Feb. 23, 2024, with potential imprisonment and a fine.
📉📈 Market Response:
Current BTC support lies at 36300, extending to 33500. I am looking for a breakout above 40,000, anticipating a surge to 42,000 in the pre-Christmas period.
Stay tuned for updates

My Secret Bitcoin Map for 2024-2025: An Idea You Can't Miss 🚀📈Hey folks. Today, I'll unveil my secret trading roadmap for 2024-2025 🗓. This roadmap will be your trustworthy guide, helping you multiply your initial investments throughout this crypto cycle 🚀.
Many traders and investors understand that financial markets are cyclical, and the cryptocurrency market is no exception. This cyclicality implies that price patterns tend to repeat, allowing us to anticipate future price behaviors.
I know many analysts analyze and compare cryptocurrency cycles, but I haven't encountered such a comparison before 🧐. Before delving into the chart and predicting the future of Bitcoin and Altcoins, I want to note that I've been refining and testing this plan for the past 6 months ⏳. So far, the accuracy results are truly impressive ✨. More on that later.
Global Bitcoin Forecast for 2024-2025 🌐
Now, let's move on to analyzing the chart 📊 and predicting the future price of the cryptocurrency market. In the chart below, I've compared the current Bitcoin cycle, the 2015-2017 cycle, and the 2019-2021 cycle. Did you notice the similarities between each cycle? Yes, the price diverges at times, but there's over a 70% correlation, which is quite significant 👀.
It's worth noting that the bearish phase (downtrend phase) has ended. The accumulation phase is also nearing its conclusion. And soon, with high probability, the entire year of 2024 and the beginning of 2025 will see the cryptocurrency market in a bullish trend (growth phase).
Pay attention to the current situation. During this period, in relation to the cryptocurrency market cycles, Bitcoin has always been in the accumulation phase (sideways trend).
📅 September - November 2023
In both previous accumulation cycles, it lasted about 200 days, after which there was a breakout upward and growth 🚀. Currently, the price has been in a sideways trend for approximately 170 days. If we go by the past, there's 1 month left before growth begins 📈. By the way, this scenario aligns very well with the months. September has always been a consolidation period 🛑, and October a month of growth 🌱.
Currently, many people are expecting the price to fall, and it's no surprise, as this always happens after downturns. The market sentiment changes with the price movement. A week ago, I conducted a poll on my Twitter account and asked my audience: "In your opinion, which will Bitcoin reach first, $20k or $30k?" 61% of respondents believe the market will hit $20k first.
Usually, as a rule, the market moves against the majority's opinion. Indeed, at the $19k - $20k level, there's a lot of liquidity 💧, strong levels, and if the price drops to $19k, it would be a great opportunity 🌟 to start investing in the cryptocurrency market. However, it's more likely the price won't drop below $22k - FWB:23K 📉.
I'll give a 20% chance 🎲 that Bitcoin will indeed decline. If it does, prices below FWB:23K - $22k are very attractive for buying 💰 (in case of a drop, buy incrementally; this allows for a good average purchase price).
The question arises: " If there's growth, where to? " 🤔 It all depends on how the price behaves throughout September 2023. If, during September, the price approaches the $30k mark and begins to consolidate, there's a good chance to reach $40k - FWB:42K 🎯. If the price stays around the same levels throughout September, then the targets might be around $35k 🎯.
Additionally, I want to highlight a few patterns. In past cycles, the growth occurred in two waves and lasted about 1.5 months. I anticipate these patterns will repeat, and the cryptocurrency market will be in a growth phase until mid-November. Exact price prediction is impossible, so I set various targets. Everything is relative and will be adjusted in real-time.
📅 November - December 2023
If we look at past cycles, from the beginning of October until mid-November, we should expect growth 📈, followed by a reversal and a sharp decline 📉, likely in December 2023. Again, it's almost impossible to predict the exact fall targets; it could be $19k - $20k, FWB:25K , or the upper accumulation boundary, $30k. Everything will depend on the price growth in October - November 2023. In the 2015 - 2017 cycle, the drop was 40% 🔻, while in the 2019 - 2021 cycle, the price declined by 60% 🔻.
Bitcoin's drop in December 2023 will be a holiday gift 🎁; keep an eye on the price 👀 and don't miss the opportunity to buy cryptocurrency at a discount before the start of the bull trend 🚀.
📅 January - May 2024
From the beginning of 2024 until mid-spring, the cryptocurrency market will likely be in a slow upward trend 📈, just as it was in past cycles. In March - April 2024, the Bitcoin halving will take place 🌗, which will certainly awaken the market and lead to increased volatility (sharp price jumps ⚡).
Past cycles also suggest that during this period, we should anticipate a local price increase 🚀. Potential uplift levels: FWB:48K - $50k 💰. Also, note that in both the first and second scenarios, the price returned to the initial growth values.
📅 June - September 2024
According to our map, during this market period, we can forecast growth 📈 and an assault on Bitcoin's all-time highs: $69,000 💎. During this time, it's also worth anticipating a surge in news-related momentum 📰. Lately, most global investment funds have been applying for a Bitcoin ETF. Perhaps during this period, we should expect positive news related to this event 🎉.
📅 September 2024 - January 2025
After Bitcoin updates its ATH (all-time highs) 🌟, the price will start to skyrocket 🚀. During this period, you can begin to purchase altcoins, as a significant amount of liquidity will shift from Bitcoin to altcoins, marking the start of the much-anticipated altcoin season 🎉.
By the end of 2024, Bitcoin might reach the $100,000 mark 💰 (a key psychological level). This, in turn, will lead to uncontrollable market mania 😲. You will notice the media 📺 extensively discussing Bitcoin and the cryptocurrency market. A vast influx of newcomers 🏃, who have little to no experience in trading or investing, will rush into the market and invest their savings 💼. Big players ("whales") 🐋 during this time will be massively selling their cryptocurrency to retail investors. Be cautious ⚠️, the end is near.
📅 February - May 2025
The final months of the bull market 🐂. At this stage, you've noticed that the cycles have started to differ. However, the dynamics remain similar. A correction followed by the last growth wave 🌊. Systems, models, and indicators point to different targets for this cryptocurrency cycle. I lean towards the new all-time highs (ATH) for Bitcoin being in the range of $130k - $170k 💎.
Important
All the information provided above is presented strictly for informational purposes and is not a recommendation to buy or sell financial instruments or currencies.
I want to note that this map serves as a reference for me, but it is by no means my strategy or system. It helps me regulate my risk level. My primary system and strategy, which I rely upon and am willing to invest my own money in, is a complex of my own Buy/Sell indicators, guided by their signals. 👇
Research independently and manage risk accordingly. In the world of cryptocurrencies, nothing is impossible.
❗See related ideas below❗
Follow + Like this post and leave a nice comment, it will allow me to move faster and make more useful content! 💚💚💚

Bitcoin Intraday prices outlook 2/8/22i believe profit taking and fear will cause us tohave another dramatic drop here, for liquidity , as we continue to trend up longer term
loking for these prices as targts for shorts.
looking for a pullback to 42k

Bitcoin Rising, CEOs Falling: Legal Challenges | Crypto AutumnJust like Arthur Hayes of BitMEX in Autumn 2020, Changpeng Zhao (CZ) of Binance is facing similar legal challenges in Autumn 2023.
Both incidents coincide with Bitcoin's Autumn price rising, from $10,000 in case of BitMEX and from $35,000 in case of Binance.
Legal experts predict CZ's potential prison time to be around a year or less, drawing parallels to Hayes, who received six months of house arrest in 2022 despite government efforts for a longer sentence.

Bitcoin & Cryptocurrency results of 2022 and plans for 2023-2025Today we will try to summarize the results of 2022 and look a little into the future.
What can we say, We think few people will deny that 2022 is one of the worst years that we have seen and consciously felt. Painful both separately for the participants of the crypto world and in general in the context of the economic, military and geopolitical situation in the world.
In 2022, the value of most cryptocurrencies fell steadily, almost with no corrective rebounds upwards. At most - prices were stuck for several weeks in the sideways correction and then fell again.
But usually, after a black streak comes a white one, so let's turn the 2022 page and look into 2023-2024-2025
Here is the BTCUSDT price chart on the monthly time frame
Although the history of Bitcoin trading is not so long compared to other financial assets or indices, but a certain cyclically can be traced over a 12-year period.
The behavior of BTC price movement can be divided before and after "halving".
"According to the algorithm, the reward for the mined BTC block is halved +/- every 4 years, and the event itself is called "halving".
On 28.11.2012, the first BTC halving took place. Back then, crypto was something completely unknown for 99% of people, then on a regular desktop computer, you could mine a BTC block and get a reward of 50BTC.
From 28.11.2012 to 09.07.2016 - the reward per block was 25 BTC
From 09.07.2016 to 11.05.2020 - the reward per block was 12.5 BTC
Now the reward is 6.25 bitcoins, and from April 2024 (the projected date of future halving) it will be halved to 3.125 BTC.
As the complexity of mining increases every day, the rewards will decrease until there are no bitcoins left to mine. Only 21 million bitcoins can be mined (and of these, 3-4 million are considered irretrievably lost). Calculations indicate that the last block should be mined in 2140."
To summarize: after each halving, the supply of new BTC that can be sold on the market is greatly reduced, which according to the law of "supply and demand" only stimulates the price growth."
If the BTC price is growing, which is already regarded by many as an "index of cryptocurrency stability", then altcoins are growing much more strongly in parallel.
For example, we recently made an interesting idea for LTCUSDT.
Litecoin is mining and has a halving on the same block as BTC, but the halving comes a little earlier.
We describe it in more detail here
If you are interested in when to sell your LTC, read and analyze.
If we analyze the behavior of the BTCUSD price, we can confidently state the regularity and cyclicality:
+ BTC price minimum January 2015 + 17 months = "halving" July 2016 + 18 months of the rapid growth of the crypto market until December 2018.
+ BTC price minimum December 2018 + 17 months = "halving" May 2020 + 18 months of the rapid growth of the crypto market until November 2021.
Now we prospect this pattern for 2023 - 2025
+ If the minimum BTC price was recorded in November 2022 + 17 months = projected "halving" April 2024 + 18 months of the rapid growth of the crypto market until October 2025.
This assumption, at least, has the right to life, and we remain to be closely monitored for it.
Our expectations for 2023:
- January 2023 - continued consolidation and bottom formation in the range of $16000-19000
- February 2023 - a shot up to $28000
- March - October 2023 - prolonged consolidation under the level of $28000
- autumn 2023 - breakthrough and consolidation of the BTCUSDT price above $28000
In 2024, a stable growth trend according to the fractal is expected.
Autumn 2025 is the maximum price for possible future growth trend.
Altcoins in 2023 may be less patient and start "shooting" up in the spring-summer of 2023, while the BTC price is in consolidation. By organizing a mini alt-season in 2023, the "big players" will be able to show that the market has come to life. They can hint and lure "new and fresh" money into the crypto world for a joint and powerful growth of the crypto market in 2024. This is a very necessary thing after a bunch of negative events in 2022.
These assumptions also complement our analysis, which we wrote about the possible capitalization of the cryptocurrency market in 2023-2025
_____________________
Did you like our analysis? Leave a comment, like, and follow to get more

Bullish Outlook with Potential TargetsUpon scrutinizing the 4-hour timeframe, Bitcoin's chart reveals a compelling bullish scenario. The support line, characterized by a noticeable upward slope, is forming significant higher lows, indicating a strengthening upward trend.
Notably, a flat resistance level at 37,900 is proving to be a formidable barrier, temporarily halting further upward movement. This has given rise to the formation of an Ascending Triangle pattern, a bullish continuation signal.
The interplay between ascending support and a flat resistance level suggests potential upward momentum once the resistance at 37,900 is breached. This is promising setup for strategic entries, eyeing targets at 39,000, 41,000, and 43,000 for potential bullish moves.
Learn more about triangles -

Simple Trick Bitcoin- One simple old trick to know when we are bullish or bearish.
- Use Ichimoku Kinko Hyo 1W-TF.
- Only use senkun span (SSA).
- Wait for BTC trend cross the Span.
- Jump in/Jump out.
- Always follow the river while trading.
- Don't waste your energy trying to counter Naturals movements.
Happy Tr4Ding !

Bitcoin Will Never Die
- i am posting this new chart like i did in 2018. ( i will link olders charts at the end of this post ).
- it's always more easy to predict a long term chart ( 1 Week TF ) Than a shorter timeframe ( 1 Day TF ), just because cryptos are hyper volatiles markets.
- Everything is in chart and very simple to read, this is imo the worthless scenario we could see.
- Most of my followers know my trading style, i always try to predict bottoms and tops.
- i never advise peoples to short BTC, because my philosophy is to predict "Hope", and bitcoin is here to fight hyper inflation.
- TheKing helped peoples which believed in to get more wealth, trying to make this world more fair.
- if you bought BTC in 2011, 2013, or the top of 2017. you are still winner. Peoples who bought the Top of 2021 will be winners in the long run.
- Bitcoin's PoW algorithm have been created to grow, 21M BTC only and strengthening difficulty every halving.
Patience is the road for wisdom. Bitcoin is the road for freedom.
Happy Tr4Ding !

Bitcoin's ABCD: 2020 Twin Move - X2 Ahead!Hey crypto enthusiasts! Today, let's unravel an intriguing aspect – how Bitcoin seems to be tracing its own financial history, akin to a monetary déjà vu.
We're shedding light on the patterns from 2020 and how they're mirroring the charts in November 2023.
📈 Identifying Patterns: ABCD and Rising Channels
Ever engaged in detective work with Bitcoin charts? Well, it turns out there's a recurring theme – the ABCD patterns and those rising channels.
What's even more fascinating? They're not merely repeating; they're unfolding in the same sequence and maintaining a comparable distance. It's almost like Bitcoin has a rhythmic financial cadence!
🔍 Are We on to Something?
So, here's the question: Could these patterns be providing us with insights into what lies ahead?
According to this investigative work, there's speculation about Bitcoin setting its sights on that $50,000 milestone real soon – perhaps before we welcome the new year.
💭 We Want Your Take
Now, we're not financial gurus, but you might be!
What's your perspective on this Bitcoin journey? Are we in for a predictable ride, or is this an entirely new financial voyage?
Share your thoughts in the comments – we're all ears!
🌐 Riding the Crypto Wave Together
As we ride the crypto wave, these déjà vu moments give us something profound to ponder.
Stick around for more updates and dive into the conversation.
The Bitcoin story is unfolding, and your insights might just be the missing piece to this financial puzzle. 💬🚀

Bitcoin's Price BalletSince its inception, Bitcoin has displayed a consistent price action pattern across cycles.
During bear markets, prices adhere to a singular trendline. When breaching it, Bitcoin enters a parabolic trajectory. Historical trends underscore this pattern: from 2012-2014, then 2015-2017. The 2019-2021 cycle deviated slightly due to the "COVID-puncture," altering the bull market shape. Ignoring this anomaly, Bitcoin's price aligns with its age-old parabolic curve.
While doomsayers predict a potential Black Swan event, with prophecies of a dip to 10K-16K, history informs us. The 2014 bear market ended with a double-dip bottom, akin to the 2018 scenario. Hence, the notion of a second dip lingers, urging caution. It's unwise to go all-in at any market point. HODL your Bitcoin, maintaining some cash reserves offers a prudent approach.
Additionally, observing the RSI on the weekly chart reveals a recurring pattern. The RSI typically ascends to the 70 level as the market exits its bottoming phase. This repetitive behavior underscores Bitcoin's cyclical nature, offering strategic cues for seasoned investors.

We'll See What Happens Next! [Short-Term Forecast]In this video we discuss the Bitcoin forecast as we finish out the rest of the year (Crypto Spring). We are keeping an eye on the triangular area between the Maximum Halving High Pressure Zone and the Future Halving Price Line and the potential that bitcoin could meet significant downwards pressure in this area. Also, we're looking at the 365 Day Moving Average, as it continues to trend below the Future Halving Curve (The Jet Stream). Historically, If we finish out Crypto Spring with the 365 Day MA below the Jet Stream, the Bitcoin price would trade mostly below the Jet Stream up until the halving date. What are your thoughts? Thanks for watching!

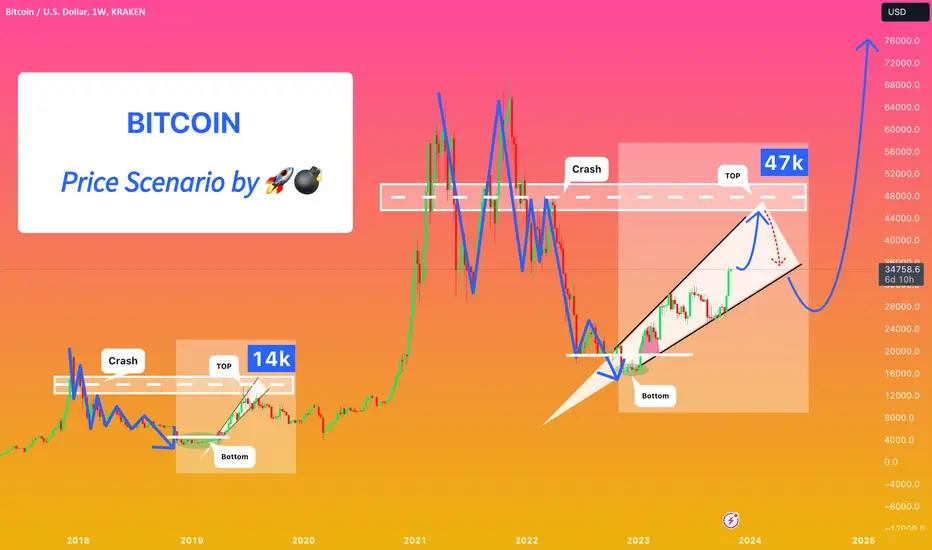
RB Calling for TOP! Comparing Bitcoin's 2019 Rebound with 2023.Hello my dear readers!
Many of us find themselves drawing parallels between past and present, searching for clues about what the future holds for Bitcoin. In this analysis, I will explore the comparison between Bitcoin's market bottom and rebound in 2019 and its current resurgence in 2023.
Can we project a price target of up to $47,000 based on this analysis? Let's dive in.
Resemblance to 2019:
Upon closer examination, it becomes evident that 2023's Bitcoin market rebound shares remarkable similarities with the 2019 scenario. The patterns, trends, and key indicators align in a way that raises intrigue among traders and analysts.
Inverted Wedge Formation:
One compelling aspect is the formation of an inverted wedge pattern. This pattern, which commenced right at the market bottom, is strikingly reminiscent of the conditions observed in 2019. The inverted wedge is a promising sign for traders, as historically, it has often preceded significant upward movements in Bitcoin's price.
Crash Patterns:
Another interesting facet of this comparison is the resemblance in crash patterns. The crash pattern observed in the current cycle shares characteristics with the previous one, yet it appears more condensed and narrow. This contrast becomes especially evident when compared to the flatter pattern that prevailed in 2018-2019.
Projection for Bitcoin's Price:
Based on this analysis, there is a potential projection of Bitcoin's price targeting up to $47,000. This projection aligns with the trends and patterns observed in both 2019 and the current market, offering an exciting prospect to monitor in the coming months.
As we observe the ever-evolving dynamics of the market, this comparison between the events of 2019 and 2023 serves as a captivating reminder of the intriguing possibilities and patterns that have the potential to shape Bitcoin's journey.
While I cannot predict the future with absolute certainty, my mission here is to empower you with my detailed market analysis and insights.
💛 If you've journeyed this far with me, why not show your support by hitting the ' boost 🚀' button and following my page? And if you're already a subscriber, feel free to share your thoughts in the comment section below.
Do you spot a correlation between these two periods, or do you anticipate a different trajectory?
Always Yours Kateryna 💙💛
😱 BITCOIN PRICE PREDICTION 2020/2021 😱 NEW PHASE ‼‼‼Here is the update on history of Bitcoin. NEW +1 Phase spotted. I find 7+1 Phases of the bitcoin from the top of 2013.
1. Descending Triangle Phase
Price in form of triangle, in 2013 this pattern last for about 398 days.
In the 2018, we can see similar triangle shape and price last here for about same period in 341 days. Next phase
2. Ascending Triangle Phase
After breakdown of the phase 1, market in 2014 moved down and in start of 2015 formed Ascending triangle shape within 186 days. Now look at 2018/2019 zone of Ascending triangle , similar shape, similar period of 155 days. Next price moved upside to next phase.
3. Flat Zone Phase
After moving upside price stuck in Flat zone for the 149 days in end 2015 and beginning of 2016. In middle of 2019 price stucked in similar Flat zone for about 162 days. Then we moving to next phase
4. Inverse Triangle Rise Phase
In this zone we see about 105 days of rise in between middle of 2016. Here is highly debatable, but looks similar in end of 2019, you can see similar rise within 107 days. What happened next is phase of sudden crash.
5. Sudden Crash Phase
So you see the 4th phase with 107 days rise, then within just few days price suddenly crashes in end of summer 2016. Same Sudden Crash happened in fears of COVID-19 in March 2020, right after Inverse Triangle Phase (4). Now move to phase 6.
6. Lack of Certainty Top
In the end of 2016 we see the small volatility movement below resistance line and before this Top zone, we see steady rise for 153 days, before the market breakout from resistance line. In the 2020 we see steady rise after Sudden Crash (5) for about 156 days. Now price approaching resistance line without big volatility . Here is the prediction starts, in 2017 after breakout we faced 7th phase.
NEW. 7. ATH Volatility Spike
In the beginning of 2017 you can see green rectangle - at that time price approached 2013 ATH ($1150) and looks like there price start to jump really fast. Price made a pullback from ATH and then tried to break it, showing false breakout and then only at third attempt it broke the ATH level and Parabic started
8. Parabolic Rush Phase
So after the breaking out from resistance line in early 2017, Bitcoin price started to grow, and after crossing previous highs market flooded with new traders and fresh money, which caused insane growth of the price for abut 357 days. Will this phase repeats after we cross 20k again? This is topic for discuss :)
👉 What price do you think we will face during end of 2020 and in 2021?
Stay tuned, have a good profits
Appreciate your likes and subscriptions
This is Artem Crypto
