Don't Panic Yet! Bitcoin's Double Top May Not Be a DeathHey, fellow traders of @TradingView community! It's @Vestinda with the latest update on the exciting world of trading.
Bitcoin's price chart is showing a Double Top pattern, which is often seen as a signal of a potential decline, with predictions that the price may drop to $25,600. However, it's important to remember that the cryptocurrency market is volatile, and there are many reasons to remain optimistic about the future of Bitcoin.
The bearish double top pattern appeared on Bitcoin chart — What you need to know
The double top pattern is a technical chart pattern in trading that occurs when the price of an asset reaches a peak, declines, rises to the same level as the previous peak, and then declines once more.
Traders can use this pattern to anticipate a potential price decrease, as it indicates that sellers may be gaining strength.
To confirm the pattern, traders wait for the price to break below the support level before entering a short trade with a stop loss set above the resistance level.
Although the pattern is not always reliable, traders can manage risk by using proper risk management techniques, such as stop losses and position sizing.
In other news, the ZeroSync Association is making waves with its tooling that will use zero-knowledge proofs (ZK-proofs) to validate the state of the Bitcoin network. This new tool promises to revolutionize the process of verifying the blockchain, making it more efficient and user-friendly.
ZK-proofs have already proven successful in the Ethereum ecosystem, and now, ZeroSync is pioneering their application for Bitcoin, which could lead to exciting new opportunities for the cryptocurrency.
Keep an eye on these developments, and remember to always trade with caution and proper risk management techniques. Happy trading!
Please feel free to share your thoughts and suggestions on how we can improve our content to better meet your needs. We appreciate your feedback and look forward to hearing from you 💜.
Bitcoinforecast

Is the Bitcoin Party Over Yet? Grab Your Profits Before ..."Is the Bitcoin Party Over Yet? Grab Your Profits Before They Vanish!"
Greetings traders and investors! I hope life's treating you well. Today, we're on a mission to uncover when this epic bull run might end so you can secure your hard-earned gains and shield them from a potential crash.
In earlier discussions, I've referred to a 9-month trading channel. Bitcoin recently shattered this channel, sending its price on a steep upward trajectory. This comes as no surprise, given that 9 months of accumulation have now culminated in this explosive rally.
Despite chatter about the Fed hiking interest rates, an impending global economic crisis, and other concerns, Bitcoin seems to be unfazed and continues to defy all expectations.
Regarding whether this is the end, my estimation is that the current trend is about 70-75% done. We might see a local dip in the price, but next month should be bullish for the crypto market. The odds are 99% that the entire trend will wrap up between $32k and $36k. And, like most cases, it'll probably conclude with an ascending wedge pattern, which has a 70%+ likelihood of causing a price decline.
Should a correction occur, keep an eye on potential buying opportunities around $25,300 and $24,000. In the meantime, don't forget to monitor altcoins! At the peak, liquidity will shift into altcoins, creating a golden opportunity for them to shine.
So, fellow crypto enthusiasts, buckle up and get ready for a thrilling ride! With the Bitcoin party nearing its end, it's time to strategize and maximize your profits. Keep a close watch on those crucial price levels and, importantly, don't overlook the potential of altcoins. As the peak approaches and liquidity pours into these alternative cryptocurrencies, you could be poised to seize an exceptional opportunity.
Remember, the crypto world is a rollercoaster, and staying informed is essential for success. Keep your finger on the pulse and be prepared to act when the time is right. By doing so, you'll be well-positioned to capitalize on the remaining growth and protect your profits from a possible downturn.
Happy trading and investing, and may the odds be ever in your favor!

#BTC Inside Rising ChannelBitcoin In Hourly timeframe is moving inside the rising channel (Bearish Pattern)
If we look in the past a lot of volume where between $29K - $31K that can react like strong resistance at this point!
Im expecting price to break channel down after touching Resistance and retest the support zone

Bitcoin breaking a major resistance zone + exchange balanceChartWe are at a point where balances on exchanges are being drained like no other cycle, Bitcoin breaking another major trend line of resistance.

Bitcoin is in a bull marketAccording to our free indicator, Fetch Trends, Bitcoin is in a bull market.
The weekly candle turned green for the first time in 60 weeks.
The last time this happened was in may 2019, kicking off the bull market of 2019-2021.
Before that one, Bitcoin turned green in Octobre 2015, which was at the start of the bull market of 2015- end of 2017. The first green candle was also found after 60 weeks.
Ofcourse this isn't the only reason why I believe Bitcoin is in a bull market. I've given my other reasons in previous posts.

Breaking the Bears: Bitcoin Bullish MomentumHello @TradingView community. Welcome in @Vestinda Bitcoin price analysis.
Reports about bank collapses, stablecoins, and interest rate increases appear to be powerful enough to increase the price of bitcoin. Well, Bitcoin almost hovers above $28,000 amid banking instability.
On the other side, we discover chart patterns that suggest a market recovery from the bear trend as Bitcoin surged in the beginning of March 2023 by approximately +80%.
1. Price on long term scale remains in Rising Channel
2. Strong breakout of Downtrend Resistance
3. EMA Ribbon bullish breakout
Which means price is likely to continue growth inside Rising Channel, and according to identical move characteristics from 2019, we might land on this move in the upper 40s or low 50s. For sure it is our High-hopes, and in general, the price movement may differ both in time and appearance.
What is Rising Channel in trading?
A rising channel is a technical analysis tool used by traders to identify an uptrend in the market. It is formed when the price of a security moves between two parallel trendlines, with the upper trendline representing resistance and the lower trendline representing support. The rising channel can be used to identify potential entry and exit points for trades, as well as to determine whether a security is in an uptrend or downtrend. Traders can also use it to set stop-loss orders and take profits when trading, a rising channel helps traders determine where the current price is in reference to the median of the market.
Learn about Bulls and Bears on the markets:
Hey, what do you like to read next on TradingView?
Your feedback will help us create more relevant and useful content!
Thank you so much.

BtcUsd is going to fly nowBtcUsd is stable now and is on trendline and showing bullish sentiments in the market, lets enter with proper money management. price is on trendline, positive news about btc now. Btc buyers interest is now at peak

Choose your Freedom- Just for Sharing
- Not a Trade setup.
- Need more confirmations to accept this trend.
-- Bitcoin is more than the speculative numbers that most of peoples see in it.
-- "For the people.By the people".
-- Choose your Freedom and your path.
Non nobis solum, sed omnibus.
Happy Tr4Ding!

BTC Long term Vision basically i wan to see 25K break out to reach 34k-37K Weekly Liquidity Pool where lot of buyers sits, i expect hard drop from this range.

Bitcoin Idea | bullish to $28700!I think it doesn't need to be explained!!
Bitcoin price in continuation of the weekly upward trend, the price hits the monthly resistance zone.
BINANCE:BTCUSDT INDEX:BTCUSD
✅ ✅ Risk warning, disclaimer: the above is a personal market judgment and analysis based on published information and historical chart data on The trading view,
And only some of these analyzes are my actual real trades.
I hope Traders consider I am Not responsible for your trades and investment decision.

Bitcoin - Indicators have Cooled DownBitcoin Quick Analysis
There was a panic in the market yesterday related to the USDC. Yes, very big banks went bankrupt, it's understandable. But looking at the chart, all the noise that was connected with USDC looks like another manipulation. Do not forget that the markets are ruled by the emotions of fear and greed.
Indicators have cooled down, which is good, RSI is out of oversold area, usually it is a strong reversal signal, I am not surprised that it will be a turning point for the price and in some time Bitcoin will continue its movement to the levels of $28 - $32k.
Perhaps today there will be new buy signals from my trading indicators.
All my 6 years of trading experience, knowledge, developments, and indicators I share them here in ideas for free. In return I will ask you just follow me, like this post and leave a nice comment, it will allow me to move faster and make more useful content! 💚💚💚

✅ Are you ready for this massive last Bitcoin Run ⁉️ In my last post, I said that the RSI has entered the oversold zone and this is a very strong reversal signal. Additionally, the FUD around USDC did its job, the big players got liquidity and the price just instantly flew up.
✅ At $22k, one of our indicators showed a signal to enter a Long trade and now we are holding 2 trades, one based on the Greenwich strategy and another on the Pump Tracker strategy. There is a high probability that another signal using the Whale Detector strategy will appear at the close of the weekly candlestick.
🐳 If we look at the chart, we can see that the price has reached a strong resistance level of $25,211. Now, there may be a slight pullback, but it is highly likely that the price will gain strength in a few days, break through this level, and continue to move towards the marked targets.
However, I think this is not the beginning of the bull market, and after $28-32k, Bitcoin may return to the fundamental value zone ($14 - $17k) once again. Perhaps the price will return to these levels in a few months. After that, there will be another period of accumulation and the beginning of a long bullish trend.
In conclusion, we have already made very good profits during this entire uptrend, starting with $16k. And we know where the fundamental value zone is. Keep this plan in mind. We are ready for these scenarios. Then, with each new day, we will earn more and more money, until the middle of 2025.
This is just the beginning 🚀
All my 6 years of trading experience, knowledge, developments, and indicators I share them here in ideas for free. In return I will ask you just follow me, like this post and leave a nice comment, it will allow me to move faster and make more useful content! 💚💚💚

#Bitcoin Reversal SignBitcoin has given a reversal sign. We see an inverse head and shoulders. $35 000 is the potential target.

$BTC - BULL MARKET from JUNE 2023 - PARABOLIC MOVE$BTC - Final Dip buying opportunity in March 2023 at $19K
Aggressive BULL MARKET starts from JUNE 2023
New ATH in 2024!

Thread: Has BTC Bottomed?Hey All,
Welcome to another year of crypto. 2022 was full of bears and shocking developments in the space! 2023 has promise to be much better in terms of price growth.
It's been nearly a year since I last posted on TradingView and for good reason. My last 4 analysis' were warning of the bearish year to come and it turned out to be just that. (please refer to the related ideas below for an overview of them).
Some signs have started to print that the crypto markets have been severely reset and may be soon experiencing a trend change. There has been little to no revival for most of the markets since highs were set over a year ago.
While looking at the above chart, two white trends can be seen which create a channel like structure. Each time price has hit either trend, a strong reaction has occurred and often a significant bottom or top formed. Right now, BTC is laying on the bottom trend.
The area has other confluence as well. There is a major support zone here. BTC has just bounced off its 2000 day bottom trend line for the sixth time.
Any break below the bottom trend and into the major support zone can be catastrophic. $12,000 would likely be the next support area . $10,000 is a level that cannot break. If it does, crypto will be sent on a wild ride with nearly all important technical points void. This is a very unlikely scenario.
Below I have added a few technical points to highlight a well rounded view.
Thanks for reading
Please like and comment!

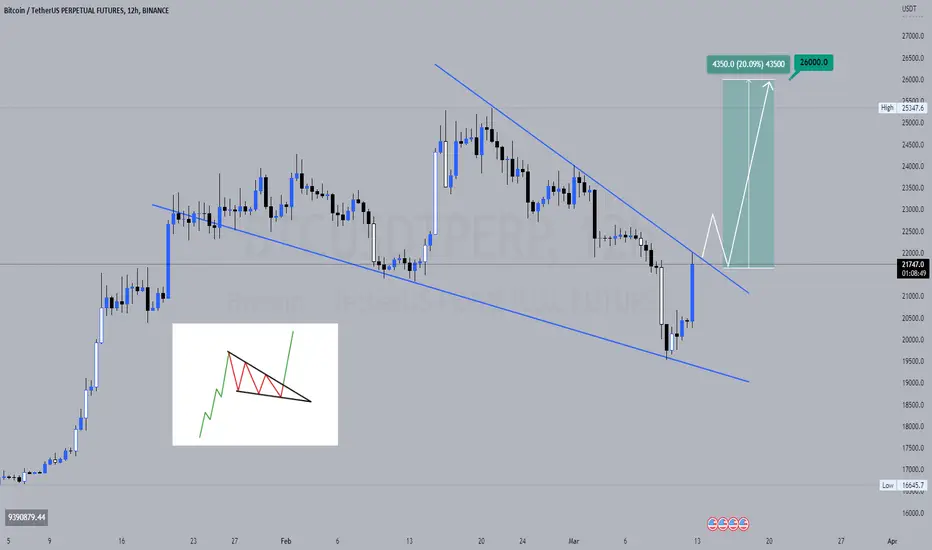
#BTC 12H Bullish PatternBitcoin in Higher Timeframe, formed a Fallin Wedge
WHAT IS A FALLING WEDGE PATTERN?
The falling wedge pattern is a continuation pattern formed when price bounces between two downward sloping, converging trendlines. It is considered a bullish chart formation but can indicate both reversal and continuation patterns – depending on where it appears in the trend.
Waiting for confirmation on Breakout above $22K Before looking to make a long position!
Patience is the Key!
BTC CME Gap- Fast update.
- Wait for CME play the GAP before entering any position.
- Stay Safe
Happy Tr4Ding!

Bitcoin ($BTC) Corrective structure in short term? We'll see...Hi everyone!
If we look at our analysis on the daily chart (see chart below), the price action has reached a very important resistance area (trendline). Having said that, returning to our intraday chart, we see that the bullish structure may have completed, or almost completed, its development. Some reversal pattern should appear from one of these areas, let's wait.
DAILY ANALYSIS
(click and Play chart below)
If this idea will be supported by your "Likes" we will continue to follow the crypto with updates below.
thanks for your attention and please... trade with care! 💖

Is the bottom actually in? #BITCOIN 🧐I believe we will get our answer very soon on #BTC 25k area is make it or break it. Few Thoughts
- There's Bearish FVG that will need to be filled eventually which is above 25k.
- Reject off of 25. 19-20k is guaranteed, because of 2 bullish FVG that need to be filled .....
- #Bitcoin tends to repeat itself when it comes to price action. The last time we rejected of off that strong high we got knocked down all the way back to 15k.
- If we reject again off of the strong high, we could see price action test that low at 15k.
200 MA is key which aligns with the 25k area ‼ If we convingly lose it the bottom is in.
- With that being said..we lost it before & it was a fakeout & continued to go lower. Which could happen again.
This area 25 is gonna tell us everything.
There has been a couple of times throughout #Bitcoin history where PA was trading above the 200MA for some time.
Ended up being a fakeout & the bottom wasn't in.
So Food for thought, this could very well be one of those times, again.

Pray that 7k-8k holds the line.This is my thesis.
The current "crypto industry" resembles more the mechanics of a Ponzi scheme than anything else, even some of the most leading figures of the "industry" have spoken out about this publicly (Google "Sam Bankman-Fried reveals how DeFi works like Ponzi scheme").
Most participants in this whole thing are only interested in "number go up" this ethos has led the whole industry to be blinded from the original ethos of Bitcoin (See genesis Block). Whoever Nakamoto was, he obviously created Bitcoin because he knew that the current monetary system is flawed, furthermore he knew that it is corrupted by a small set of entities that control the money supply according to their whims, and it would be impossible to be fixed as it is, so a new one, permissionless was needed to be created.
Look how ironic, and comically it all has become, if you now open any crypto news media you'll see news about bailouts and crypto companies imploding by doing the same practices that bankers were doing back in '08, the same things that Bitcoin was standing against since its inception. The modern version of "Chancellor on brink of second bailout" is "FTX on the brink of a second bailout"
Participants of this whole sham called altcoins have corrupted and created a cloud of confusion of what this whole industry should have been about, and i get it, most people get into crypto because they're looking to make a quick buck, even the long term holders or should i say HODLers, are seeking the same thing (sell high) they seem to have forgotten or misunderstood the original mission that Bitcoin was setting out to achieve which is "A purely peer-to-peer version of electronic cash would allow online payments to be sent directly from one party to another without going through a financial institution" irrespective of its price, the whole point was to use a mechanism to avoid being at the mercy of anybody at anytime.
When was the last time you transferred any amount of Bitcoin to another one without using any central entities in the middle?
We are due for a long and tiring market of sideways that will purge and hopefully eliminate all the excess of cryptocurrencies, that were created during the last years of get rich quick intoxication, insert your preferred alt here. Everyone who participated was responsible for and most who are unaware think that the worst is over with a Bitcoin price at 20k, they haven't looked at Bitcoin domination stat and see that it clearly shows everyone is still in a state of denial, even smart folks are wishing for another round of FED goes brrrrr just so that it helps their bags, regardless of what it will do long term to the health of their country. (Weimar 2.0)
Be realistic and honest with yourself, What will Solana cellphone do, that another high-end Android cellphone won't be able to do?
Yet Solana is still pumping against Bitcoin on such a horrid announcement.
This is why Bitcoin may go below 10k once again, the reckoning is coming and soon most participants will understand that their beloved shitcoins are just that, shit.
Red wiggly line on chart is the best case scenario imho, below 6k is worse, and we will experience our first crypto price reset ever.
Good luck and be safe.

ArShevelev /// Bitcoin's Decline is InevitableThe fact is that a lot of people just don't care about Bitcoin anymore. If you do a Google search for "Bitcoin," it will lead to 623 million results. But if you do a similar search for "bitcoin price," there are only 157 million results, and the vast majority of them are not important news articles or price analysis.
And the reason why Bitcoin prices remain stuck in sideways channels or breakdowns is because most people don't care about it anymore. Price action is boring.
They're waiting to see how much they can make by buying low and selling high, and they're not so concerned about the reality that such a purchase demands endurance and perseverance.
Most people are used to trading in 2022 on futures in a continuous downtrend, but now the time has come for a trend shift, and we see the movements altering each other up and down, causing the market to go sideways.
If there is a long-term buyer on bitcoin, I am confident that it will purchase quietly and change the public attention away from purchasing but towards selling. Remember that.
Things might change if the price goes below the 20600 level, which I believe is critical for momentum. Yet, if 20600 is broken, we will almost certainly witness a double bottom attempt.
Kind regards
Artem Crypto

Bitcoin Analysis [January 28, 2022]BITCOIN analysis update (Daily Chart)
(Falling Wedge)
Focusing on current price action, we have a Falling Wedge.
We will be expecting price to break resistance line to the upside, do a retest on the resistance line or at a previously bullish injection zone, then continue its upward movement to hit take profit targets 1 to target 4 where we will be expecting good reactions respectively.
This analysis is invalidated if price drops and closes below support line.
Note that its upward movement to hits respective targets won't be a straight push. Equally have in mind that the targets represent zones and not just a particular price.
Kindly note this is not a signal. This article is for educational purpose and not a financial advice. As we know, the cryptoverse is a highly volatile ecosystem. Do your due diligence.

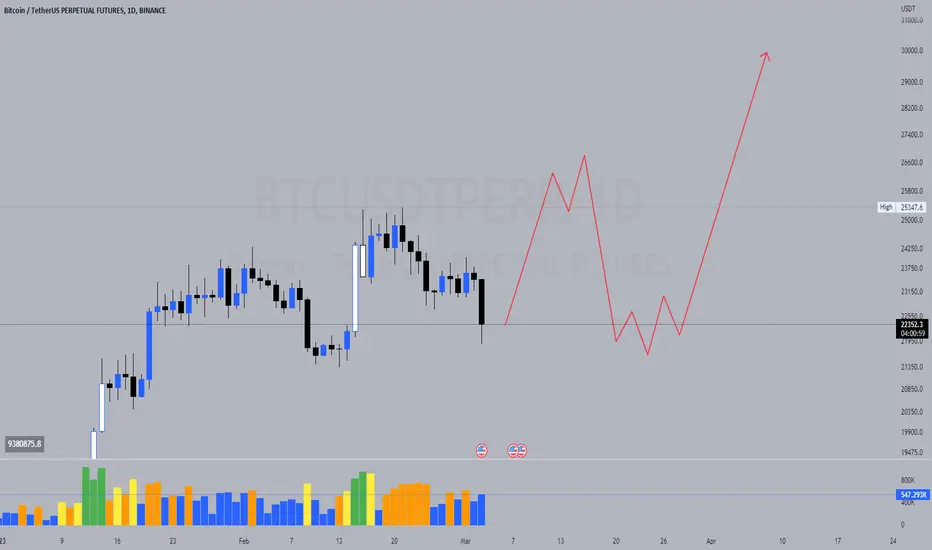
#BTC Bullish ScenarioIn Daily Timeframe, this is a bullish scenario for Bitcoin
In case BTC hold above $22,000 this move i expect price to move UP toward $30,000