Bitcoin could shock us- everything is in graphic as always.
- I have always been conservative about the next top.
- As trader i believe in trends.
- i always said : " more it takes time to go up, more higher we will go"
- be ready for the unexpected.
Happy Tr4Ding and Stay S4fe !
Bitcoinfuture

Bitcoin - Reversal is imminent - CME Future Gaps#BTC/USDT #Analysis
Description
---------------------------------------------------------------
+ It's unusual to see consecutive unfilled CME futures gaps, but recent market volatility has created just that scenario. Historically, CME gaps tend to be filled sooner or later, and current market conditions suggest that prices may be heading directly towards these gaps.
+ The appearance of two consecutive unfilled gaps is a rare occurrence. Given the strong historical tendency for these gaps to be filled, it’s likely that the market will attempt to revisit these levels.
+ The recent bounce from support has been robust, indicating strong upward momentum. This move bolsters confidence that the gaps will be filled in the coming weeks, especially as traders and investors often target these areas.
+ With the current price action showing strength after the bounce, it seems increasingly probable that the price is headed towards the gaps. If this momentum continues, we could see these gaps filled relatively soon.
---------------------------------------------------------------
VectorAlgo Trade Details
------------------------------
Entry Price: 57000
Stop Loss: 50000
------------------------------
Target 1: 59900
Target 2: 61000
Target 3: 65000
Target 4: 70000
------------------------------
Timeframe: 1D
Capital Risk: 1-2% of trading amount
Leverage: 5-10x
---------------------------------------------------------------
Enhance, Trade, Grow
---------------------------------------------------------------
Feel free to share your thoughts and insights.
Don't forget to like and follow us for more trading ideas and discussions.
Best Regards,
VectorAlgo

BTC looks again good for next Bull RunBTC looks good again for best buy with small stoploss and bigger target for this year.
This is just for my own education purpose.
Not a buy or sell recommendation.

Bitcoin Idea | BTCUSDTBitcoin Idea | BTCUSDT | BTCUSD
✅ ✅ Risk warning, disclaimer: the above is a personal market judgment and analysis based on published information and historical chart data on The trading view,
And only some of these analyzes are my actual real trades.
I hope Traders consider I am Not responsible for your trades and investment decision.

BTC💰 - Historical log chart🚀Will history repeat... Can bulls reclaim that MA200 next and push to get that MA50 back above the MA100 (Golden cross) on HTF..
Keep in mind this could take months to complete as the chart is HTF -Weekly
Even if we had to visit the major 0.886 around $11k now or early next year after a relief rally..
BTC could easily reach $240 - 300k by 2024/2025.. Looking at historical data and the growing adoption etc
Looking at the current user/ wallet growth per year.. We are steadily heading towards a "breakout" in the % of the population that actually use cryptocurrency..
Look at other tech for example.. Internet, cell phones.. etc..
Just think about Facebook 10 years ago almost nobody over 35 -40 years old even knew how to use it and just look today.. Geez, even grandma and grandpa are using it and interacting on posts +sharing etc..
It's coming.. And we are here sooo early and have a massive advantage above +95% of the earth's population..
PATIENCE is needed!!
Even if we go for 1 more dump... Zoom out and look at the big picture and ask yourself what you are doing in this space..
As Warren Buffet has said.. "If you aren't willing to own a stock for 10 years, don't even think about owning it for 10 minutes"
That is why I have started laddering into my spot positions since June this year, if we go for 1 more towards the downside thb I don't mind will DCA and enter new lev positions as I will get stopped out in profits let's GO..
By 2025 I want to be a Billionaire, not a basement day trader.. My mind is focused on the big picture and I am unaffected by FUD..
Most try and time the exact bottom/top and end up fomoing into the market when real traders TP then fear sell... And repeat..
Trading isn't easy if you are not mentally prepared to stick to a logical strategy and plan.. And personally, I believe in a HTF strategy of starting accumulation when the HTF Indicators are into the oversold region and we start testing HTF demand zones..
Not saying I bought the bottom but I can guarantee you that when I sell my spot 24/25 with huge returns I definitely won't be looking back..
Imo the crypto space is currently entering an era that will see more and more adoption, new cellphones will be using blockchain tech and you'll start seeing "super wallets" that you can tap and pay using crypto.. In a few years, it will become the norm and everyone and their gran will be using it..
The first 5-10% of global adoption is always a painful and slow process but then BOOOOM out of nowhere it just takes off and that's when we really get paid.. I truly believe we are still early.
From 2025 you can imagine if BTC let's say tops out around $240 -320.. A standard 0.618 retrace would mean $150 -200k pullback lol
The digital era is here and we will forever move deeper into it as time progresses..
And with governments and corruption around fiat + constant "printing themselves out of trouble" the general public is losing confidence in the current monetary system and the people controlling it.. This will eventually be the major catalyst for change imo

Bitcoin - This actually does happen check it outHappening right now: Looking at the one-day timeframe you can see that we have stayed consistently above the 50MA if you see at least 3 candles above the 50MA that shows strength, however, this move is highly suspicious since there is so much divergence in so many indicators. We have a tremendous spike in volume while the candles are generally small. In cases like this, the best move is to not make a move. This decision is easy to make because the odds of going down are greater than the odds of going up. Why are the odds of going up lower? Because the consumer is in debt, savings are depleted and a retail trader with lots of disposable income is much needed in order for the powers that be to make their billions. When money is dry the only way you can lure consumers back is by dropping the price, so the only way BTC is going back up is by coming down in price. So what can we expect? In the next few months, we'll see small moves up, long sideway ranges, and one last drop.
We have to talk about this: Check this out, this massive wick that reached to the center of the earth is called a flash crash, they start and end in less than a minute. When these flash crashes take place all other coins will flash crash as well. Does this happen often? Yes, but not that severe. How to capitalize on this? We'll talk about this at length in a future post but this is part of the severe market manipulation by exchanges. They use it to hunt stop-losses once they accumulate and you can use it to set up buy orders and make thousands in less than a minute.
VERY IMPORTANT: Hitting the "Like" button is like a tip, please don't forget to do so after reading, this is your way of thanking me for my time and so I thank you for yours.

Bitcoin Fractal Idea - $260K 03/2026Bitcoin Fractal from the November 2018 drop thru May 2021 ATH. Fits well with Crypto adoption expectations and current market conditions and predictions.
Let me know what you think. DYOR. Not financial advise.

FUTURE OF BITCOIN , Everyone should see this CHART !This is so interesting chart , i ve never seen this chart before. We should pay attention to this, share it because everyone needs to look at this chart.

DUMP?usdt dominance breaked major resistance , next target is 8.7-13% , seems like huge crypto crash is coming

Bitcoin Forecast: The Future Of Bitcoin - ( Crypto: BTC )Bitcoin Forecast: The Future Of Bitcoin ( Long Term )

Bitcoin important weekly analysisBitcoin weekly
EMA21 on weekly.This moving average is very important support level. Curently is around 40-42k which is normal strong support level.
So, if bicoin goes up, then can't go below this level (weekly candle close with body)
This chart looks bullish.
Bitcoin Dominance
Still in strong beartrend. It means alts should go extremle up.
Total market cap
Going up according our scenario. This chart look also bullish.
Bullish fundament
Two stable coins in top 10, these money are ready for buy.
It is important to wait for break. In case of bearish reaction is possible test level around 16k.


Bitcoin Looks like it will close the daily closing under the support zone. If it will close under support area, I think it will come to 45k. If it isn't get a support from there, welcome to 30k.

10 Year History of BITCOIN, Stayed Above 10,000 level.In 10 year history, This is the longest time Bitcoin has spent above the coveted $10,000 level.
With other major milestones like $1, $10, $100, $1,000 BITCOIN never retraced below it, When it stayed up 62+ days or more


The Bullish Volcom Pattern of Bitcoin and Cryptocurrency.If you stalk the charts- BTC has a large amount of ***significant*** Bullish Volcome patterns that are sweet.

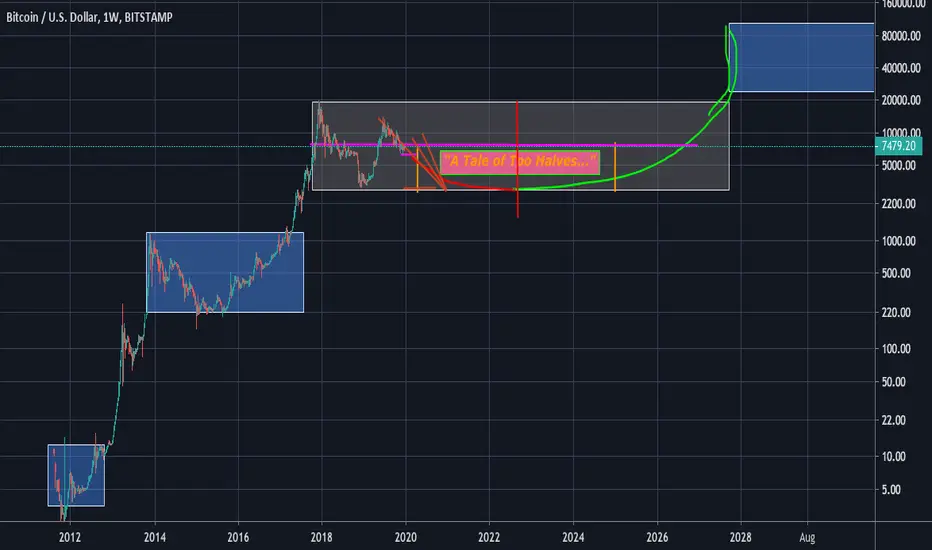
What if BTC stayed SUB-8K for NEXT 5 YEARS?! Ultra Bear Scenar.What if we didn't see these prices again for five years? Do you think you'd stay in Bitcoin for that long? Why? Why not?
I seem to recall seeing a chart somewhat similar to what I've done here many moons ago, but I don't recall where or how.
But it paints quite an "interesting" picture to put it mildly...
Bitcoin seems to Love patterns - sometimes called "fractals..." This isn't something I'm going to go into too deep here, but, it is my belief that the trajectory outlined above is one which any reasonable mind could deduce and conclude, based on simple reason and observation (and a little creativity :)
Basically what we're seeing in this chart is my inferences based on the previous patterns and moods of BTC: showing we might be entering a serious if not the "final" stretch before we travel up to that final plateau of 100k.
But it appears the journey there may be panning out quite a bit different than I I had anticipated... Though, if I'm honest, almost the very moment I drew this chart, and saw what it seemed to be telling me, you wanna know what I felt? I felt Relief... Why? Because it just seem to make so much sense...
As unpopular or "unexciting" as a 4 year Bear Market may be, it surely isn't something any hodler of said asset would probably want to hear.... BUT, I truly truly believe that if this thing is to be around for the real long haul, this could turn out to be a very, very plausible scenario.
I like to call it "the battle of the halvenings" (denoted by the Vertical Orange bars...) And this "dead zone" looks like it will basically persist between the next Halvening event and the following one happening in around the winter 2024, possibly not even reaching our Present Levels of 7.8k USD for another year after that ! It is true these "calculations" are certainly rough; but, they are close enough to get the idea, surely.
How could this be good, you say? Well, it will be a REAL period of "relatively" stable currency, for one - evening out at around the 5K median or so... Also, this would give plenty of time for True, not only adoption, but actually Building the technologies to be adopted. After all we're Just now really seeing the space truly start to spread its wings... During this time a Stable currency with a period of "head down, eyes forward," in the scheme of things, five years is Nothing....
I'd love to hear others' thoughts on this...
Tl;dr: Bear Market next four years between the Halvenings... Won't see 8 again for years... Old ATHs not returned to (i.e. 20K USD BTC) until Summer 2027ish, and then soon after, 100K by that Fall.... Am I off? Wayyy off? Little off? Iknow I'm "off," but, you know what I'm mean, ya'll... ;))
Thanks for reading!!
Donations:
BTC: 17NMvqjzNqjLrANAU6YPdfUa1kmnzKDwhp
ETH: 0x58535641d4977684e5FbE82249b2eB6505a16953
Bitcoin rally rejected again at $13500, whats is next ?Once again Bitcoin rejected at $13500 on the major resistance at the golden ration of fibonacci retracement 0.618 which is one of the major resistance for bitcoin and this is second time it is rejected from this level. For the next #bitcoin rally , bitcoin need to break above $13500.
You may see that in the chart published by us on 3 July 2019.
RSI in daily chart showing under control but still on the weekly chart is is above 70 which is a major concern again, this is also consider one of the good indicator and need to be in control in coming days.
If you may notice it is again trying to respect 21 MV and trying to bounce back from here, from last one year it respected 21 MV and most of the time bounced back from this level, Now you need to notice, it should respect this green line, if it closes below 21 MV then again it will be a point of concern and bitcoin again may again test bitcoin support at $9400.
Resistance - $11500 $13500
Support - $9400 $7100

Bitcoin Still SHORT possible trendchange to LONG 1 HR Chart#Bitcoin # Ethereum # Litecoin
Hello to all watching my charts
Today we do see Bitcoin still in the short structure Channel
in my longterm tradingchannel ( BLUE COLORED CHANNEL) which is going down.
BUT BItcoin is improving the price action ( PURPLE COLORED CHANNEL) cause we have taken out
the resistance at
11387
and we have now higher highs and higher lows.
I suggest:
We are still in the short situation, and have to wait a little bit for
confirming the improvement.
I think, if Bitcoin reaches my BLUE ARROW Target in Time and price
we just should able to start a long position.
But if it falls again further down in the blue channel below the last low
(my RED ARROW Target) SHORT will be still the position to go.
Good trades
If you want to support my work and my charts, please like them...
Renkotrade

XYO up 63% on 5 dayXyo is looking good making a leap up over 50% today (6/6/19) resting on top of a prior support breaking through the resistance that knocked it back down from breaking through back on March 19. XYO is a cryptocurrency mined via the Coin App. It is given as a reward for sharing your geo-location information with the system. Its really cool and easy to get, Its worth some research. But don't take my advice discern all things on your own, with your own free will. have a great day! Peace

Bitcoin - Short term price action predictedPlease make sure to have a look at my longer term view of Bitcoin prices to come in the future.
For here and now we have a simple opportunity to continue to follow the recent price action and further wave of positive price movement predicted to establish.
For now my opinion is to open a long position with a profit target to close of $5850 (just below the psychologically important $6000 price level.
Stop loss can be extremely close as if the move crumbles we want to get out quickly with minimal damage.
High certainty trade signal from me. But please remember this is not direct investment advice, always be sure to contact a financial professional/seek professional help before entering into any market risk/trade opportunity.
As always best of luck and subscribe to stay on top of what will be fairly regular multi-asset signals and charts from me.
Much love - MysticCrypto
