There is a possibility for the beginning of an uptrend in BTGETHTechnical analysis:
. BITCOINGOLD/ETHEREUM is in a range bound and the beginning of uptrend is expected.
. The price is below the 21-Day WEMA which acts as a dynamic resistance.
. The RSI is at 48.
. While the price downtrend in the Daily chart is not broken, bearish wave in price would continue .
Trading suggestion:
. There is a possibility of temporary retracement to suggested support zone (0.05810 to 0.05160). if so, traders can set orders based on Price Action and expect to reach short-term targets.
Beginning of entry zone (0.05810)
Ending of entry zone (0.05160)
Entry signal:
Signal to enter the market occurs when the price comes to "Buy zone" then forms one of the reversal patterns, whether "Bullish Engulfing" , "Hammer" or "Valley" in other words,
NO entry signal when the price comes to the zone BUT after any of the reversal patterns is formed in the zone.
To learn more about "Entry signal" and the special version of our "Price Action" strategy FOLLOW our lessons:
Take Profits:
TP1= @ 0.0675
TP2= @ 0.0730
TP3= @ 0.0902
TP4= @ 0.1012
TP5= @ 0.1201
TP6= @ 0.1498
TP7= @ 0.1760
TP8= @ 0.2404
TP9= Free
Bitcoingold

Nice chance for breakout (25/08) #BTG #BitcoinGold CryptoStation#BTG (BTG/BTC)
Buy : 3000-3050
Sell : 3100-3200-3300
Sell : 3400-3500
Stop : 2900
Follow me for more signals

#BTG Volume Analysis Prediction 8/24/2018Hi, friends.
BTG is in the main balance with the range 17.68-21.70. Intraday balance (range 14.80-17.68) after fixing goes up, that means we have a bull priority in intraday charts at the moment. The support level 17.68 is very important. If the main balance goes down and the price will break down this level, bull priority will change to bearish again. As long as the price is in the balance we trade inside from the its borders.
The chart shows the label notes, how to operate at key points.
Glossary of terms
Point of Control (P O C) – The price level for the time period with the highest traded volume .
Value Area (V A) – The range of price levels in which a specified percentage of all volume was traded during the time period. Typically, this percentage is set to 70% however it is up to the trader’s discretion.
Balance - Accumulation Area.
F L - flat level.
T L - trend level.
Fixing (fix, culmination) - reverse price reaction then the markets stops i'ts movement for a short time. The trend stops when it passes through 1-3 fixing movement.

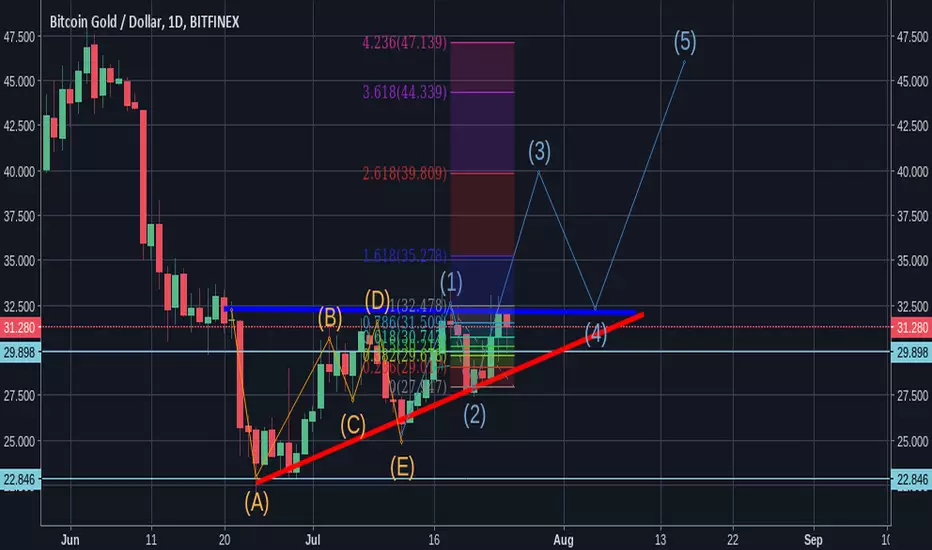
Ascending triangle with posibility of breakoutI got mixed signals about this it's an ascending triangle in bearish trend.
It has made a complex ABCDE correction and false breakdown which indicates bullish sentiment.
If you want to be sure about this trade you can trade it on breakout.
So you can put a stop buy order above the triangle line and take profit at the fib extension 1 and 2.
The market turn down if btc goes down. Be in mind that these also is a bearish flag and can breakdown to the downside.
Stop buy order 33.5
Take profit 36 and 39
Long term 46 usd.
BitcoinGold Uptrend Begins?On the 24th of June, BitcoinGold has found the bottom at $22, where it rejected 927.2% Fibonacci retracement level cleanly. After bouncing off the $22 support price went up and broke above the 200 Moving Average.
The past month price action shows that BTG/USD is printing higher highs and higher lows, while continues to reject the uptrend trendline and Fibonacci retracement support levels. First it has rejected 61.8% Fibs at $25, then 38.2% Fibs at $27.
Such price behavior might suggest the beginning of an uptrend that could result in a 100% growth in a relatively short time span. Strong resistance is seen at $60 area, that is confirmed by two Fibonacci retracement levels, 227.2% and 527.2%.
At the same time consolidation period might be extended and BTG could drop towards $25 area prior to moving higher. But only break and close below $22 support could invalidate bullish outlook.

BTG another buying oppturnityHaving a down 2 days for some reason but it is giving us some more buying opportunities. I am interested in this one because I think there is a big upside very close vs BTC. Will look for a buy in here if I see it turning.
Look at it vs BTC it has lots of upside if it starts to go.

There is a trading opportunity to buy in BTGUSD Technical analysis:
. BITCOINGOLD/DOLLAR is in a downtrend but the beginning of uptrend is expected.
. The price is below the 21-Day WEMA which acts as a dynamic resistance.
. The RSI is at 44.
. The RSI downtrend & The price downtrend in the daily chart are broken, so the probability of resumption of uptrend is increased.
Trading suggestion:
. We have already opened 10 BUY trade(s) @ 26.145 based on 'a reversal candle (Valley)' entry method at 2018.06.30 in our suggested support zone (27.00 to 22.00).
Beginning of entry zone (27.00)
Ending of entry zone (22.00)
Entry signal:
Signal to enter the market occurs when the price comes to "Buy zone" then forms one of the reversal patterns, whether "Bullish Engulfing" , "Hammer" or "Valley" in other words,
NO entry signal when the price comes to the zone BUT after any of reversal patterns is formed in the zone.
To learn more about "Entry signal" and the special version of our "Price Action" strategy FOLLOW our lessons:
Take Profits:
TP1= @ 39.00
TP2= @ 47.00
TP3= @ 68.00
TP4= @ 84.00
TP5= @ 146.00
TP6= @ 196.00
TP7= @ 250.00
TP8= @ 380.00
TP9= @ 478.00
TP10= Free

Might be time to play BTG (Again) July 2018I think it might be time to revisit BTG. It looks to be trying to break up. This is a short term play and when (if) it's confirmed buy more with margin. As with every other thing around you have to keep an eye on what BTC is doing.
This is the thing I am playing today no leverage, dont wanna get stuck in a bad trade if BTC goes to shit. Will look to buy more with leverage if it breaks out and confirms on top of the breakout line.
Each Fib line could be a target to go for. Up to the 0.5 - 0.78 level before a good pullback.
Looks okay vs BTC too.

BTG trading opportunity! BTG caught my attention, in bitfinex funding page where I saw it being lent out at 0.1% a day. So I thought let me see the charts, wow did I get shocked, it was a complete massacre!
At one point with 1k usd you would get 2BTG, but right now... This is screaming BUY ME, 41coins for 1k usd at these prices is beautiful! looks like it has or extremely close to touch bottom, ending diagonal waiting to break the declining trend. we could be moving sideways for days, months, or even a year! but right now Im not thinking scalping, Im thinking of just accumulating this coin.


#Bitcoin in reverse can it hold above low of 23rd June Y/N ?Closing price of 26th June ended below the open of 25th causing me to review my long position.
It was reason for me to review because on 24th there was a divergence between MACD histogram and the opening and closing price. The close of the 25th was a bullish signal in my opinion (marked with yellow arrow) because it closed outside the open and close of the 24th (the day of divergence). The market has now closed down in reverse outside the open and close of the 24th again marked with yellow arrow (the day of divergence) . If market closed back up above open of 26th that would be reason to review short position.
The high of 19th and low of 23rd are important in my study and created like so - take two fractal distances and multiply by two, and do same for the next, and I then use those two bars to form a band of support and resistance (this study is stil a work in progress). That's why I've got in my heading "Can bitcoin hold above the low of 23rd June?"
So I'm now cautiously bearish. If price breaches low of 23rd I'd be even more bearish. An interesting bullish factor could be if the market would close above the basis of the Bollinger line in yelow (I've taken out the high and low bands). Bollinger is set at 20, close, 3.
NOT ADVICE. ALL STANDARD DISCLAIMERS APPLY. DO YOUR OWN RESEARCH.


Triangle formation in cryptocurrenciesCryptocurrencies are giving a false impression of moving in a random manner but are in fact forming a triangle pattern!
The triangle could break on either side but I think it is more likely to break to the upside as the triangle seems to be the B wave of an ABC pattern. The C wave would be equal in length to the A wave or 1.62 times the length of the A wave. Keep an eye on the breakout and a retest of the tip of the triangle.
Enjoy a long ride to the upside :)

Bitcoin: Next stop 12500Bitcoin has been correcting in an ABC pattern since December last year. Five waves of the A wave were completed at around 6400. The B wave started at this level.
The B wave itself is made up of smaller a, b and c waves. I correctly predicted the start and the target of the latest correction wave (see some charts copied below). Now, I think that there are two possibilities:
Bitcoin could have already completed smaller a and b waves and could now be getting ready to move into the smaller c wave (see a chart below). The big B wave will complete after the completion of smaller c wave.
It could have only completed wave (i) of the smaller a wave and the rest of the structure of waves a, b and c is yet to unfold (see the main chart above).
Interestingly, Bitcoin will move up to around 12500 in both situations! Other altcoins are also expected to follow a similar pattern.
Cheers
ND

BITCOIN GOLD : the Great profit is HERE!!!BTG/USD divergence between indicator and real price-trend, often leads to growth
Long-term deal (2-2.5 months)
Enter
now - 40$
TARGETS
64$ (~55% profit from now)
80$ (~95%)
106$ (~155%)
148$ (~260%)

BTG Tries to Go UpperHere is my trading idea, but at 0.008400 and await for the price goes up, until 0.010600, once reached its your move to sell or keep it.

BTG/USD showed oversold signsPrice has made a false breakdown below the 150% Fibonacci line (ascending dotted line). It has failed to reach and retest the 38.050 static support and now it could increase if it stays above the 150% Fibonacci line. It is remature to talk about a larger upside movement right neow because the Crypto section is still under pressure.
The next upside target remains at the red downtrend line. A potential bullish movement will be invalidated by the breakdown below the 38.050 static support.

Bitcoin Gold 4hr Chart - BTGBTCJust a technical chart on bitcoin gold via Binance. Watching for a bounce down here as a last resort. Hopefully we will see some green bars soon with no drops below .005564 BTC.
BTGBTC
bitcoingold.org
coinmarketcap.com
$41.60 USD (-5.62%)
0.00573320 BTC (-4.85%)
Market Cap
$708,578,477 USD
97,652 BTC
Volume (24h)
$11,757,400 USD
1,620 BTC
Circulating Supply
17,032,686 BTG
Total Supply
17,132,686 BTG
Max Supply
21,000,000 BTG

BTG is ready to Starting Its Bullish Rally BTG is one of the most traded coins, which comes in TOP30 coins,
After market crash in the month of March, the price was drops from 0.026857 Satoshi to 0.0057,
Again market was Start recovering, Bull rally was Started & the price was unable to break 0.0097 resistance,
Drops again to 0.0059 & Forming a DoubleBottom Reversal Pattern,
Which is a Bullish pattern.
Price is almost at the botom.
If we talk about RSI Indicator, the RSI is almost in Over Sold zone..
Fundamentally, BTG is going implementing in Month of June..
So the price will increase...
Now the Price of BTG is really really Cheap....
*****If You Like My Ideas,then hit the like button & Follow me for Latest Updates..******
Disclaimer: I am not a financial advisor. Please do your own due diligence when it comes to investing. Never put in money that you cannot afford to lose.
***This information is not a recommendation to buy or sell. It is to be used for educational purposes only.***
" Be Happy, Be Disciplined & Keep Smiling "

BGold - You Bought This Dumpster Instead of Bitcoin Cash?Back in the beginning when BGold was launched, in order to divide and conquer market share, attention, and interest from Bitcoin Cash versus Segwit/Segwit2x, you were told by the machine to BE MAD AT ROGER VER and STAY AWAY from that FILTHY BCASH.
Bitcoin Gold, on the other hand, well. Lead BTC Blockstream bro Adam Back personally pumped this festering cluster of mold on Twitter for his circlejerk to circle with, extolling it as a heroic fork of Bitcoin to GPU miners because ASICS AND BITMAIN BAD ROGER VER BAD BCASH BAD.
mobile.twitter.com
And well, the market performed the pump and dump as expected.
Now. Shitcoin Gold's blockchain has been rendered worthless, yet some of you idiots are still trading your BTC for it.
www.ccn.com
Hint: Don't actually buy in the "buyzone"
If you traded BGold instead of Bitcoin Cash during the prior bull run, or this period's bounce, you have only yourself to blame for buying into bullshit and not doing your own research.
Think of it as a semester's tuition poorly spent.
==
Stop the Organ Harvesting Persecution of Falun Gong Practitioners by the Chinese Communist Party
dafoh.org

BTGBTC - Bitcoin Gold Weekly Chart with Fibonacci RetracementWatching BTGBTC on Binance for a bounce near the .01 btc level. This idea is purely technical & seems like a bottom is forming up near the all time lows. Plus if it was worthless coin why would Binance even list the coin... They do extensive research and keep the investors in mind before listing random coins. So with that said be-careful if you see any drops below .005564 BTC as that is the weekly low for the past 3 months.
If BTG gets going expect to see it hit the .236 fib level @ .039179 btc.
bitcoingold.org
coinmarketcap.com
Bitcoin Gold
$53.52 USD (-4.51%)
0.00637857 BTC (-2.94%)
Market Cap
$910,805,619 USD
108,555 BTC
Volume (24h)
$12,900,900 USD
1,538 BTC
Circulating Supply
17,018,774 BTG
Total Supply
17,118,774 BTG
Max Supply
21,000,000 BTG

A long-term Trading Opportunity To Buy in BitcoinGold ...Technical analysis:
. BITCOINGOLD/DOLLAR is in a Range Bound and Beginning of uptrend is expected.
. The price is below the 21-Day WEMA which acts as a dynamic resistance.
. The RSI is at 37.
Trading suggestion:
Price is in the support zone (55 to 38), traders can set orders based on Daily-Trading-Opportunities and expect to reach short-term targets.
. Beginning of entry zone (55)
. Ending of entry zone (38)
Entry signal:
Signal to enter the market occurs when the price comes to "Buy zone" then forms one of the reversal patterns, whether "Bullish Engulfing" , "Hammer" or "Valley" , in other words,
NO entry signal when the price comes to the zone BUT after any of reversal patterns is formed in the zone.
To learn more about "Entry signal" and the special version of our "Price Action" strategy FOLLOW our lessons:
Take Profits:
TP1= @ 84
TP2= @ 118
TP3= @ 142
TP4= @ 170
TP5= @ 200
TP6= @ 335
TP7= @ 420
TP8= @ 476
TP9= Free
