Bitcoin Rally Overextended: Patience is Key for the Next Move💹 BTC/USDC – Bullish Outlook, heres my Trade Plan.
Bitcoin (BTC/USDC) is currently maintaining a strong bullish trajectory 🚀, showing impressive momentum after breaking through recent resistance levels 🔓.
However, price is now overextended from the last swing low, and I’m anticipating a pullback into value 🔄 — specifically targeting the 50%–61.8% Fibonacci retracement zone drawn from the latest swing low to swing high 📐. This zone often acts as a rebalancing point for institutional traders and provides confluence for smart entries 🎯.
I’ll be closely watching this retracement area for signs of support forming, and more importantly, a bullish break in market structure 🧠📊. Only after that confirmation, would I consider executing a long position — no structure break, no trade ✅.
This isn’t about predicting — it’s about reacting with discipline.
Bitcoinidea

BITCOIN ROAD TO 300K !!! ELLIOTT WAVE CASE STUDYThere are three possible cases for Bitcoin which we can now consider according to Elliot wave count on big picture:
Case I: According to this count if we hold above 74.5k , recent low, we may see major shift in BTC. Retracement Up to 92-79k is good which will form inverse head & shoulders, potentially breaking ATH up to 170K, if things goes well & 74.5K region remains on hold.
Case II: If in case 74.5K region breaks, then it will invalidate minor count causing BTC to retrace more up to 64-52K major reversal zone region. If such thing happens, bullish shark pattern will be formed causing major reversal from that region BUT 49K region should remained hold!!!
Case III: Worst case scenario if 49K region breaks, then it will cause major count invalidation dropping BTC further up to 45-33K region.

₿ BTC: Upside Potential Remains IntactBTC posted modest gains over the weekend, but more upside is expected in our primary scenario. We continue to track a corrective advance in green wave B, with the potential to extend into the upper blue Target Zone between $117,553 and $130,891. From that top, wave C should initiate a downward move into the lower blue zone between $62,395 and $51,323—completing orange wave a. Subsequently, we anticipate a bounce in wave b, followed by another decline in wave c, which should conclude the larger correction of blue wave (ii). There is still a 30% chance that blue wave alt.(i) could make a new high, extending beyond the Target Zone and delaying the broader corrective sequence.
📈 Over 190 precise analyses, clear entry points, and defined Target Zones - that's what we do.

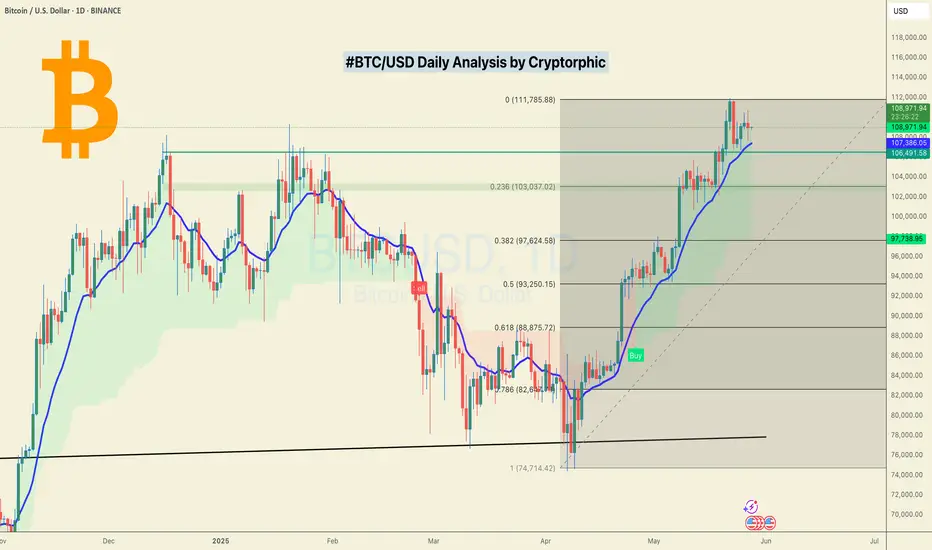
Bitcoin: Weekly Bullish Continuation🟠 The weekly divergence between the March 2024 and January 2025 peaks has driven the recent 3-month decline.
🔴 BTC is expected to make a weekly move higher, creating another divergence in the way.
🔵 BTC held above the 2024 peak range 73K without overlap, while the Stock RSI has completed a full reset, reinforcing the bullish momentum.
🟢 Outlook: Over the next 6 months, Bitcoin CRYPTO:BTCUSD is expected to rally into new ATH, with a potential target around 127K by October 2025.

#BTC/USD Close Fight but bulls win! $117K Still in sight!CRYPTOCAP:BTC Weekly Update:
BTC closed the week up by just 0.08%, leaving behind a long wick and a tiny body, forming a Dragonfly Doji, one of the strongest candlestick patterns, signalling a fierce battle between bulls and bears.
✅ This time, the bulls won by a small margin, but a win is a win.
✅ BTC successfully held its key support.
✅ The CC is green, which is a positive sign.
The price action remains choppy, but the trend is still pushing upward from here.
Invalidation:- Weekly Close below $100k
What do you think?
Do let me know in the comments section. And please hit the like button.
Thank you
#PEACE

Bitcoin to 120k or 150k next?The last setup on BITSTAMP:BTCUSD played out exactly as predicted. ()
As of today, June 8, 2025, Bitcoin is trading around $105,000 - $106,000 USD.
And it's been retesting the zone for quite a long time and it's time it broke out! It's less likely to reverse now (Still a possibility tho).
Predictions for Bitcoin's future price is wide, as many analysts are quite bullish:
Year-End 2025: Some experts are eyeing $150,000 USD and more by the end of 2025, citing factors like global liquidity expansion and continued institutional interest.
Do you think it's a possibility?

Time to go to the moon againRecent price action as retraced into the weekly level which is now the key level that Bitcoin can bounce off. once the week closes above, the next objective is price will rally and hunt the all time high. Grab your popcorn and lets watch the next move

BITCOIN REVERSAL INCOMING !!!! BUT WHEN????Currently we have seen a great move from 75k to new ATH 112k BUT now whole bullish momentum seems to be fading.
If we see charts, we clearly see ranges and recently Bitcoin has swept range high & reclaimed back into range, which indicates lose momentum. We may see BTC tapping 90K even 80'sK for next bullish move.
For all to maintain it's bullish momentum, Bitcoin have to stay above 74.5k and needs to break and hold above 109.5K.
Breaking below 74.5k would push BTC as low as 60-55k
STAY CAUTIOUS !!!!

RSI suggesting a bear market comingThis is BTC and it's RSI. Bellow you can see LMACD applied on the RSI indicator to see the trend more clearly. We might be on the stage that we can see higher prices like in 2021, but the bear trend is already printed. Sell some now and buy back at 40k next year. Cheers

Bitcoin Prediction - WARNING - Short Set-up Looming? We are spectating something serious on Bitcoin looming right now! Confirmations explained in the video!

BTC: Slowing DownBitcoin managed to stabilize over the weekend after its recent slide, nudging slightly higher from local lows. We continue to expect the current rebound—interpreted as wave B—to stretch into the blue Target Zone between $117,553 and $130,891. Once that move tops out, the next leg lower should follow, with wave C driving the price into the lower blue zone between $62,395 and $51,323. That would likely complete wave a in orange and pave the way for a temporary recovery before wave b rolls over into the final drop of wave (ii). The alternative scenario, which we’re still assigning a 30% probability, assumes Bitcoin is already in wave alt.(i) in blue—a more bullish path that would extend the rally well beyond $130,891 without another major correction first.
📈 Over 190 precise analyses, clear entry points, and defined Target Zones - that's what we do.

Bitcoin Is Entering Into Very Difficult TimesHello, Skyrexians!
I have been thinking what will happen next with BINANCE:BTCUSDT and it was obvious that correction has been started, you can easily find my recent update on Bitcoin and check it, but what will happen after. Today I decided that the first impulse has not been finessed yet and we need one more small leg up to complete this growth before significant correction.
Let's take a look at the yellow Elliott waves cycle. Awesome Oscillator gave me an idea that only wave 3 has been finished above $110k. Now price is printing wave 4. Wave 4 has a target between 0.38 and 0.5 Fibonacci, but this time it will be definitely 0.38 at $101k. Here was the smaller degree wave's 4 bottom. Wave 5 will be shortened because wave 3 was extended, it's very logically. After $111k retest the major wave 2 will go to $90k approximately. Difficult times ahead for crypto, I think this period will be finished only at the end of June.
Best regards,
Ivan Skyrexio
___________________________________________________________
Please, boost this article and subscribe our page if you like analysis!

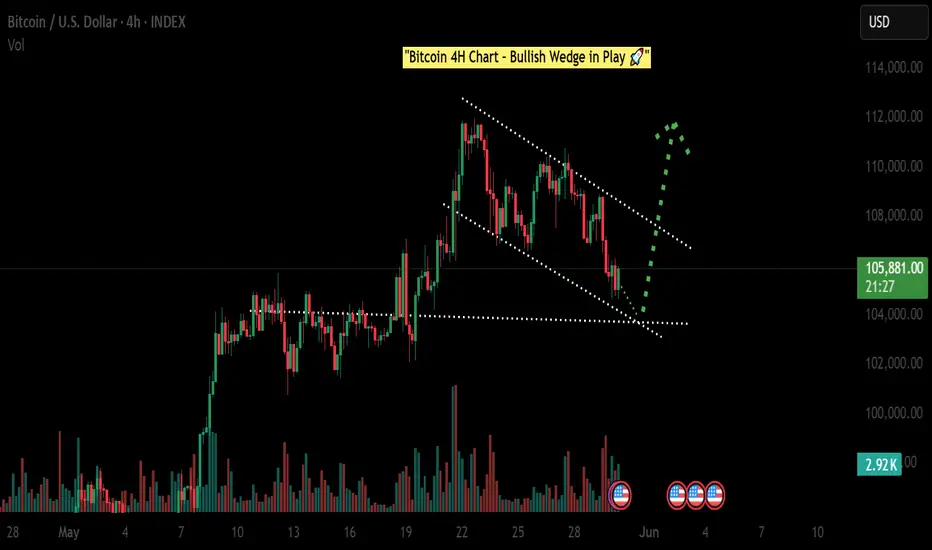
"BTC at Key Support – Watching for Bounce"🔍 BTC/USD 4H Chart Analysis – Falling Wedge Setup
Bitcoin is currently trading inside a falling wedge pattern, which historically tends to resolve to the upside. The price is approaching a key support area near the wedge's lower boundary, with decreasing volume indicating a possible shift in momentum.
We are now watching for a potential bullish reaction from this level. A breakout above the wedge resistance may open the door for a move toward the 110K region.
📌 Key Levels:
- Wedge Support: ~104K
- Resistance Breakout Zone: ~107K–108K
- Upside Target if breakout confirms: ~110K+
⚠️ This is not financial advice. This is a technical analysis idea based on historical chart patterns and market structure.
Let me know your thoughts in the comments. Do you think BTC will bounce here?
#Bitcoin #BTCUSD #Crypto #TechnicalAnalysis #FallingWedge
BTC/USDT Technical Analysis and Trade Idea📉 BTC Pullback or Full Reversal? Let's Break It Down 🔍
Looking at the Bitcoin chart right now, we’re seeing more than just a minor pullback. On the 30-minute timeframe, there’s a clear bearish market structure shift setting in. In my opinion, this isn't a quick dip before continuation — we may be in for a deeper retracement. 🧐
When we overlay NASDAQ (which Bitcoin is often closely correlated with), it becomes even clearer — tech stocks look overextended and are showing signs of a potential pullback. 📉
So here’s the plan:
If BTC pulls back into my point of interest, I’ll be watching for a bullish break of structure to consider a long position. Simple, structured, and in line with what the charts are telling us. 🔁💹
⚠️ As always, this is not financial advice — just sharing how I'm reading the market right now.
💬 What are your thoughts? Are you watching the same levels? Drop a comment below 👇 and let’s talk trade setups! 🚀

Bitcoin & Stock Market Rally Together .. My Trade Plan!🚨 Bitcoin Update! 🚨
Taking a look at the BTC chart 🧠📈 — we saw a sharp retracement followed by a strong rally 💥🔥, likely driven by recent tariff policy shifts 🌍📊.
Right now, I’m leaning bullish 🐂 — especially with the stock markets also pushing higher 📈💹. But let’s be clear: my bullish bias depends on the stock market holding strong 🛡️📊.
I’m keeping an eye out for a pullback to the 61.8% Fibonacci level 🌀 for a potential buy opportunity 💸🚀.
⚠️ This is not financial advice — just sharing my outlook!
👇 Let me know what you think in the comments!

#BTC/USD The Uptrend is still intact! Here's Why!BTC Daily Close Update
Bitcoin closed at $108,951, marking another failed attempt to break through the $111K resistance.
It’s been nearly 8 days of consolidation just below this level. That’s not ideal, and it signals we may need a fresh catalyst to push higher.
Not bearish, just cautious.
As long as the blue EMA holds on the daily, the uptrend remains intact.
Still watching for a move toward $117K.
DYOR, NFA
Please show your support with your likes.
Thank you
#PEACE
$BTC – Breaking Out of the Pattern?📈 Bitcoin ( CRYPTOCAP:BTC ) is testing the upper resistance zone of a multi-month structure.
✅ Break of Structure (BOS) has already occurred, adding fuel to the bullish case.
🚀 Just a bit more upside and CRYPTOCAP:BTC could escape this consolidation pattern completely.
Key levels to watch:
Break above ~$110K area
Green trendline remains strong support
Eyes on higher timeframe close to confirm breakout
This could be a pivot point for Bitcoin’s next leg higher — or a trap if sellers step in hard.

BItcoin; Heikin Ashi Trade IdeaCOINBASE:BTCUSD
Picture tells more than 1000 words!
Thank you for checking out!

RIP Bitcoin Sell to 45K ?Bitcoin broke the weekly channel last week. I expect a decline to 45K
Stop loss: 97600

Bitcoin Overextended? Watch These Key Levels for the Next Move!BTC/USDT 1H – Retrace Before the Next Leg? 🚦
Bitcoin has shown impressive strength recently. On the 1-hour chart the current price action looks overextended 📈. After a strong impulsive move up, we’re seeing signs of exhaustion, with price stalling near the $111,800 region. Liquidity appears thin on the buy side, and there’s a cluster of potential sell stops resting below the current high in the form of sell stop.
I’m anticipating a retrace into the Fibonacci zone, with key levels at the 50% - 61.8% retracement. This area aligns with previous consolidation and could act as a magnet for price, especially as liquidity is swept from late long positions. If we see price rotate and break structure bullishly at my point of interest, I’ll be looking for a long entry opportunity. 🔄
Fundamentals & Macro Backdrop 🌍
On the fundamental side, Bitcoin remains sensitive to macroeconomic and geopolitical developments. Ongoing uncertainty in global politics and central bank policy continues to drive volatility across risk assets. Bitcoin’s correlation with tech stocks and the NASDAQ remains significant—recent data shows that when the NASDAQ pulls back, Bitcoin often follows suit. If we see a correction in tech stocks, be prepared for a retrace in BTC as well. 📉
Institutional interest is still strong, but short-term sentiment is cautious as traders await clarity on inflation, interest rates, and regulatory news. Keep an eye on U.S. economic data releases and any major headlines out of Washington or global hotspots, as these can quickly shift risk appetite.
Fundamentals and macro news remain key drivers—stay nimble!
Let’s see if BTC can reload for another leg up, or if broader market weakness drags it lower. Trade safe! 🚀

BTC Hits New All-Time High: Is a $128K Blow-Off Top Next?Bitcoin's Meteoric Ascent: New All-Time Highs Fuel $128K "Blow-Off Top" Predictions Amidst Unprecedented Adoption
The digital gold rush of the 21st century is reaching a fever pitch. Bitcoin (BTC), the pioneering cryptocurrency, has not only shattered previous records but is now tantalizingly close to new, stratospheric all-time highs, with analysts eyeing a potential "blow-off top" as high as $128,000. This electrifying surge, which saw BTC climb to within 1.5% of new peaks as bullish sentiment decisively overcame final resistance, is underpinned by a confluence of factors: soaring institutional and retail adoption, particularly in the United States, booming ETF inflows, growing political and regulatory support, and a shifting macroeconomic landscape that increasingly favors non-traditional assets. As of May 21, 2025, Bitcoin has firmly established itself above the $109,000 mark, a testament to its resilience and burgeoning mainstream acceptance.
The recent price action has been nothing short of spectacular. Bitcoin bulls have been relentlessly "grilling sellers," pushing the price to historic milestones. On May 21, 2025, Bitcoin etched a new all-time high (ATH) above $109,000, a landmark achievement that notably placed 100% of BTC holders into profit. This surge saw Bitcoin's market capitalization briefly surpass that of e-commerce giant Amazon, a symbolic victory highlighting its growing financial clout. Specific figures around this period include a climb to a record $109,302, and another peak at a historic $109,500, demonstrating the intense buying pressure and bullish conviction in the market. Analysts are now recalibrating their upside targets, with many calling for $116,000 as the next significant milestone on the path to even loftier valuations.
This bullish momentum isn't occurring in a vacuum. It's the culmination of years of development, increasing understanding, and a series of pivotal events that have collectively propelled Bitcoin into the financial limelight.
The American Bitcoin Boom: Adoption Surpasses Gold, Institutions Dive In
One of the most compelling narratives driving Bitcoin's current rally is its explosive growth in the United States. A staggering 50 million Americans now own Bitcoin, a figure that notably surpasses the 37 million gold holders in the country. This demographic shift signifies a profound change in investment preferences, particularly among younger generations who are increasingly comfortable with digital assets. Bitcoin is no longer a niche interest for tech enthusiasts; it's becoming a recognized component of diversified investment portfolios across a broad swathe of the American population.
The institutional embrace within the US is equally, if not more, impactful. US firms now hold an astonishing 94.8% of the Bitcoin reserves held by publicly traded companies globally. This concentration underscores the confidence American corporations have in Bitcoin as a treasury reserve asset, a hedge against inflation, and a potential source of significant returns. Furthermore, the United States is solidifying its position as the global epicenter of the Bitcoin industry, with 40% of all Bitcoin companies headquartered domestically. This robust ecosystem of miners, exchanges, wallet providers, and ancillary service companies fosters innovation and provides a strong foundation for continued growth.
The advent and subsequent success of Bitcoin Exchange Traded Funds (ETFs) have been a game-changer. These regulated financial products have opened the floodgates for a new wave of capital, allowing retail and institutional investors to gain exposure to Bitcoin through traditional brokerage accounts without the complexities of direct ownership and custody. The "booming ETF inflows" are a direct contributor to the recent price surge, creating sustained buying pressure and signaling widespread market acceptance.
Macroeconomic Tailwinds and Regulatory Optimism
Beyond direct adoption, broader economic and political factors are playing a crucial role. The recent new all-time high of $109,000 was notably set just nine days after the US and China closed a 90-day trade agreement. This resolution eased economic uncertainty and market jitters that had previously weighed on global markets. In such an environment, assets perceived as hedges against traditional market volatility or fiat currency devaluation, like Bitcoin and gold, often thrive. Indeed, concurrent with Bitcoin's rise, concerns such as Japan's debt woes have contributed to gold surpassing the $3,300 mark, indicating a broader flight to alternative stores of value.
Furthermore, there's growing optimism around US regulations concerning cryptocurrencies. While the regulatory landscape is still evolving, recent pronouncements and actions suggest a move towards greater clarity and a more accommodative stance, rather than outright prohibition. This "growing political support" is crucial for long-term institutional commitment, as regulatory uncertainty has historically been a significant barrier to entry for larger, more conservative investors. The fact that Bitcoin climbed to a record of $109,302, breaching a previous high set around the time of a major political event like a presidential inauguration (specifically referenced as Trump's inauguration on Jan. 20 in a historical context for a previous ATH), often correlates with market sentiment interpreting political or regulatory shifts as favorable.
The "Bitcoin Strategic Reserve" (BSR): A Paradigm Shift for National Economies?
An intriguing, albeit more speculative, concept gaining traction is the idea of a "Bitcoin Strategic Reserve" (BSR). While not yet a formal policy in any major nation, the discussion itself highlights Bitcoin's evolving perception from a purely speculative asset to one with potential strategic geopolitical and economic importance.
A BSR would involve a nation-state, such as the United States, acquiring and holding Bitcoin as part of its national reserves, much like it currently holds gold or foreign currencies. The rationale behind such a move could be multifaceted:
1. Hedging Against Fiat Devaluation: As central banks globally continue to engage in monetary expansion, concerns about the long-term purchasing power of fiat currencies persist. Bitcoin, with its fixed supply, offers a potential hedge against this inflation.
2. Participating in a New Financial System: If Bitcoin continues its trajectory towards becoming a globally recognized store of value or even a medium of exchange for certain international transactions, holding it in reserve would position a nation to participate actively in this emerging financial infrastructure.
3. Technological Leadership: For a country like the US, which already leads in Bitcoin company headquarters and corporate holdings, establishing a BSR could further cement its leadership in the digital asset space, attracting talent and capital.
4. Economic Resilience: In a future where digital currencies play a more significant role, a BSR could offer a degree of economic resilience and autonomy, reducing reliance on traditional financial systems or the currencies of other nations.
The implications of a major economic power like the US even seriously considering, let alone implementing, a BSR would be monumental for Bitcoin's legitimacy and price. It would signal ultimate institutional acceptance and could trigger a wave of similar considerations by other nations, creating immense demand for a limited supply of BTC. While the "Bitcoin Strategic Reserve Explained and What BSR Means for the US Economy" remains a topic of forward-looking discussion, its emergence in financial discourse is a testament to how far Bitcoin has come.
The Path to $128K: Understanding the "Blow-Off Top"
With Bitcoin having decisively broken past $109,000 and upside targets of $116,000 now in common parlance, the ultimate bull-case scenario being discussed is a "blow-off top" potentially reaching $128,000 or even higher.
A "blow-off top" is a chart pattern that signifies a steep and rapid price increase in an asset, often on high volume, followed by an equally sharp reversal. It typically occurs at the end of a prolonged bull market or a parabolic advance. The psychology behind it involves:
1. Euphoria and FOMO (Fear Of Missing Out): As prices accelerate, media attention intensifies, and stories of quick riches abound. This draws in a flood of retail investors who don't want to miss out on the gains.
2. Exhaustion of Buyers: The parabolic rise eventually becomes unsustainable. The last wave of enthusiastic buyers enters at or near the peak.
3. Smart Money Distribution: Experienced traders and institutions, who may have accumulated positions much lower, begin to sell into this heightened demand, taking profits.
4. Sharp Reversal: Once buying pressure is exhausted and selling pressure mounts, the price can fall dramatically as latecomers panic-sell and stop-losses are triggered.
Predicting the exact peak of a blow-off top is notoriously difficult. However, analysts use a combination of technical analysis (chart patterns, momentum indicators, Fibonacci extensions), on-chain data (network activity, holder behavior), and market sentiment to identify potential price targets and warning signs. The $128,000 figure is likely derived from such analyses, representing a significant psychological level or a projection based on previous market cycle behavior.
Navigating the Bull Market: Indicators for Identifying a Cycle Top
While the current sentiment is overwhelmingly bullish, savvy Bitcoin traders and investors are always mindful of market cycles and the potential for corrections or trend reversals. The question, "Is Bitcoin price close to a cycle top?" is one that prudent market participants constantly evaluate. Several indicators can help traders gauge whether a market might be overheating:
1. Moving Average Convergence Divergence (MACD): This trend-following momentum indicator can show bearish divergences, where the price makes new highs, but the MACD fails to do so, signaling weakening momentum.
2. Relative Strength Index (RSI): An RSI reading above 70 is generally considered overbought, and readings above 80 or 90 in a strong bull market can signal extreme conditions, though Bitcoin can remain overbought for extended periods. Bearish divergences on the RSI are also key.
3. On-Chain Metrics (e.g., MVRV Z-Score, Puell Multiple, SOPR):
o MVRV Z-Score (Market Value to Realized Value): Compares Bitcoin's market cap to its realized cap (the price at which each coin last moved). High Z-scores indicate the market cap is significantly higher than the average cost basis, suggesting the asset is overvalued and potentially near a top.
o Puell Multiple: Looks at the supply side of Bitcoin's economy – miners and their revenue. It divides the daily issuance value of bitcoins (in USD) by the 365-day moving average of daily issuance value. High values suggest miner profitability is high compared to historical norms, which has sometimes coincided with market tops.
o Spent Output Profit Ratio (SOPR): This indicates if holders are, on average, selling in profit or loss. Values significantly above 1 suggest holders are realizing substantial profits, which can increase sell pressure. A sustained drop below 1 after a peak can signal a shift in trend.
4. Logarithmic Growth Curves: Bitcoin's long-term price action has often respected logarithmic growth channels. When the price reaches the upper band of these channels, it has historically indicated a market top.
5. Funding Rates and Open Interest in Derivatives Markets: Extremely high positive funding rates on perpetual swaps indicate that an overwhelming number of traders are long and paying a premium to maintain those positions. This can signal excessive bullishness and a crowded trade, making the market vulnerable to a long squeeze if prices reverse. High open interest can also exacerbate volatility.
While Bitcoin is currently refusing to give up on its quest to revisit $108,000 (a level now surpassed) and beyond, concerns over a trend change, though perhaps quieter amidst the euphoria, are always present in the minds of seasoned investors. These indicators provide a more objective lens through which to assess the sustainability of the current rally.
The Road Ahead: Uncharted Territory with Immense Potential
As Bitcoin forges new all-time highs, it enters uncharted territory. The confluence of unprecedented US adoption, robust institutional investment via ETFs, a more favorable regulatory outlook, and supportive macroeconomic conditions has created a potent cocktail for price appreciation. The surpassing of Amazon's market cap, even if temporary, and the fact that 100% of BTC holders are in profit, are powerful psychological milestones that can fuel further confidence.
The predictions of a $116,000 interim target and a potential $128,000 blow-off top are no longer fringe theories but are being seriously discussed by mainstream analysts. The narrative of Bitcoin as "digital gold" is gaining more traction than ever, especially as traditional safe havens like gold also see increased interest amidst global economic uncertainties like Japan's debt situation.
However, the path is unlikely to be linear. Bitcoin's inherent volatility means that sharp corrections can and will occur, even within a broader uptrend. The "concerns over a trend change" will likely grow louder as prices reach more extreme levels, and profit-taking becomes more tempting. Investors should remain vigilant, utilize the available indicators to assess market conditions, and practice sound risk management.
In conclusion, May 2025 has marked a historic period for Bitcoin. Its surge above $109,000, driven by a powerful combination of fundamental adoption and favorable market dynamics, has set the stage for potentially even more dramatic price action. Whether the ultimate peak of this cycle is $116,000, $128,000, or another figure entirely, one thing is clear: Bitcoin has firmly cemented its place in the global financial landscape, and its journey is far from over. The coming weeks and months will be closely watched by investors worldwide as the world's preeminent cryptocurrency continues to redefine the boundaries of financial assets.
________________________________________
Disclaimer: This article is for informational purposes only, based on the provided snippets, and should not be considered financial advice. Investing in Bitcoin and other cryptocurrencies is highly speculative and carries a significant risk of loss. Past performance is not indicative of future results. Always conduct your own thorough research and consult with a qualified financial advisor before making any investment decisions.

Bitcoin BTC Bullish Setup: Here’s What I’m Watching Next!Bitcoin (BTC) is looking incredibly strong right now on the higher timeframes 🔥. We’re seeing a clear bullish trend with consistent higher highs and higher lows, which keeps my bias firmly to the upside 🚀...
In this video, I take you through my full multi-timeframe analysis, breaking down:
- The macro bullish structure unfolding on the daily chart 🗓️
- My key levels of interest for a potential pullback entry 🎯
- What I’m watching for on the 4H and 1H charts to confirm continuation setups ⏱️
- My target zones, including recent swing highs and areas of liquidity 📍
If Bitcoin gives us a healthy retrace, I’ll be watching closely for a bullish break of structure to confirm a high-probability buy opportunity 🟢.
⚠️ Reminder: This is not financial advice — always do your own research and manage your risk appropriately. 🛡️💼

#BTC/USDT Highest Daily Close! What it Means? $117k on cards?Bitcoin Daily Update – Bulls Take the Lead
Bitcoin just recorded its highest daily close in history at $106,849.99 (Binance), surpassing the previous record of $106,143.82 set on January 21st. While the difference is minor in percentage terms, it's still a meaningful win for the bulls.
The next key level to watch is $113k to $117k, based on the Fibonacci extension target.
For confirmation, we need another solid daily candle close above the current range. The $106K resistance has already been broken, and BTC is holding above it, indicating strong bullish momentum.
To avoid getting trapped in a fakeout, consider adding the 14 EMA to your chart. As long as BTC holds above this EMA, the uptrend is likely to continue.
Once BTC's show is over, Altcoins will likely follow suit.
INVALIDATION OF THIS CHART: A close below $102k in confluence with 14EMA in Daily.
I hope this update gives you actionable insight. If it did, feel free to follow and like. Let me know your thoughts or questions in the comments, I read every one.
Thank you
#PEACE
