Bitcoin - The cycles are playing out!⚔️Bitcoin ( CRYPTO:BTCUSD ) just repeats another cycle:
🔎Analysis summary:
Following all of the previous all time high breakouts, Bitcoin will now further extend the rally. After some simple calculation, we can see that Bitcoin will rally another +50% in order to reach the overall price target. However there will be volatility along the way so make sure to remain calm.
📝Levels to watch:
$200.000
SwingTraderPhil
SwingTrading.Simplified. | Investing.Simplified. | #LONGTERMVISION
Bitcoinlong

BITCOIN PREDICTION - MASSIVE CANDLE INCOMING!!! (WARNING) Watch this Bitcoin Prediction video now, you will love it!
Yello, Paradisers! Big warning sign: #Bitcoin is about to liquidate more traders soon if we get these confirmations that I'm sharing with you in this video. Loads of people will get wrecked again. Be careful not to get trapped into fakeouts.
In this video, I'm describing exactly what I'm seeing on Bitcoin, what patterns I'm waiting to form, and what confirmations I want to see before being able to say with 100% accuracy guaranteed that MARKETSCOM:BITCOIN is moving in that direction.
I'm sharing with you all the important targets and also how professional trading works: how risk-reward proper ratio trading works, and how high-probability trading depends a lot on how you choose to create your trades.
Watch this Bitcoin prediction to understand what I'm seeing right now on the chart and how I'm acting and making my decisions.

BITCOIN IS CREATING A SECRET PATTERN! (Huge move incoming?!)Yello paradisers! I'm describing to you what's going on with Bitcoin right now. We are creating a secret pattern that is forming, and once its neckline is reclaimed, we are going to have a huge movement.
In this video, I'm sharing with you the most important support and resistances on multiple time frames. We are describing Elliott wave theory wave count, and taking a look at candlestick patterns. We are talking about confirmations necessary for bullish and bearish cases. I'm explaining to you what the professional trading signals need for long-term profitability.
Some of the points are great risk-reward ratios. I'm talking about that in the video. One of them is taking only the highest probability trade setups, and having the patience and discipline to wait for them.
I'm talking about proper strategy which is needed, and systemology in your overall trading and how important it is. Here on TradingView, I'm describing to you the overall bias I have on Bitcoin right now.
Don't be a gambler. Don't try to get rich quick. Make sure that your trading is professionally based on proper strategies and trade tactics.

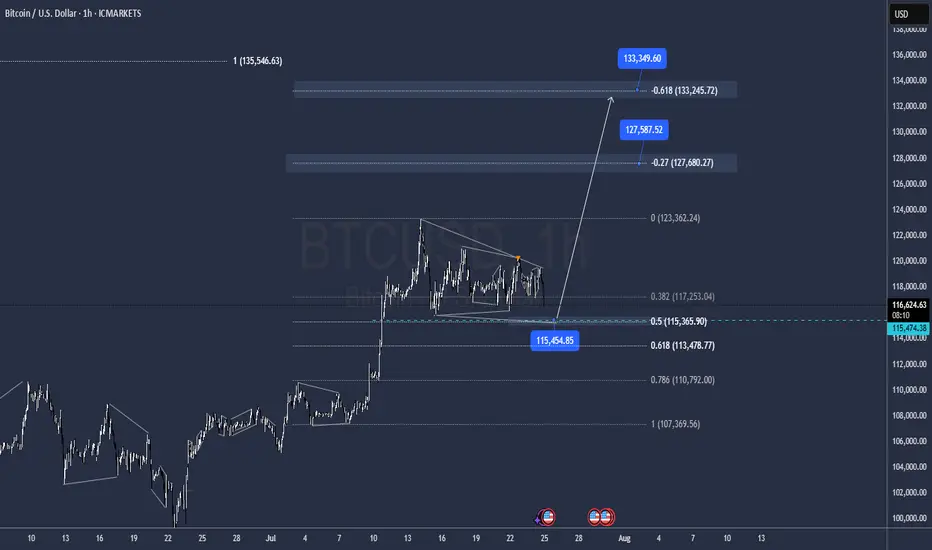
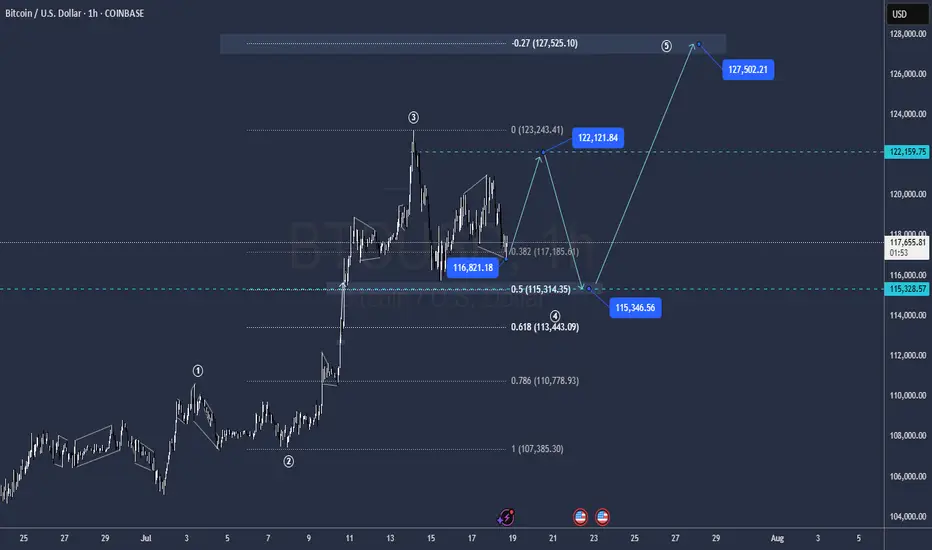
BTC Correction may be overOn a new look to the structure with the lat moves, it has the Potential to be over after tapping 115.500 and go for new Highs @ 127.500 / 133.000 as all internal impulses seeems to be matched.
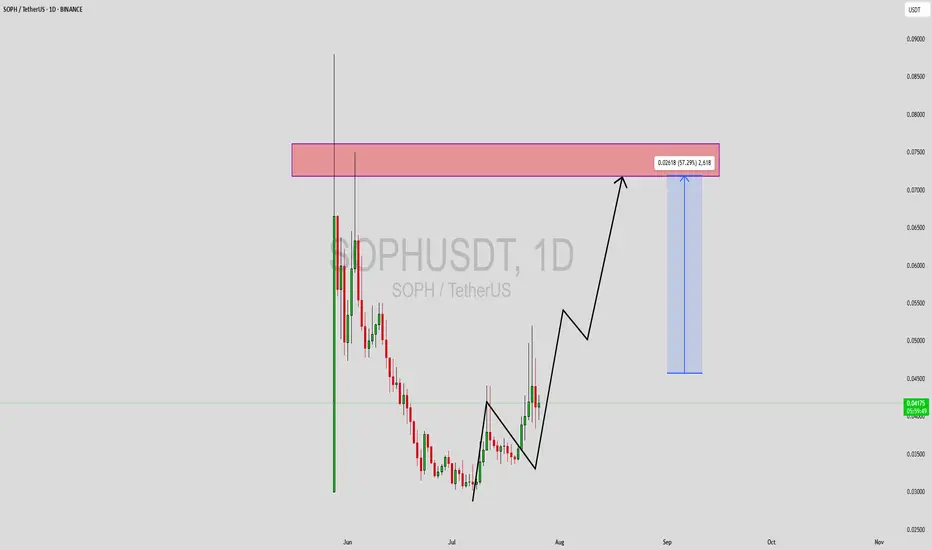
SOPHUSDT Forming Bullish ReversalSOPHUSDT is currently displaying a bullish reversal structure on the daily chart, forming a classic staircase pattern with higher highs and higher lows. After a prolonged downtrend, the asset appears to have found a strong accumulation base, and recent price action is now showing momentum building toward a breakout move. The chart suggests a 50%+ potential upside move from the current levels, targeting the major resistance zone around $0.07–$0.075, which is a previously tested supply zone.
Volume confirmation is key here—the recent increase in volume alongside green bullish candles indicates growing investor interest and possible early accumulation from smart money. This is typically a strong signal for upcoming continuation in price movement. With solid support now established below and momentum pushing upward, traders may find a favorable reward-to-risk setup here.
This move is further supported by positive sentiment building across the crypto space for SOPH, with many traders beginning to take notice. The expected gain zone reflects realistic mid-term targets and aligns with previous resistance levels. A clean breakout and retest above $0.045 would further confirm bullish dominance and open doors for rapid price appreciation in the coming weeks.
The overall setup on SOPHUSDT is technically sound, with good volume, bullish structure, and an appealing price action flow. For traders scanning the market for high-potential altcoins, this could be one to watch closely.
✅ Show your support by hitting the like button and
✅ Leaving a comment below! (What is You opinion about this Coin)
Your feedback and engagement keep me inspired to share more insightful market analysis with you!
ERAUSDT Forming Bullish FlagERAUSDT has caught the attention of traders after a strong impulsive move that has laid the foundation for a possible continuation of its bullish trend. The current structure appears to be forming a classic bullish flag/pennant formation, a pattern often observed in strong uptrends, where price consolidates in a narrow range before breaking out higher. With volume supporting the recent breakout and price action showing resilience near consolidation support, this setup presents an exciting upside potential.
The projected gain of 90% to 100%+ aligns well with the technical structure seen on the chart, especially considering the momentum-driven environment ERAUSDT is trading in. As price continues to coil within a tight range, it builds the energy necessary for a decisive breakout. The bullish sentiment surrounding the ERA ecosystem, coupled with increasing interest from speculative and long-term investors, could be the fuel needed to push this pair into a significant rally.
Fundamentally, ERA is beginning to draw more eyes from across the crypto community, possibly due to developments or partnerships that are elevating its profile. This blend of technical readiness and rising investor interest makes it a coin to watch in the short to mid-term. If bullish confirmation holds, the next leg could be sharp and aggressive, potentially achieving or even exceeding the projected 100% target.
This is a moment where traders who rely on high-reward momentum setups could benefit by monitoring this pair closely. With risk well-defined below recent lows and the structure signaling strength, ERAUSDT deserves a spot on every active trader's radar.
✅ Show your support by hitting the like button and
✅ Leaving a comment below! (What is You opinion about this Coin)
Your feedback and engagement keep me inspired to share more insightful market analysis with you!

BITCOIN Wait For Breakout!
HI,Traders !
#BITCOIN has formed a Bullish Wedge pattern
While trading in an uptrend As
we mentioned in a previous analysis
So we are bullish biased and
IF we see a bullish breakout
We will be expecting a
Further bullish move up !
Comment and subscribe to help us grow !

BITCOIN RESULTS Bitcoin has respected the analysis and held very well it’s been following the trend and can partial close some positions and wait for a nice pullback to buy the dip
Buy BTCUSD now up trendBuy BTCUSD now up trend and now third swing going on, so expected slow move. but target will reach surely

bitcoin, Stay heavy on positionsbitcoin, Stay heavy on positions
Short-term overbought is noise. Focus on the bigger picture. Keeping my position heavy—no plans to reduce yet

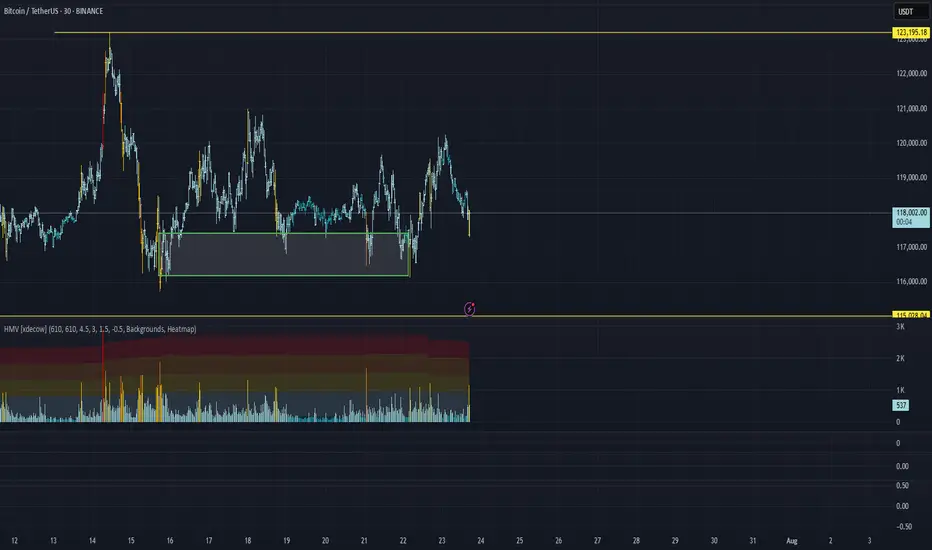
BTC/USDT Analysis. Inside the Range
Hello everyone! This is the daily analysis from a trader-analyst at CryptoRobotics.
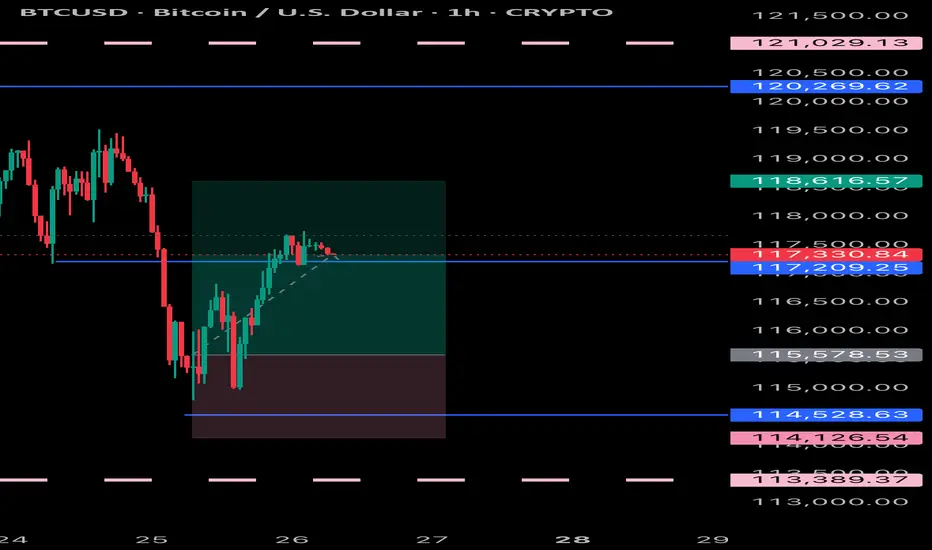
Yesterday, Bitcoin tested the previously mentioned POC (the point of control — the area with the highest volume concentration within the range). A reaction followed: buyers prevented the price from falling below that level.
At the moment, we still expect a breakout from the range to the upside. On the lower timeframe, buyers are once again trying to gain control through delta. If the price breaks above $118,800, we can expect a move at least toward ~$120,000. A potential retest of the local zone at $118,000–$117,600 (signs of market buying aggression on the 15m timeframe) is also possible, followed by a continuation of the uptrend. Larger buy zones are marked below.
Buy zones:
~$115,000 (zone of initiating volumes)
$110,000–$107,000 (accumulated volumes)
This publication is not financial advice
MUBARAKUSDT Forming Bullish PennantMUBARAKUSDT is currently displaying a bullish pennant pattern, which is often seen as a continuation signal following a strong upward price movement. This setup typically indicates a brief consolidation phase before the price resumes its upward trend. With volume remaining consistent and interest from the trading community growing, this pennant formation may be preparing for a breakout that could lead to a substantial rally. Based on this pattern and the current market sentiment, a potential gain of 90% to 100%+ could be on the horizon.
Bullish pennants are powerful technical formations that attract traders looking for breakout momentum. MUBARAKUSDT’s consolidation within this pattern is healthy and controlled, which often precedes a breakout with strong follow-through. If the price action breaks above the upper trendline of the pennant with an increase in volume, it would confirm bullish strength and validate the expected move. The psychological support from the growing community around the project also strengthens the bullish case.
Investor interest is steadily building as the project continues to gain visibility in the meme and community-driven token space. The technicals align well with the narrative—low market cap, increasing trading volume, and a favorable chart setup all point toward an explosive breakout potential. This setup is being closely monitored by traders seeking high-risk, high-reward entries in altcoins with meme energy.
Keep an eye on key resistance levels and wait for confirmation on breakout candles before entering. MUBARAKUSDT might become one of the standout performers in the current meme token rotation, making it a promising opportunity in the short to mid-term.
✅ Show your support by hitting the like button and
✅ Leaving a comment below! (What is You opinion about this Coin)
Your feedback and engagement keep me inspired to share more insightful market analysis with you!

Revsiting $150k - $200k Bitcoin (AND Next Bear Market Bottom)In this video I revisit my 2-year old study showing the potential path for Bitcoin to $150k to $200k and not only how we might get there, but the 11 reasons WHY we can this cycle.
This is the same Fibonacci series that predicted the 2021 cycle high at the 3.618 (Log chart) and used the same way this cycle, with some interesting 2025 forecasts of:
1.618 - $100k
2.618 - $150k
3.618 - $200k
There are quite a few confluences that we get to $150k like the measured moves from both the recent mini bull flag, but also the larger one from earlier this year.
** Also I touch on revisiting my study from 2 years ago where I may have discovered the retracemebnt multiple that correctlty predicted and held the 2022 lowes around $16k. **
It's a VERY interesting number you all will recognize (buy may not agree with).
Let me know what you think.

Bitcoin - Trust the higher timeframe!⚔️Bitcoin ( CRYPTO:BTCUSD ) is still 100% bullish:
🔎Analysis summary:
For the past couple of months we have been seeing an overall consolidation on Bitcoin. But looking at the higher timeframe, Bitcoin remains in an underlying strong bullrun. Consolidations are always expected and no reason to freak out since everything is still bullish.
📝Levels to watch:
$100.000
🙏🏻#LONGTERMVISION
Philip - Swing Trader

BTC - Long SET-UP BINANCE:BTCUSDT
Bitcoin AMC Pattern Forming?
BTC is showing signs of an AMC-style accumulation after a range-bound consolidation. A clean breakout is possible if price respects the 113k–113.8k support zone — potential entry zone for smart money 📈
Alternatively, deeper liquidity may be tapped at the 110k–112k OB zone, offering another high-probability buy setup🔁
Watch for signs of bullish intent in these key zones — price structure suggests upside potential once liquidity is swept✅

BTC/USDT Analysis: Inside the Range
Hello everyone! This is a daily analysis from a trader-analyst at CryptoRobotics.
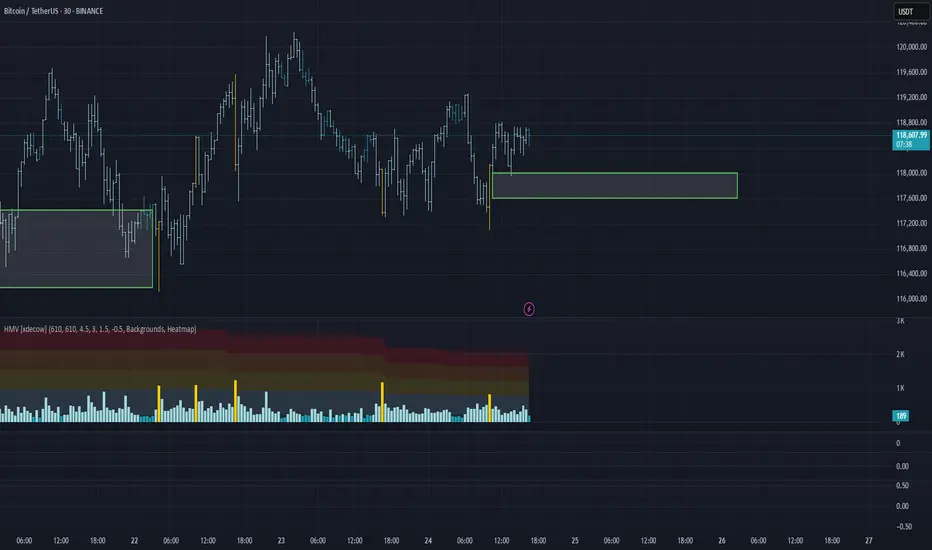
Yesterday, Bitcoin continued moving toward the upper boundary of the sideways range. Strong market buying emerged near that level, but unfortunately, it was absorbed by sellers.
At the moment, we are testing the POC (Point of Control) of the current trading range. Buyer activity is already appearing at this level. If bulls regain initiative, we can expect a move back to the upper boundary. However, if the price drops below the current level, there is a high probability of stop-loss hunting and a liquidity grab near $115,000.
Buy Zones:
~$115,000 (zone of initiating/pushing volumes)
$110,000–$107,000 (accumulated volumes)
This publication is not financial advice.
Bitcoin - The cycle is just starting!⚔️Bitcoin ( CRYPTO:BTCUSD ) just created new highs:
🔎Analysis summary:
Bitcoin is currently - especially with the new all time high breakout - just perfectly following previous cycle behavior. Since there is no real resistance above current price, apart from psychological levels, I do expect a substantial rally back to the upper channel resistance trendline.
📝Levels to watch:
$300.000
🙏🏻#LONGTERMVISION
Philip - Swing Trader

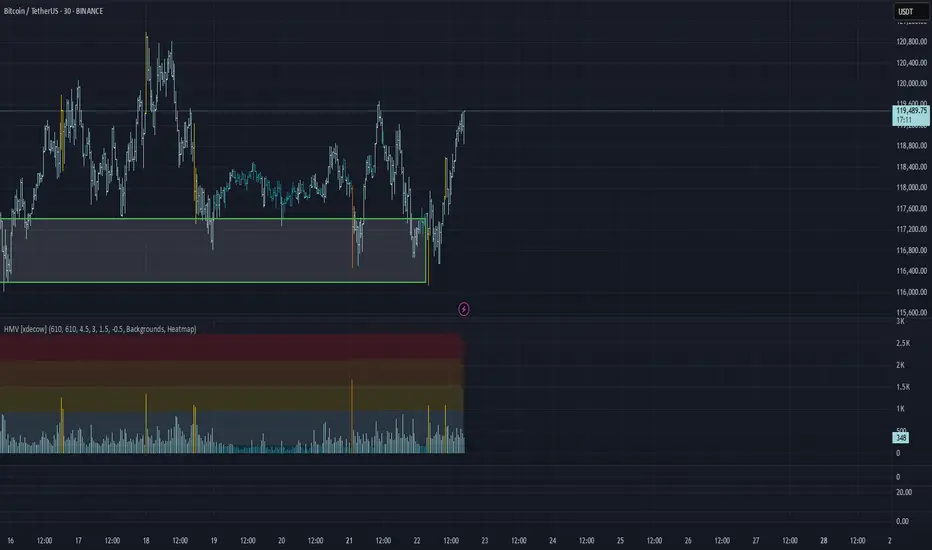
BTC/USDT Analysis: Rotation Continues
Hello everyone! This is a daily analysis from a trader-analyst at CryptoRobotics.
Yesterday, Bitcoin continued to rotate within a narrow sideways range, and so far, there has been no breakout. We retested the lower boundary of the range and once again saw absorption of market selling at that level.
At the moment, the scenario remains valid — we expect a breakout to the upside. Several factors support this outlook: strong defense at the lows, delta absorption across the entire range, and buyer control on the most recent local upward wave.
A less likely scenario is a dip into the lower buy zone, a liquidity grab, and another attempt to move higher.
Buy Zones:
~$115,000 (zone of initiating/pushing volumes)
$110,000–$107,000 (accumulated volumes)
This publication is not financial advice.
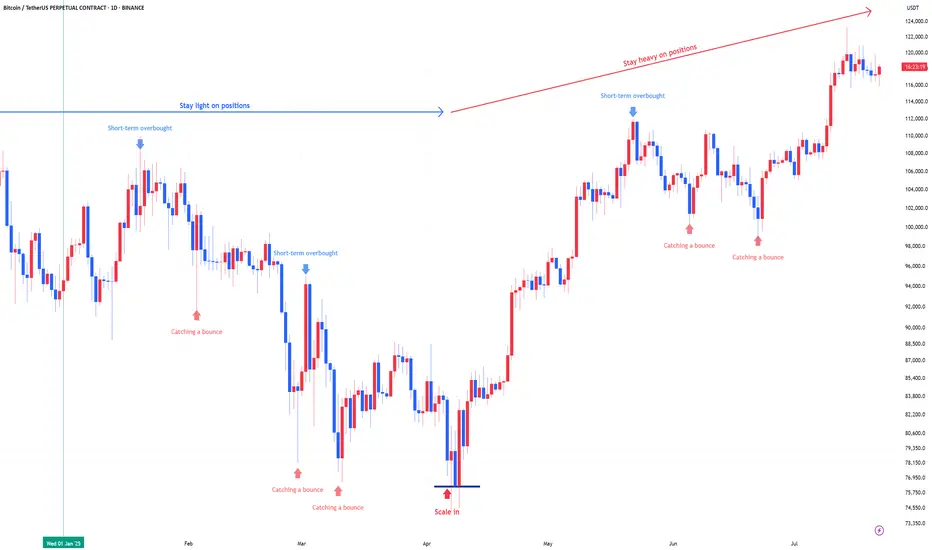
Bitcoin : Stay heavy on positionsApril was the scale-in zone:
Back in April, the US stock market flashed a split-entry buy signal—a classic zone for gradual accumulation.
That same setup applied to Bitcoin. Buying the fear worked again.
We’ve moved out of the fear zone:
Both Bitcoin and equities have left the extreme fear territory behind. Sentiment has shifted.
Short-term overbought now:
Bitcoin is currently in a short-term overbought phase. Some consolidation or cooling off is natural here, but no major trend reversal signs yet.
Stay heavy on positions:
I’m maintaining an overweight position in Bitcoin as long as the US stock market stays intact. The Nasdaq is holding up, so Bitcoin likely stays in risk-on mode.
Warning:
If US equities take a hit, expect Bitcoin to follow.
Negative moves in the stock market will likely translate directly into crypto weakness.
Bitcoin Weekend ForecastIts in the middel of wave 4 correction, impulses are tradeable
Levels Highlighted in the chart
Bitcoin Technical Setup: Support Holds, Wave 5 in FocusBitcoin ( BINANCE:BTCUSDT ) filled the CME Gap($117,255-$116,675) and started to rise, as I expected in my previous idea .
Bitcoin is currently trying to break the Resistance zone($119,530-$118,270) . In the last week's movement, the price of $118,000 can be considered as one of the most important numbers for Bitcoin , with a lot of trading volume around this price.
In terms of Elliott Wave theory , it seems that Bitcoin has managed to complete the main wave 4 near the Support zone($116,900-$115,730) and Support lines . The structure of the main wave 4 is a Zigzag Correction(ABC/5-3-5) (so far). There is a possibility that the 5th wave will be a truncated wave because the momentum of the main wave 3 is high and Bitcoin may NOT create a new ATH and the main wave 5 will complete below the main wave 3.
I expect Bitcoin to start rising near the Potential Reversal Zone(PRZ) and Cumulative Long Liquidation Leverage($118,277-$118,033) , break the Resistance zone($119,530-$118,270) and reach the targets I have marked on the chart.
Note: Stop Loss(SL)= $116,960
CME Gap: $115,060-$114,947
Cumulative Short Liquidation Leverage: $121,502-$121,134
Cumulative Short Liquidation Leverage: $120,612-$119,783
Cumulative Long Liquidation Leverage: $116,810-$115,522
Do you think Bitcoin can create a new ATH again?
Please respect each other's ideas and express them politely if you agree or disagree.
Bitcoin Analyze (BTCUSDT), 1-hour time frame.
Be sure to follow the updated ideas.
Do not forget to put a Stop loss for your positions (For every position you want to open).
Please follow your strategy and updates; this is just my Idea, and I will gladly see your ideas in this post.
Please do not forget the ✅' like '✅ button 🙏😊 & Share it with your friends; thanks, and Trade safe.

BITCOIN FINAL WARNING BEFORE HUGE MOVE!!! (urgent) Yello Paradisers! I am Sharing with you my idea about #Bitcoin of what's going on with Bitcoin right now: be very careful because the Fear and Greed Index, a special one, is at "Greed". We are seeing funding rates, the accumulated funding rates, as extremely positive. We are seeing bearish patterns forming.
In this video, I'm describing the confirmations we are waiting for that will confirm that Bitcoin is about to make a huge movement. Make sure that you are trading with professional trading strategies and that you are waiting for confirmations before any trade execution. Also, make sure that you have tight risk management because only the best, most professional traders will win long-term in this game.
Don't be a gambler. Don't try to get rich quick. Make sure that your trading is professionally based on proper strategies and trade tactics.

Urgent Bitcoin Prediction: Longs Beware!!! Bitcoin longs should be careful, as we are below an important resistance and the market looks bearish. Wait for the confirmations I’ve shown in the video before making any moves! Trade professionally with a proper strategy and well-defined entry tactics!
