Weekly Support is around 80000.Weekly Support is around 80000.
However, 72500 - 73000 is its previous
breakout level & probably a Best Buying Rage
(if it touches) which is also a Confluence area of
Trendline Support+Important Fib. level.
Bullish Divergence on Shorter Time Frame +
Weekly Support around 80000 (if Sustained)
may push the Price up towards 87000 &
then around 95000 - 96000.
Ultimate Resistance is around 110000.
Crossing this level may open new Highs
Targeting around 136000.
On Shorter Timeframe, 85000 - 86000 is
the Immediate Resistance & Support is
around 80000.
Bitcoinlong

Bitcoin -Weekly, Daily, H4, H1 Forecasts, Trading IdeasMidterm forecast, Weekly Timeframe:
While the price is above the support 70550.04, resumption of uptrend is expected.
We make sure when the resistance at 91037.20 breaks.
If the support at 70550.04 is broken, the short-term forecast -resumption of uptrend- will be invalid.
BITSTAMP:BTCUSD MARKETSCOM:BITCOIN
Daily Timeframe:
A trough is formed in daily chart at 74545.70 on 04/09/2025, so more gains to resistance(s) 86499.57 and maximum to Major Resistance (91037.20) is expected.
Take Profits:
86499.57
91037.20
94505.46
98675.19
101430.12
105431.17
109932.89
115000.00
120000.00
125000.00
130000.00
140000.00
H4 Timeframe:
H1 Timeframe:
________________________________________________________________
❤️ If you find this helpful and want more FREE forecasts in TradingView,
. . . . . . . . Hit the 'BOOST' button 👍
. . . . . . . . . . . Drop some feedback in the comments below! (e.g., What did you find most useful? How can we improve?)
🙏 Your support is appreciated!
Now, it's your turn!
Be sure to leave a comment; let us know how you see this opportunity and forecast.
Have a successful week,
ForecastCity Support Team

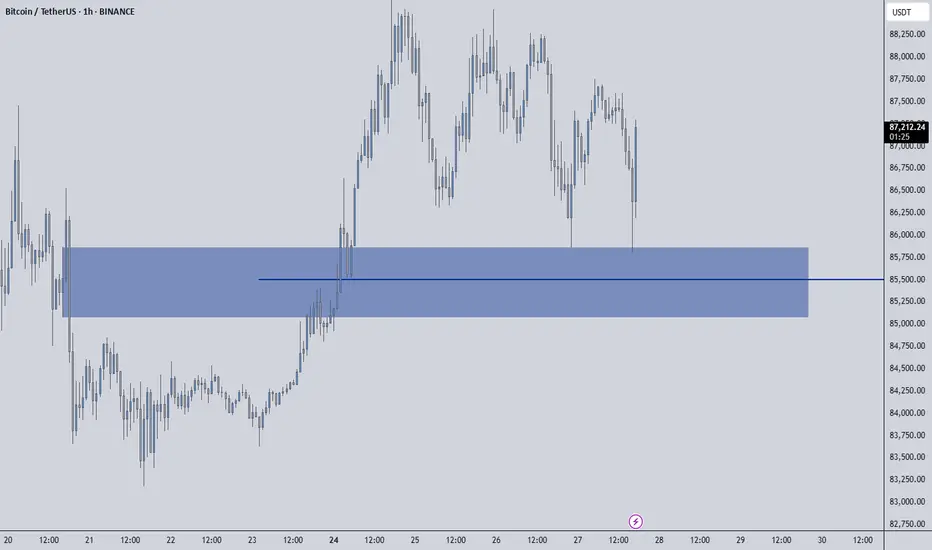
BTCUSDT | Waiting for Precision – Not Just Price LevelsMany were tempted to short BTCUSDT around the $83,000 region, and I was closely watching it too. However, as always, I don’t take trades based solely on price levels. What separates professional trading from guesswork is the data behind the scenes, and in this case, CDV (Cumulative Delta Volume) did not show any bearish divergence. That’s why I completely passed on this level without hesitation.
🎯 What’s Next?
Upper Blue Box is My Focus: I’ve now shifted my attention to the next key upper blue box, where I’ll be looking for serious short opportunities, but only if LTF confirmations such as orderflow shifts, CDV divergences, or volume traps appear.
Why I Wait: Just because a price hits a “zone” doesn’t mean we react. Professional traders wait for confluence, confirmation, and controlled risk.
🔒 Smart Trader Checklist:
No CDV divergence = No trade.
Wait for price to enter the upper blue box and react.
Short only with proper lower time frame confirmation.
If price breaks above with strong momentum and retest, I will not insist on shorts. I will shift and look for longs.
💡 I trade with precision and patience—not emotion. These levels are not random lines, but key zones mapped with advanced tools and strict discipline. That’s why my followers consistently win, and why my success rate is among the highest you’ll find here.
If you want to trade with clarity, confidence, and data-backed precision, just keep following me. You’ll see the difference.
📌I keep my charts clean and simple because I believe clarity leads to better decisions.
📌My approach is built on years of experience and a solid track record. I don’t claim to know it all but I’m confident in my ability to spot high-probability setups.
📌If you would like to learn how to use the heatmap, cumulative volume delta and volume footprint techniques that I use below to determine very accurate demand regions, you can send me a private message. I help anyone who wants it completely free of charge.
🔑I have a long list of my proven technique below:
🎯 ZENUSDT.P: Patience & Profitability | %230 Reaction from the Sniper Entry
🐶 DOGEUSDT.P: Next Move
🎨 RENDERUSDT.P: Opportunity of the Month
💎 ETHUSDT.P: Where to Retrace
🟢 BNBUSDT.P: Potential Surge
📊 BTC Dominance: Reaction Zone
🌊 WAVESUSDT.P: Demand Zone Potential
🟣 UNIUSDT.P: Long-Term Trade
🔵 XRPUSDT.P: Entry Zones
🔗 LINKUSDT.P: Follow The River
📈 BTCUSDT.P: Two Key Demand Zones
🟩 POLUSDT: Bullish Momentum
🌟 PENDLEUSDT.P: Where Opportunity Meets Precision
🔥 BTCUSDT.P: Liquidation of Highly Leveraged Longs
🌊 SOLUSDT.P: SOL's Dip - Your Opportunity
🐸 1000PEPEUSDT.P: Prime Bounce Zone Unlocked
🚀 ETHUSDT.P: Set to Explode - Don't Miss This Game Changer
🤖 IQUSDT: Smart Plan
⚡️ PONDUSDT: A Trade Not Taken Is Better Than a Losing One
💼 STMXUSDT: 2 Buying Areas
🐢 TURBOUSDT: Buy Zones and Buyer Presence
🌍 ICPUSDT.P: Massive Upside Potential | Check the Trade Update For Seeing Results
🟠 IDEXUSDT: Spot Buy Area | %26 Profit if You Trade with MSB
📌 USUALUSDT: Buyers Are Active + %70 Profit in Total
🌟 FORTHUSDT: Sniper Entry +%26 Reaction
🐳 QKCUSDT: Sniper Entry +%57 Reaction
📊 BTC.D: Retest of Key Area Highly Likely
📊 XNOUSDT %80 Reaction with a Simple Blue Box!
📊 BELUSDT Amazing %120 Reaction!
I stopped adding to the list because it's kinda tiring to add 5-10 charts in every move but you can check my profile and see that it goes on..

Bitcoin Eyes $81,500 Resistance Following Trump's Tariff Pause. 🚨 **Market Update** 🚨
President Donald Trump has announced a 90-day pause on the full effect of new tariffs for certain countries, and the markets are reacting strongly! 📈 Both the stock and crypto markets are surging as a result.
Right now, **Bitcoin** is testing the $81,500 resistance level on the 1-hour timeframe. 💥 Our trading strategy: let it break the resistance and sustain above it, then look for a solid entry on the pullback.
Stay tuned and trade wisely! 🚀💰

Daily BITCOIN Bull Bear candles showing return of the Bulls ?I have used this chart often and have posted it here on a number of occasions with out the Bull Power Bear Power Histogram by CEYHUN active.
This is how the chart Looks when it is active.
This indicator calculates trading action to determine if a Candle is Bullish or Bearish and is VERY ACCURATE
And, Currently, Today's candle is GREEN, for the first time in a LONG TIME.
We can see how the candles have remained RED for most of the Drop in channel.
But now, while we sit on support on a Fib Speed Resistance Fan, we are GREEN.
Long Term, we can see that the climb back to current ATH could be tough. The VRVP on the right is clearly showing rising levels of resistance we climb higher.
Currently, we need to watch closely, to see that candle remain Green and that we do not loose support here.
I feel Bullish

Bitcoin and 50 SMA on a WEEKLY chart - UPDATE Following on from the sharp drop in the beginning of the week, where PA dropped Below the 50 SMA ( RED) , PA has recovered and, as you can see, the candle Body is currently sitting ON the 50 SMA
We may need to remain in this area to bring back the Bullish Sentiment and then move higher.
It can be said that a bullish sentiment remains with Bitcoin as its did NOT crash as sharply as Stock Markets.
We are also now waiting on the MACD to fully enter the "Bounce Zone"
The Weeks candle on the histogram has returned to RED and so some caution is required here, while we wait.
It is the next few days that are crucial now. The "Tariff" dust us settling and countries are reacting to Trumps Tariff impositions.
My Gut feeling is VERY positive right now.
But that is just me,
Watch that candle on the 50 SMA like a Hawk. If we loose that again and the week closes below, THEN we need to think carefully


$$$ BTCUSD MACRO-BULLISH $$$ 1W CHART $$$BITFINEX:BTCUSD 1W Chart
There are many reasons to look at this weekly chart and see that there's absolutely no reason to be bearish on Bitcoin yet.
Holding strong r/s flip support.
Holding regression trend.
Holding parabolic trend.
Stoch RSI at the bottom.
Weekly bullish divergence.
Assuming this plays out in a way that's similar to the last local bottom, the current target is around $134k-$135k.
It would take a lot to invalidate all of these bullish indicators, but if that does somehow happen, with a CLOSE of the weekly candle that invalidated these, then It's pretty much definitely over for a loooong time.
NFA blah blah blah..

Bitcoin Bullish Idea I'll be buying for that point of interest 78544.71 if I see confirmation for reversal. Though H8 zone 79100.20 looks valid too as the price has triggered it and rejects it awesomely.
My projection is this new week is going to be Bullish not just for Bitcoin but some other. Crypto pairs too.
I'm bullish on Eth as well.
Kindly boost if you find this insightful 🫴

A Closer Look at Bitcoin's Elliot Wave PatternHello friends, today we'll attempt to analyze the Bitcoin chart using Elliot Waves. Our approach will involve using Elliot Wave theory and structures, which involve multiple possibilities. The analysis we present here focuses on one potential scenario that seems possible to us.
Please note that this information is for educational purposes only and should not be considered trading advice or investment tips. There's a risk of being completely wrong, so never trade based solely on this post. We're not responsible for any profits or losses. Individuals should consult a financial advisor before making any trading or investment decisions.
Now, let's discuss the Bitcoin chart. On the daily chart, we can see that a black primary degree wave has completed its ((4th)) wave, and the ((5th)) wave has started. Within the fifth wave, an intermediate degree wave is unfolding, which will have its own set of waves (1), (2), (3), (4), (5). The primary black degree wave five will be complete once the intermediate degree wave is finished.
We've drawn accounts on the chart, illustrating the entire structure, including the nearest invalidation level at around $76,666 and the real invalidation level below $50,000.
I hope this analysis based on Elliot Wave theory has helped you understand the chart better and learn something new. Please keep in mind that this is for educational purposes only.
I am not Sebi registered analyst.
My studies are for educational purpose only.
Please Consult your financial advisor before trading or investing.
I am not responsible for any kinds of your profits and your losses.
Most investors treat trading as a hobby because they have a full-time job doing something else.
However, If you treat trading like a business, it will pay you like a business.
If you treat like a hobby, hobbies don't pay, they cost you...!
Hope this post is helpful to community
Thanks
RK💕
Disclaimer and Risk Warning.
The analysis and discussion provided on in.tradingview.com is intended for educational purposes only and should not be relied upon for trading decisions. RK_Charts is not an investment adviser and the information provided here should not be taken as professional investment advice. Before buying or selling any investments, securities, or precious metals, it is recommended that you conduct your own due diligence. RK_Charts does not share in your profits and will not take responsibility for any losses you may incur. So Please Consult your financial advisor before trading or investing.

BTCUSDTEntry price: 80580.9
SL: 80390.4
TP: 81139.4
Your reward must be at least 3 times greater than your risk.
As I always mention, your probability is 50%

Road to riches - paved with good intentions Order block 1 day timer has yet to fall to the previous buy zone
Order block 1 hour timer just hit the bottom of a buy zone and may reverse to 800 zone.
The 4 hour order block is half way thru a plunge of 3 buy zones
Once 1 hour recovers and higher ones do too.
But how much further will we drop?
Right now we entering a high order block buy zone that can drop to 400 or 500 zone.
Be careful trading lower time frames - we are still seeing turbulence.

#BITCOIN is making a right shoulder as we speak! Normally after a bullish divergence a higher low forms. It would form the bottom of this correction!

15-Min Bitcoin Setup – Quick Scalping Opportunity?First of all, I must say that this is a short-term analysis in a 15-minute time frame . Please be careful .
Let's take risks while respecting capital management. Be sure to respect capital management.
Bitcoin ( BINANCE:BTCUSDT ) is currently trading in the support zone($84,120_$81,500) , Potential Reversal Zone(PRZ) near the lower line of the ascending channel .
In terms of Elliott Wave theory , it seems that Bitcoin could complete its 5 bearish waves near the lower line of the ascending channel .
Also, we can see the Regular Divergence(RD+) between Consecutive Valleys .
I expect Bitcoin to be able to rise to at least $85,400.
Cumulative Short Liquidation Leverage: $86,397_$85,760
Cumulative Long Liquidation Leverage: $84,262_$83,336
Note: One of the reasons for Bitcoin's decline is the decline in US indices such as CME_MINI:NQ1! , SP:SPX , and TVC:DJI .
Note: If Bitcoin falls below $83,000, we can expect more dumps.
Please respect each other's ideas and express them politely if you agree or disagree.
Bitcoin Analyze (BTCUSDT), 15-minute time frame.
Be sure to follow the updated ideas.
Do not forget to put a Stop loss for your positions (For every position you want to open).
Please follow your strategy and updates; this is just my Idea, and I will gladly see your ideas in this post.
Please do not forget the ✅' like '✅ button 🙏😊 & Share it with your friends; thanks, and Trade safe.

Bitcoin Squeeze Point – Breakout or Breakdown?Bitcoin is approaching a key inflection zone where the Daily Downtrend Resistance and the Monthly Uptrend Support intersect. This confluence could be setting the stage for a major breakout or breakdown, and the next move could define BTC’s medium-term trend.
🧠 Key Levels to Watch:
Daily Downtrend Resistance (Red) – Price is testing this descending trendline again.
Monthly Uptrend Support (Green) – Strong support held since August 2024.
Fibonacci 0.5 Level (~79.3K) – Acting as mid-zone control point.
Fibonacci 0.618 Golden Zone (~72K) – Strong historical retracement support.
🟦 Bullish Scenario (Blue Arrow):
If BTC breaks above the daily downtrend and holds above the green uptrend line:
Possible target: 110K, aligning with the 1.0 Fibonacci extension.
Would confirm continuation of the larger bullish trend.
🔻 Bearish Scenario (Not drawn but implied):
If BTC breaks down below 79K and the monthly trendline:
Eyes on 72K for a potential bounce at the 0.618 Fib level.
Below that, potential deeper retracement toward the 65K–60K zone.
⏳ Conclusion:
BTC is sitting at a high-confluence zone. This is not the time to chase—wait for confirmation of breakout or breakdown before reacting.

Trading opportunity for Bitcoin BTCUSDT Based on technical factors there is a Buy position in :
📊 BTCUSDT
🔵 Buy Now
🪫Stop loss 85000.00
🔋Target 93000.00
📏 R/R 2,1
💸RISK : 1%
We hope it is profitable for you ❤️
Please support our activity with your likes👍 and comments📝

BTCUSDT - Low Time Frame Support Level I believe that BTCUSDT is at a critical level right now, and this blue box combined with the blue line is where we could see some price reaction. However, don't expect a major move, this is a low timeframe zone that might only give us smaller, more precise opportunities.
🔹 What To Watch For:
Reaction Potential: If the price touches this blue box and blue line, there may be a short-term reaction, but don't overestimate it.
Low Timeframe Focus: Keep an eye on the lower timeframes for breakouts or rejections around these areas.
Patience Is Key: This isn't a large move zone, so we will wait for confirmation before acting.
💡 Stay Smart: Always trade with confirmation. If the price moves fast and unexpectedly, we won't chase it. Stay in control, and wait for the right signals!
📌I keep my charts clean and simple because I believe clarity leads to better decisions.
📌My approach is built on years of experience and a solid track record. I don’t claim to know it all but I’m confident in my ability to spot high-probability setups.
📌If you would like to learn how to use the heatmap, cumulative volume delta and volume footprint techniques that I use below to determine very accurate demand regions, you can send me a private message. I help anyone who wants it completely free of charge.
🔑I have a long list of my proven technique below:
🎯 ZENUSDT.P: Patience & Profitability | %230 Reaction from the Sniper Entry
🐶 DOGEUSDT.P: Next Move
🎨 RENDERUSDT.P: Opportunity of the Month
💎 ETHUSDT.P: Where to Retrace
🟢 BNBUSDT.P: Potential Surge
📊 BTC Dominance: Reaction Zone
🌊 WAVESUSDT.P: Demand Zone Potential
🟣 UNIUSDT.P: Long-Term Trade
🔵 XRPUSDT.P: Entry Zones
🔗 LINKUSDT.P: Follow The River
📈 BTCUSDT.P: Two Key Demand Zones
🟩 POLUSDT: Bullish Momentum
🌟 PENDLEUSDT.P: Where Opportunity Meets Precision
🔥 BTCUSDT.P: Liquidation of Highly Leveraged Longs
🌊 SOLUSDT.P: SOL's Dip - Your Opportunity
🐸 1000PEPEUSDT.P: Prime Bounce Zone Unlocked
🚀 ETHUSDT.P: Set to Explode - Don't Miss This Game Changer
🤖 IQUSDT: Smart Plan
⚡️ PONDUSDT: A Trade Not Taken Is Better Than a Losing One
💼 STMXUSDT: 2 Buying Areas
🐢 TURBOUSDT: Buy Zones and Buyer Presence
🌍 ICPUSDT.P: Massive Upside Potential | Check the Trade Update For Seeing Results
🟠 IDEXUSDT: Spot Buy Area | %26 Profit if You Trade with MSB
📌 USUALUSDT: Buyers Are Active + %70 Profit in Total
🌟 FORTHUSDT: Sniper Entry +%26 Reaction
🐳 QKCUSDT: Sniper Entry +%57 Reaction
📊 BTC.D: Retest of Key Area Highly Likely
📊 XNOUSDT %80 Reaction with a Simple Blue Box!
📊 BELUSDT Amazing %120 Reaction!
I stopped adding to the list because it's kinda tiring to add 5-10 charts in every move but you can check my profile and see that it goes on..
BITCOIN Trending Higher - Can Bulls Maintain Momentum?COINBASE:BTCUSD is trading within a well-defined ascending channel, with price action consistently respecting both the upper and lower boundaries. The recent bullish momentum indicates that buyers are in control, suggesting a potential continuation toward higher levels.
The price has broken above a key resistance zone and successfully retested it as support, confirming the bullish structure. This retest strengthens the case for further upside, with the next target aligning with the upper boundary of the channel near $91,000.
As long as the price remains above this newly established support, the bullish outlook stays intact. However, if the price fails to hold above this zone, a deeper pullback toward the midline or the lower boundary of the channel could come into play.
Remember, always confirm your setups and trade with solid risk management.
Best of luck!

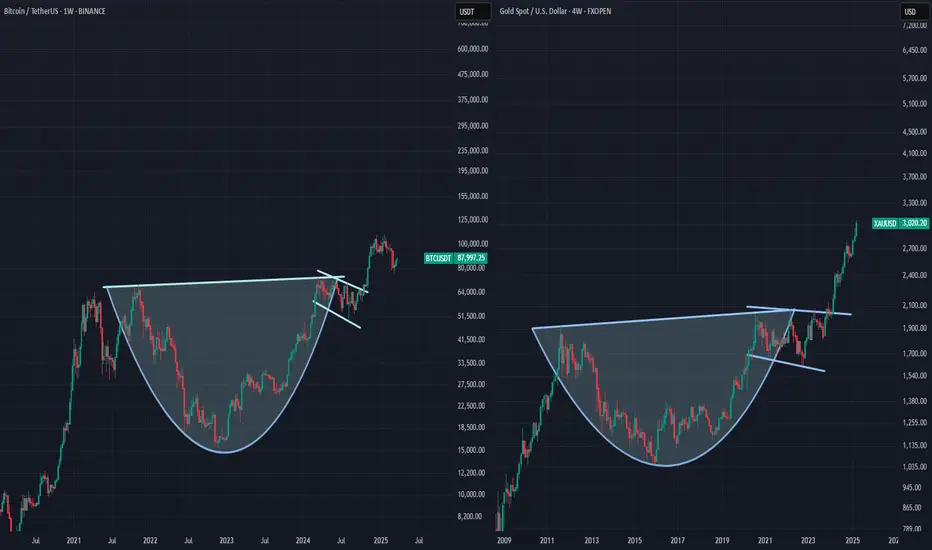
Bitcoin following Gold Bitcoin potentially following Gold's cup and handle breakout, price target for this is around $340k which I'm not saying will happen, but there's some nice market structure here for sure
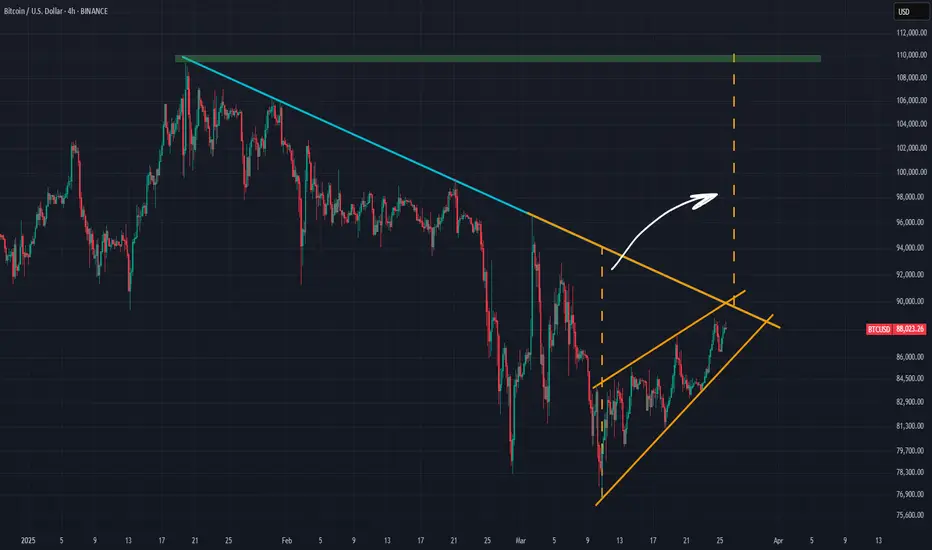
Bitcoin Breakout | Bullish Momentum Building Towards $98K+Key Observations:
Ascending Channel: BTC has been trading within an upward-sloping structure, confirming bullish momentum.
Retest Level: The price has pulled back to the trendline for a retest, a crucial confirmation point before potential upside continuation.
Target Projection: The expected breakout move suggests a 13.69% increase, targeting $97,467 - $98,630 levels.
Support Levels: Key supports are around $85,335 - $84,474, which could act as a safety zone if price rejects the breakout.
Trading Plan:
Bullish Bias: A successful retest and bullish confirmation could propel BTC to the $97,467 - $98,630 resistance zone.
Invalidation: A drop below the support zone near $84,474 may invalidate this bullish outlook.
Conclusion:
BTC/USD is displaying strong bullish potential, with a well-formed ascending structure and a possible breakout move. Traders should watch for confirmation of the trendline retest before entering long positions.

BTC/USDT (Bitcoin) LONG SET UPEntry Price 1: $84,000
Entry Price 2: $83,500
Stop Loss: $82,000
Take Profit 1: $86,000 (Close 25%)
Take Profit 2: $88,000 (Close 50%)
Take Profit 3: $90,000 (Close 75%)
Take Profit 4: $92,000 (Close 100%)
Status: ACTIVE

BTC/USDTBreakout may retest, waiting for a retest better. For target to reach, price action must remain above trend line and above breakout lvl > 85.6k
🎯 --> 91.5k
