BTCUSD \ BITCOIN Bitcoin turned bullish after the yesterday's FOMC.
The price broke and closed above a significant daily resistance.
I see a confirmed bullish reversal pattern now:
a cup & handle with a broken horizontal neckline.
Bitcoinlong

Bitcoin (BTC/USD) Technical Analysis & Trade Setup Market Structure & Key Levels:
The Bitcoin (BTC/USD) 4-hour chart displays a descending channel breakout, followed by a range-bound consolidation phase.
Key Support Levels:
$78,000 - $77,320: A strong demand zone where buyers have previously stepped in.
$80,000: Psychological support level.
Key Resistance Levels:
$84,340: Short-term resistance currently being tested.
$85,996: Next major resistance level.
$89,363: Target resistance level if a breakout occurs.
$92,331: A higher timeframe resistance level.
Chart Pattern & Price Action:
Descending Channel (Early March)
Price was in a downtrend, forming a descending channel pattern.
The breakout from this channel led to a shift in momentum.
Range Consolidation (Current Pattern)
After the breakout, BTC entered a sideways accumulation phase (marked by the red box).
Price is bouncing between $82,000 - $84,500, showing low volatility and indecision.
Breakout Possibility (Bullish Bias)
A break above $84,500 could confirm a bullish move towards $85,996 and beyond.
The next major target is $89,363, which aligns with previous resistance.
Support Retest (Bearish Risk)
If BTC fails to break resistance, we might see a retest of $80,000 or even $78,000.
A break below $77,320 would invalidate the bullish scenario.

BTCUSD LONG IDEALong Trade idea for BITCOIN looking at where price is coming from. Scale to your LTF of choice see if you could spot buy opportunities once price is in poi .. Drop a comment and tell me what you think..

BTCUSDT - Forecast for Today!My general opinion is that we will go back and forth in the intermediate zones until interest rate decision is announced and I'm bearish for now due to CDV. I have indicated the possible manipulations in these intermediate zones in the drawings on the chart.
Starting from the 4-hour point of control zone(indicated in the chart), I will start looking for short trends downwards and as usual, I will enter with confirmations in the low time frame.
I have a long list of my proven technique below:
🤖 IQUSDT: Smart Plan
🟠 IDEXUSDT: Spot Buy Area | %26 Profit if You Trade with MSB
📌 USUALUSDT: Buyers Are Active + %70 Profit in Total
🌟 FORTHUSDT: Sniper Entry +%26 Reaction
🐳 QKCUSDT: Sniper Entry +%57 Reaction

BTC → Bitcoin Retrace to $69,500? Or Bounce to $150,000?The short version, the probability that Bitcoin tests the breakout price around $69,500 is very high. That's simply the nature of breakouts; bulls take profits (sell orders) until the previous high is reached, at which point the bulls start buying again, and the bears take their profits (buy orders), driving the market up for another leg.
The question is, what is our next move as traders? Or even Bitcoin investors?
How do we trade this? 🤔
Let's zoom out to the Monthly chart. Bitcoin is resting on the 9EMA, a support area we've closed above it since September of 2023. Our current context is we've broken out of the 2021 cycle high of $69,500 and reached a new high just shy of $110,000. It's clear we're in pullback mode right now, so far-reaching down to $78,000.
Fundamentally, there aren't many catalysts for bullish activity. Bulls are simply taking profit at the first 6-figure Bitcoin price, which is both a psychological and technical price for selling. Monetary policy is still in a state of qualitative tightening, inflation has been slowly rising since September 2024, from 2.4% to 3%. Not a dramatic move, which certainly isn't helping Bitcoin move to the upside. Bitcoin seems to respond more to monetary policy than inflation rates and while the rates have steadily climbed, it's not enough to shock the market, while monetary policy has largely stayed the same.
Technical analysis shows TOTAL, TOTAL2, and TOTAL3 crypto market cap charts all were rejected at key resistance areas in early December. Bitcoin broke the 2021 right shoulder around $46,000 to $73,000, then had a measured move up to $109,000, about a 55% move each, give or take. We're simply in a state where we've reached a key resistance level after a breakout while the market as a whole is in a state of uncertainty. I believe that uncertainty will lead to a capitulation down to the high $ 60,000s, even if it's a quick wick. This would likely lead to a $1,500 ETH, $1.50 XRP, it may look ugly. But take a look at past cycles; a 30-40% pullback for Bitcoin is just another Thursday in the crypto market. The alts can pull back as much as 50%-60%.
I think we wait for the buy signal. Look for a pullback to the breakout area at $69,500, and wait for the market to tell us that we found the buy zone with a strong candle close on or near its high on the Daily chart, likely somewhere around $75,000. Then I believe $150,000 is the area for this cycle high based on the Lifetime Resistance and measured move target. The measured move shows a 57% move up after the breakout; if we take that 57% move up and stack it on the mid-price of the current trading range at $91,000, that takes us to right around $150,000. Anything beyond that is a bonus. I think from there, it makes a second attempt to breach the high, followed by our 12-18 month bear market as shown in the chart.
💡 Trade Idea 💡
Long Entry: $75,000
🟥 Stop Loss: $55,000
✅ Take Profit #1: $105,000
✅ Take Profit #2: $135,000
⚖️ Risk/Reward Ratio: 1:3
🔑 Key Takeaways 🔑
1. Breakout above 2021 Cycle High $69,500
2. Psychological and technical high of $100,000 reached
3. Pullback phase has been in motion since December, breakout zone is the buy target
4. Wait for a two-legged pullback toward the Monthly 30EMA (breakout zone), look for strong buy signal, large bull candle closing on or near its high.
5. RSI is near 64.00 and below the Moving Average. Wait for contact and a drop toward 60.00 in concurrence with the price action to enter.
💰 Trading Tip 💰
It's reasonable to take half profits at the first resistance target in a long trade, or the first support target in a short trade. Using a 1:1 Risk/Reward Ratio for your first target, you can move your stop loss up to your entry price, locking in profits. This allows you to watch the rest of the trade execute without worry of losing money. This helps improve trading psychology and the equity in your account.
⚠️ Risk Warning! ⚠️
Past performance is not necessarily indicative of future results. You are solely responsible for your trades. Trade at your own risk!
Like 👍 and Follow to learn more about:
1. Reading Price Action
2. Chart Analysis
3. Trade Management
4. Trading Psychology


BTC FOR SCALPERS AND DAY TRADERS *9400 POINTS **Guys pls like, share and follow my ideas
Entry price ,stoploss and Target already marked in the chart itself FYI.
Thank You All
ZIGZAG STRATEGY SIGNAL
GREEN ARROW INDICATES BUY
RED ARROW INDICATES SELL
STOP LOSS DONT RISK MORE THAN 2%
OF YOUR CAPITAL
BUY TARGET POINT 2900
SELL TARGET POINT 6500

BITCOIN GETTING READY FOR ANOTHER BIG RALLYBitcoin after huge fall again making TRIANGLE pattern also bearish FLAG
we can get 5000-10000 points strong rally on breakout side from this range
follow us for crypto free analysis calls daily

BTCUSD - If it is a Similar Situation to 2017If we are experiencing a similar run to 2017 we would be 847days into the bull run
I have shown the bars pattern for where price could go with the rest of the time left, which shows a 3500% gain this bull market. This is compared to the 2017 run which was a 9000% gain to the top.
We have some bull time left is the take away if the runs are comparable.
Weekly chart.

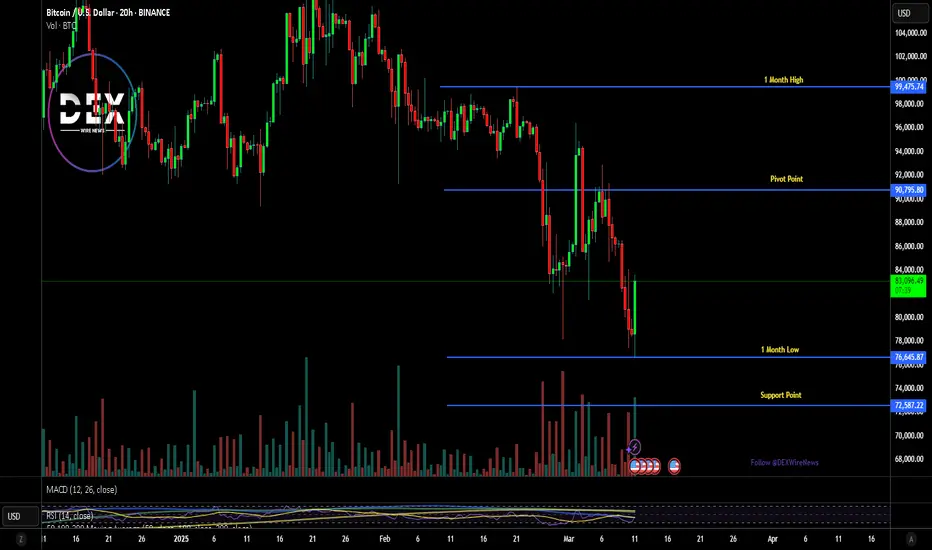
Breaking: Bitcoin Made a Comeback Surging 8%The world's first digital asset Bitcoin ( CRYPTOCAP:BTC ) shocked traders and investors alike as it surge 6% striking a comeback amidst the recent crypto bloodbath placing CRYPTOCAP:BTC in the FWB:83K zone with eyes set on the reclamation of the $100k Resistance.
Earlier on, we see Bitcoin retraced testing the $70k support point with many altcoins following suit. Should CRYPTOCAP:BTC break pass the $90k pivot point which is in lieu with the 38.2% Fibonacci point, a bullish campaign might evolved for CRYPTOCAP:BTC with odds set on the $120k zone.
Data from DefiLama shows industries and crypto projects are migrating to the Bitcoin blockchain network for scalability with about $5.414 Billion locked in Total Value Locked (TVL).
Bitcoin Price Live Data
The live Bitcoin price today is $83,341.47 USD with a 24-hour trading volume of $58,734,237,674 USD. Bitcoin is up 7.17% in the last 24 hours, with a live market cap of $1,653,114,998,100 USD. It has a circulating supply of 19,835,443 BTC coins and a max. supply of 21,000,000 BTC coins.
Get Ready To Buy BTCCOINBASE:BTCUSD is almost at buy zone
Target area is Daily Support, which also happens to bethe 61% fib level
If you're interested in altcoins, wait for BTC to reach level before buying anything

Bitcoin - The Path to a Quarter of a Million Bitcoin - What Happened After the End of the Bear Market
15,460 USD—this value marked the ultimate low of the bear market in hindsight. My previous forecast for a bottom formation was exceeded by approximately 15%. This was not due to a lack of expertise but rather because I rarely publish ideas. Looking back, the levels around 18,000 USD were an excellent opportunity for long-term entry and position accumulation. Since then, Bitcoin has surged by an impressive 350% (as of today).
Market Development After the Bear Market
Today, I will not delve into Bitcoin’s fundamental situation. First, because it has reached a level of complexity that is difficult to fully grasp, and second, because fundamentals are almost irrelevant to my technical analysis and forecasts.
The current price action suggests that we are nearing the completion of Wave 1, which serves as the launchpad for the larger Wave 3. It is important to note that the previous all-time high of 109,358.01 USD may be surpassed if the 161.8% Fibonacci retracement level is slightly above it. This means that, despite an initial sell-off, Bitcoin could still reach a maximum of 115,438.15 USD before a major correction begins.
However, if the previous all-time high already marked the end of Wave 1, then the price should retrace towards the 78.6% or even the 88.7% Fibonacci levels. Yes, this results in a broad range, but the goal is not to place a short trade—only to time a long trade effectively.
One thing is crystal clear: The next correction is imminent—or has already begun.
Outlook: Where Is the Next Profitable Long-Term Entry?
The art of investing lies in playing the long game and timing the market for optimal long positions. While dollar-cost averaging (DCA) is a solid strategy, it is particularly beneficial to invest larger tranches with careful planning.
Since my strategy is to hold Bitcoin for decades, I am looking for the next major buying opportunity.
Based on current market trends, I see two overlapping target zones for the upcoming correction:
🔹 Potential correction range: 35,774.30 - 58,928.75 USD
🔹 Key Fibonacci retracement level (61.8%) of Wave 1: 51,502.15 USD
I expect Bitcoin to correct at least to 51,502.15 USD. However, based on previous corrections and price structures, a deeper retracement is highly likely.
💡 My personal target zone for accumulating larger positions:
👉 35,774.30 - 51,502.15 USD
🚨 Bitcoin must not drop below 34,944.64 USD.
After the Correction: The Next Major Bullish Wave
Once the correction (Wave 2) finds its bottom between 34,944.64 - 51,502.15 USD, the market will be set for the explosive third wave of the larger Wave 3.
📈 Minimum price target for Wave 3: 160,000+ USD
📈 Further upside potential: Beyond 250,000 USD
Key Takeaway: Investing in Bitcoin is an investment in your future.
👉 Think long-term and minimize your risk.
Summary
1. Bear Market Recap
✅ Bear market bottom: 15,460 USD
✅ Forecast missed by ~15%
✅ 18,000 USD was a great long-term entry
✅ +350% price increase since then
2. Current Market Situation & Forecast
✅ Bitcoin is near the completion of Wave 1
✅ Possible breakout beyond all-time high (109,358.01 USD) to 115,438.15 USD
✅ A major correction is imminent—or has already begun
3. Ideal Long-Term Entry Points
✅ Target accumulation zone: 35,774.30 - 51,502.15 USD
✅ Expected correction at least to: 51,502.15 USD
✅ Absolute lower limit: 34,944.64 USD (must not be breached)
4. Long-Term Outlook
✅ Wave 3 to start after correction (Wave 2)
✅ Minimum target: 160,000 USD
✅ Potential long-term target: 250,000+ USD
✅ Investment strategy: Hold long-term & minimize risk

Bitcoin bullish moveFollow up on my last bitcoin post which hit my TP
Bitcoin will probably return to the resistance zone.
Stop loss: 80 K
Take profit: Around 95/96k

BTCUSDT Analysis – From Simple to Complex!BTCUSDT Analysis – From Simple to Complex! 🚀
“Let’s break it down step by step. At first glance, the first red line looks like an obvious resistance point. But here’s the deal—it’s too obvious. And in trading, when something is too obvious, it often doesn’t work as expected.”
Basic Structure:
📌 Red Line = Clear Resistance – Everyone sees it, but that also means it could be a trap.
Now, Let’s Get Deeper...
🔍 Volume Analysis Changes the Game:
Weekend Moves with Low Volume = High Manipulation Risk – Crypto loves to fake out retail traders in these conditions.
Look at the Black Line Inside the Blue Area – This is where things get interesting. This level could be the true battleground between buyers and sellers.
CDV & Volume Profile Will Guide Us – We need confirmation from buying and selling volumes before making any major moves.
Final Thoughts:
“At first, the chart looks simple, but once you add volume analysis, things get more complex. Don’t trade based on what looks obvious—trade based on what’s actually happening in the order flow. I’ll explain the next step in my following post!”
📉 Stay smart, stay ahead! 🔥
My approach is built on years of experience and a solid track record. I don’t claim to know it all, but I’m confident in my ability to spot high-probability setups.
If you would like to learn how to use the heatmap, cumulative volume delta and volume footprint techniques that I use below to determine very accurate demand regions, you can send me a private message. I help anyone who wants it completely free of charge.
I have a long list of my proven technique below:
AVAXUSDT Perfect Short Entry!
🎯 ZENUSDT.P: Patience & Profitability | %230 Reaction from the Sniper Entry
🐶 DOGEUSDT.P: Next Move
🎨 RENDERUSDT.P: Opportunity of the Month
💎 ETHUSDT.P: Where to Retrace
🟢 BNBUSDT.P: Potential Surge
📊 BTC Dominance: Reaction Zone
🌊 WAVESUSDT.P: Demand Zone Potential
🟣 UNIUSDT.P: Long-Term Trade
🔵 XRPUSDT.P: Entry Zones
🔗 LINKUSDT.P: Follow The River
📈 BTCUSDT.P: Two Key Demand Zones
🟩 POLUSDT: Bullish Momentum
🌟 PENDLEUSDT.P: Where Opportunity Meets Precision
🔥 BTCUSDT.P: Liquidation of Highly Leveraged Longs
🌊 SOLUSDT.P: SOL's Dip - Your Opportunity
🐸 1000PEPEUSDT.P: Prime Bounce Zone Unlocked
🚀 ETHUSDT.P: Set to Explode - Don't Miss This Game Changer
🤖 IQUSDT: Smart Plan
⚡️ PONDUSDT: A Trade Not Taken Is Better Than a Losing One
💼 STMXUSDT: 2 Buying Areas
🐢 TURBOUSDT: Buy Zones and Buyer Presence
🌍 ICPUSDT.P: Massive Upside Potential | Check the Trade Update For Seeing Results
🟠 IDEXUSDT: Spot Buy Area | %26 Profit if You Trade with MSB
📌 USUALUSDT: Buyers Are Active + %70 Profit in Total

march rally coming for bitcoin BTCUSD BTC!Bitcoin's price action is also influenced by broader financial cycles and patterns that are more subtle.
Here's a look at those:
General Financial Cycles:
Market Sentiment Cycles:
Like all financial markets, Bitcoin experiences cycles of fear and greed. These psychological waves drive price fluctuations, with periods of euphoria leading to overbought conditions and subsequent corrections.
These cycles are often amplified in the cryptocurrency market due to its 24/7 nature and the prevalence of social media.
Economic Cycles:
Bitcoin's performance can be influenced by macroeconomic trends, such as inflation, interest rates, and global economic growth.
In times of economic uncertainty, some investors may turn to Bitcoin as a hedge against traditional assets. Conversely, during periods of strong economic growth, capital may flow into more traditional investments.
Adoption Cycles:
Bitcoin's adoption by individuals and institutions follows a pattern of gradual growth, punctuated by periods of rapid acceleration.
As adoption increases, liquidity improves, and the market becomes more mature, which can influence price volatility and long-term trends.
"Secret" or Less Obvious Bitcoin Cycles:
On-Chain Data Cycles:
Analysis of Bitcoin's blockchain data reveals patterns in investor behavior, such as accumulation and distribution phases.
Metrics like:
Hodl waves: which track the age of bitcoin held in wallets.
Entity adjusted dormancy: which shows when older coins are being moved.
These can give indications of underlying cycle activity.
Liquidity Cycles:
The flow of liquidity into and out of the Bitcoin market can create its own cycles.
Periods of high liquidity can fuel price increases, while periods of low liquidity can exacerbate price declines.
The availability of stablecoins, and the actions of large market makers, effect these cycles.
Technological Adoption Cycles:
The development and adoption of layer 2 solutions, and other technological improvements to the bitcoin network, can create their own cyclical impacts on the bitcoin price.
These cycles are less predictable, but can have profound long term effects.
It's important to understand that these cycles are interconnected and can overlap, making it challenging to isolate their individual effects. Additionally, the cryptocurrency market is still relatively young, and its cycles may evolve over time.

BITCOIN IDEA
After retest price FVG and level 70 of FIBO and liqudity taken of 2 previous weekly low we will see a reversal to taken liqudity buyside at 109312

Bitcoin's Never Look Back AnalysisWhat's Bitcoin's never look back number?
What's that level that you want to stack your sats and always be in profit?
This analysis observes a distinct repeating pattern over everything BTC cycle that if continues to occur could be very effective in informing your investment position.

BTC bullishbtc can be bullish
we can buy with targets till the above horizontal lines.
the horizontal lines are range calculations for the current day in BTC.
SL can be put below breakout candle of horizontal lines.

Bitcoin Breaks 90k with upward bounce on Daily FVG and 200MABitcoin Breaks 90k with bounce on Daily FVG and 200MA.
The FMG "Fair Value Gap" is a big deal, especially this one on the daily.
The 4h and 2h and 45min charts are looking like this could continue.
It's a powerful moment, and maybe 80k will never been seen again?
This is more bullish than I have felt in a few days.

Bitcoin Holds Strong Above 200MA – Is the Next Rally Incoming?Bitcoin has successfully defended the $84K-$86K support zone, with the CME gap now fully closed. On the daily timeframe, BTC remains above the 200MA, signaling strong bullish momentum. With macroeconomic factors aligning in favor of crypto, this could be the start of another leg higher.
Technical Analysis:
• Support Zone: $84K - $86K held firm, preventing further downside.
• CME Gap Closure: The retracement completed the necessary gap-fill, eliminating inefficiencies.
• Trend Reversal Signal: BTC has reclaimed the 200MA on the daily chart, reinforcing bullish sentiment.
• Breakout Watch: Price is approaching a descending trendline, a breakout above could trigger a strong move toward the $110K target.
Fundamental Analysis:
• Bitcoin ETF Impact: Institutional demand continues to grow with ETF adoption.
• Macroeconomic Tailwinds: The Fed’s expected slowdown in rate hikes is a net positive for risk assets like BTC.
• Geopolitical Factors: Increased demand for BTC as a hedge against economic instability and inflation.
• Regulatory Developments: A more constructive approach from regulators supports long-term adoption.
With bullish momentum building, Bitcoin is at a key inflection point. Will it break out and push towards new highs? Stay tuned and trade wisely!
Note: Please remember to adjust this trade idea according to your individual trading conditions, including position size, broker-specific price variations, and any relevant external factors. Every trader’s situation is unique, so it’s crucial to tailor your approach to your own risk tolerance and market environment.

Bitcoin long that will go in profit in few hoursI tried a Bitcoin long setup that will go in profit in few hours. let's see if it works.
entry 89961
target profit 94000
stoploss 88500

Bitcoin Longif you want to trade Bitcoin here's my trade:
entry price: 88000
stoploss: 78000
target profit 138k or 200k or higher

BTC at a Critical Crossroad: One More High to $130K?BTC: The price remains in a larger correction that began in December. While I still view one more high in this cycle as ideal—potentially targeting $130,000—the minimum requirements for completing a larger 5-wave pattern from the November 2022 lows have already been met. Any additional high would be more of a bonus than a necessity.
A break below $69,140 would provide further confirmation that a substantial top has formed, aligning with the red scenario. For now, $69,140 serves as the key bull/bear pivot, helping us distinguish between the possibility of one more high and the onset of a larger correction or even a potential bear market.
Regardless, I am closely monitoring the current price region for signs of an upside reversal. Even if this only results in red wave B, it could still push the price into the $92,000–$104,100 range.
