#BTC 72800 $ Confirmed. ..#BTC 72800 $ Confirmed. ..
Watch My Previous Analysis For #BTC..
And All ALTS Exit Pump Series..
Bitcoinlong

Bitcoin About To Go ParabolicMartyBoots here , I have been trading for 17 years and sharing my thoughts on the crypto market.
This videos shows how Bitcoin can go parabolic and we need to watch very carefully over the next week or 2 .
For more information or any questions just send me a message
MartyBoots

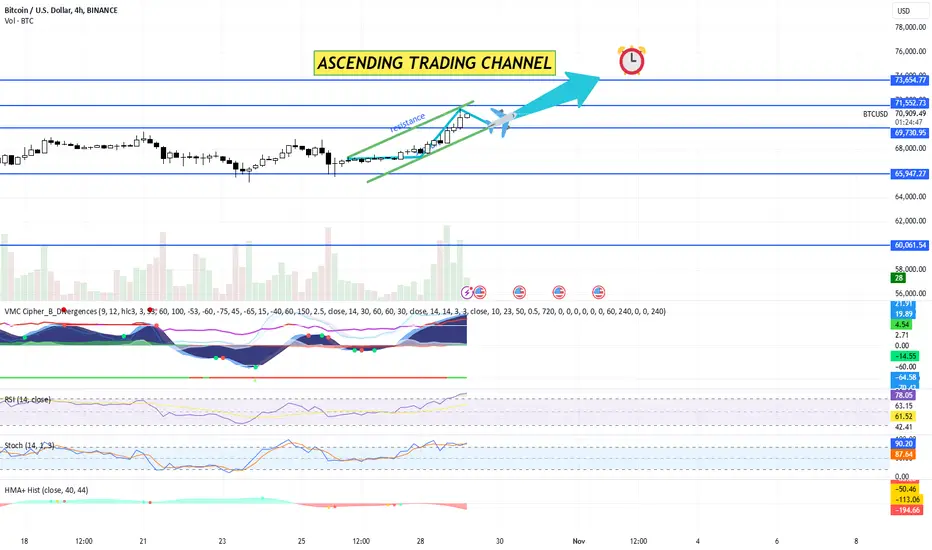
BITCOIN TODAY - STILL THE KING OF THE CEREMONY (TA+TRADE PLAN)Price Levels and Resistance Zones:
The chart shows several key resistance and support levels marked by blue horizontal lines.
Major Resistance Levels:
$73,654.77
$71,552.73
$69,730.95
Support Levels:
$65,947.27
$60,061.54
$52,774.45
Bitcoin is currently trending upward, with price action near $70,734.95, approaching the resistance zone at $71,552.73.
VMC Cipher B Divergences:
The VMC Cipher B indicator shows bullish momentum with green dots, signaling possible upward continuation.
The RSI and Stochastic lines are also above mid-levels, suggesting continued bullish momentum.
RSI (Relative Strength Index):
RSI (14, close) is at 77.25, indicating overbought conditions. This could mean a possible retracement or consolidation in the short term. However, a strong uptrend may continue if Bitcoin maintains support levels above 70.
Stochastic Oscillator:
Stochastic (14, 1, 3) is also at a high level, around 86.19, indicating overbought conditions. This aligns with the RSI and could signal a need for caution on long positions until the oscillator moves back to a neutral or oversold region.
HMA+ Histogram:
The histogram indicates some bullish divergence, but recent bars are turning red, signaling a potential pullback or pause in momentum. Monitoring this for further bearish signs is essential, especially if it crosses below zero.
Trading Plan
Short-Term Strategy:
Entry: Consider entering a long position on a pullback to support around $69,730.95 if bullish signals persist.
Stop-Loss: Place a stop-loss below the $65,947.27 support level to limit potential downside risk.
Take-Profit: Target $71,552.73 as the primary take-profit level. If momentum remains strong and BTC breaks above $71,552.73, consider holding for $73,654.77.
Medium-Term Strategy:
Entry: Buy on confirmation of a breakout above $71,552.73 with strong volume.
Stop-Loss: A stop-loss slightly below the breakout level at $69,730.95.
Take-Profit: Set a take-profit target around $73,654.77. If Bitcoin breaches this, reassess the position for potential gains towards higher levels.
Risk Management:
Position Sizing: Risk no more than 1-2% of the trading account on each trade.
Trailing Stop: Implement a trailing stop if Bitcoin strongly surpasses $71,552.73, to lock in gains while allowing for additional upside.
Monitoring Indicators:
Keep an eye on RSI and Stochastic Oscillator for any signs of bearish divergence or weakening momentum.
Monitor VMC Cipher B for any shift in green dots to red, which could indicate potential retracement.
Overall Market Sentiment:
Given the current uptrend and approach to resistance, Bitcoin shows bullish sentiment. However, indicators suggest overbought conditions, so caution is advised.
Bitcoin Prints the First Golden Cross in Almost Exactly One YearWe'll have to see if it sticks but BTC has just printed a golden cross. The crazy thing is, the last golden cross occurred on October 29th 2023! This golden cross was 2 days short of exactly hitting the 1 year mark. We all know what happened after the last golden cross, over the next 4.5 months the price increased by over 116%.
If you take the time to study Bitcoin's price history, it is very clear that Bitcoin has been running in 4-year market cycles. This is especially true for the last two market cycles. From bear market bottom to the next bear market bottom, the 2015 to 2018 market cycle was 1432 days in length, and the length of the 2018 to 2022 market cycle was 1438 days. Even the elapsed times between events (bottom to halving, halving to peak, and peak to bottom) during each of these cycles is very consistent.
Obviously, this market cycle trend doesn't have to continue, but I believe that it will, at least for this cycle. If that is the case then I wouldn't expect the post halving bull market to begin until late October or November of this year. Looking back at the previous two cycles, the 2016 bull market started 259 days after the halving, and the 2020 bull market started 149 days after the halving. We are now 192 days past the halving that occurred on April 19th.
There is always a chance that I am totally wrong and the peak in March was the peak for this market cycle and it will be all down hill from here. But, I believe the probability of that is very low. But this is just how I am approaching this market cycle, every investor needs to do their own research and make their own decisions. I also make my decisions based on my long-term view and long time horizon.

BITCOIN TARGETS 70000$ - BTC BULLISH MOMENTUM IS RISINGBitcoin recently broke and closed above the massive diagonal trendline that had been driving the weekly bearish trend since March 2024. This weekly breakout and close above the trendline gives me strong confidence that a bullish weekly momentum has begun.
After the breakout, Bitcoin retraced into the weekly demand zone and showed a strong rejection.
During this retracement, it also ran the daily swing liquidity and attempted to close below for six consecutive days. However, buyers defended the daily swing level strongly. This indicates that Bitcoin is likely aiming higher, with the first target set at $70,000.
Other targets can be seen on the chart as well, and I’ll be watching these levels, ultimately aiming for an all-time high.
I’m feeling quite bullish about the crypto market at the moment.

Bitcoin will obliterate the 69k markCRYPTOCAP:BTC will obliterate the 69k mark ‼️
Buy as much as you can

Bitcoin Surge Continues! TP 3 Hit, Eyeing TP 4 Next!BITCOIN (BTCUSDT) 4H time frame Technical Analysis:
Bitcoin (BTCUSDT) on the 4-hour timeframe shows a solid long trade with momentum intact. Price action has followed the upward curve supported by the Risological dotted trendline, providing a strong bullish foundation for the current rally.
Key Levels:
Entry: 61,732.3
Stop Loss (SL): 60,316.2
Target 1 (TP1): 63,482.7 ✅ (Hit!)
Target 2 (TP2): 66,315.0 ✅ (Hit!)
Target 3 (TP3): 69,147.4 ✅ (Hit!)
Target 4 (TP4): 70,897.7
Observations :
Bitcoin has already smashed through TP3, riding the wave of bullish momentum.
The Risological dotted trendline is acting as strong support, indicating that TP4 is highly within reach.
With TP3 completed, Bitcoin continues its bullish momentum. Keep an eye on the final resistance at TP4, as the price is showing no signs of slowing down!

BTC/USD "BITCOIN" Market Money Heist Plan on Bullish Side.Bonjour! My Dear Robbers / Money Makers & Losers, 🤑 💰
This is our master plan to Heist BTC/USD "BITCOIN" Market based on Thief Trading style Technical Analysis.. kindly please follow the plan I have mentioned in the chart focus on Long entry. Our target is Red Zone that is High risk Dangerous level, market is overbought / Consolidation / Trend Reversal / Trap at the level Bearish Robbers / Traders gain the strength. Be safe and be careful and Be rich.
Entry : Can be taken Anywhere, What I suggest you to Place Buy Limit Orders in 15mins Timeframe Recent / Nearest Swing Low
Stop Loss 🛑 : Recent Swing Low using 4H timeframe
Attention for Scalpers : If you've got a lot of money you can get out right away otherwise you can join with a swing trade robbers and continue the heist plan, Use Trailing SL to protect our money 💰.
Warning : Fundamental Analysis news 📰 🗞️ comes against our robbery plan. our plan will be ruined smash the Stop Loss. Don't Enter the market at the news update.
Loot and escape on the target 🎯 Swing Traders Plz Book the partial sum of money and wait for next breakout of dynamic level / Order block, Once it is cleared we can continue our heist plan to next new target.
Support our Robbery plan we can easily make money & take money 💰💵 Follow, Like & Share with your friends and Lovers. Make our Robbery Team Very Strong Join Ur hands with US. Loot Everything in this market everyday make money easily with Thief Trading Style.
Stay tuned with me and see you again with another Heist Plan..... 🫂

bitcoinhi guys
this is a long term idea for BTC
by fib bitcoin always reached 2.272
is it possible we see bitcoin price at $461k in the next few years?

Bitcoin Futures Hit $40.5B—Big Move Coming? #BTCBitcoin is primed for a big breakout as open interest in BTC futures just hit an all-time high of $40.5 billion! This shows that the smart money is piling in, and volatility is about to spike. 📊
Key Trends to Watch:
Institutional Interest Growing: CME leads the futures market with 30.7% of total open interest, followed by Binance. Institutions are making their moves, and you should too. 💼
Support at $69,000: BTC tested the $69K resistance but couldn't break through. Will it take a 2nd attempt? Many analysts say $70K+ is in play once this level cracks.
On-Chain Signals: Bitcoin supply on exchanges is at a 5-year low, signaling fewer sellers and potential upward pressure. 🛑
Key Catalysts Ahead:
U.S. Election Optimism 🗳️ —Markets love clarity, and any positive news could give Bitcoin the push it needs.
ETF Momentum 📈 —Spot BTC ETFs are seeing major inflows, hinting at increased demand from institutional investors.
Potential Scenarios:
🚀 Break above $70K: We could see a rapid run toward $75K.
📉 If rejected, strong support sits around $63K, so this could be a good pullback opportunity.
What are your next moves? Follow closely, because volatility is knocking! 📉📈

History is being made and people don't seem to care In the past week we've seen CRYPTOCAP:BTC amazing performance defying all the odds ( not mine obviously) and recovering what seemed to be a historical crash
Now we are seeing history being made Bitcoin will certainly make a new higher high surpassing the 74k level
It's just a matter of time, and it will be explosive (huge candles)

#Bitcoin elliot wave 5 #Bitcoin elliot wave 5 will turn into a mega bull wave that will leave CRYPTOCAP:BTC bears in the dust

Critical Moment for $BTC: Last Chance for Entry or Path to Doom?Massive Level for CRYPTOCAP:BTC
As things stand, we’re at a crucial point for a higher low and a complete validation of the weekly bearish BMS. We need some demand to step up in the 56-60k region to propel us to "Valhalla" and set the stage for a strong end to the year.
Be aware that if we drop below 58k, it could pose significant risks for a bullish outlook. This is the moment to act and take a stand at these prices!
Keep your bids around the mid-59k range in case it dips that low. The trade is active and rolling!

Is Bitcoin's Breakout from Accumulation Channel a Sign of FurtheBitcoin, the world's largest cryptocurrency, has recently surged past the $68,000 mark, setting a new local high and confirming its bullish uptrend. This significant breakout has ignited excitement among analysts and investors, who are closely monitoring the cryptocurrency's next moves. As Bitcoin continues its ascent, many are speculating about the potential for further gains and the factors driving this momentum.
One of the key factors contributing to Bitcoin's recent price surge is its breakout from a long-term accumulation channel. This technical pattern, which has persisted for over seven months, indicates a period of consolidation and accumulation before a potential price increase. By breaking out of this channel, Bitcoin has signaled a shift in market sentiment and a renewed bullish momentum.
Analysts and experts are closely examining various indicators to gauge the strength of Bitcoin's uptrend and identify potential resistance levels. The Relative Strength Index (RSI), a momentum oscillator, is currently hovering near overbought levels, suggesting that a short-term pullback may be necessary to consolidate gains before further upward movement. However, the overall trend remains bullish, and a break above the previous all-time high of $69,000 could signal a more extended rally.
In addition to technical analysis, fundamental factors are also playing a role in Bitcoin's price appreciation. The growing adoption of cryptocurrencies by institutional investors and corporations is driving demand for Bitcoin as a store of value and a hedge against inflation. Moreover, the increasing use of Bitcoin for payments and remittances is contributing to its mainstream acceptance.
However, it is essential to approach the current Bitcoin rally with caution. The cryptocurrency market is highly volatile, and prices can experience significant fluctuations. While the long-term outlook for Bitcoin remains positive, short-term corrections are a common occurrence. Investors should be prepared for potential pullbacks and have a well-defined risk management strategy in place.
As Bitcoin continues its upward trajectory, several key factors will likely influence its future price movement. The regulatory landscape, particularly in the United States, will play a crucial role. Favorable regulatory developments could further fuel Bitcoin's adoption and price appreciation. Additionally, the macroeconomic environment, including interest rates and inflation, will also impact investor sentiment towards risk assets like Bitcoin.
Furthermore, the competition from other cryptocurrencies cannot be overlooked. While Bitcoin currently dominates the market, the emergence of new and innovative projects could potentially challenge its position. The development of scalable blockchain solutions and the introduction of new use cases for cryptocurrencies could impact Bitcoin's market share.
In conclusion, Bitcoin's recent breakout from a long-term accumulation channel has ignited excitement and speculation about its potential for further gains. While the overall trend remains bullish, investors should approach the current rally with caution and be mindful of potential risks. By carefully considering technical analysis, fundamental factors, and the competitive landscape, investors can make informed decisions about their Bitcoin investments.

bitcoin mega bull loading!“Satoshi's Vision Shapes #Bitcoin 's Circular Journey”
The MEGA BULL phase, the most impressive part of the bull run process of CRYPTOCAP:BTC cycles, is loading!

BITCOIN FRACTAL - 70K WILL BE A BRICK WALLHi,
I'm sharing this fractal with you guys because it's my birthday month so am sharing something i made long ago. CRYPTOCAP:BTC is very close to my heart because it held me to chase my dreams.
This fractal is clean with lot's of pain to the leverage participants because we are going to see some high volatile moves around 100k-120k. Anyone who has bought below 60k is going to rule this move. I have been long since 57k.
$70,000 once taken out it's going to be a brick wall.
7 months consolidation is not going to be a penny move. CRYPTOCAP:BTC
LET'S WAIT AND SEE!

Bitcoin Quarterly Open Pullback Long TradeSomething like this if the level I marked for trend continuation fails to hold, will see a lot of longs capitulating and shorts building with anticipation of retesting the diagonal resistance we broke out of especially on a brief loss of the quarterly open. Reclaim the quarterly open and you're good to enter whilst shorts will remain trapped from quarterly open imo.

Q4 2024 is the start of $BTC Mega Bull Season!#Bitcoin major corrections are behind us.
#BTC we are at the beginning of the mega bull phase and the movements will get tougher with 2025 Q1!

YOU ARE NOT OPTIMISTIC ENOUGH FOR $BTCAs long as #Bitcoin remains above 61.3K, harsh movements are inevitable and will continue to move towards new ATHs.

Is Bitcoin's Golden Cross Signaling Parabolic Moves Ahead?Disclaimer: This article is for informational purposes only and should not be construed as financial advice. Investing in cryptocurrencies is highly volatile and speculative, and it is essential to conduct thorough research before making any investment decisions.
Bitcoin (BTC), the pioneering cryptocurrency, has exhibited a remarkable surge in recent days, forming a bullish technical pattern known as a golden cross. This development has fueled optimism among analysts, who are predicting parabolic price movements shortly.
Bitcoin's price has consistently climbed over the past three days, reaching its highest point since July 29th. This robust uptrend has propelled the cryptocurrency to retest the psychologically significant level of $68,000, marking a substantial increase of nearly 40% from its August low.
The Golden Cross: A Bullish Signal
The formation of a golden cross occurs when a short-term moving average (SMA) crosses above a long-term SMA. This technical pattern is widely regarded as a bullish signal, suggesting that the underlying asset is experiencing a reversal from a downtrend to an uptrend.
In Bitcoin's case, the golden cross was formed when the 50-day SMA crossed above the 200-day SMA. This indicates that the cryptocurrency's short-term momentum has turned positive, potentially signaling a sustained uptrend.
Analysts Forecast Parabolic Moves
Encouraged by the golden cross and Bitcoin's recent price performance, analysts are expressing bullish sentiment and predicting parabolic price movements. Parabolic moves refer to rapid and exponential price increases, often characterized by a steep upward curve.
Several factors are contributing to this optimistic outlook:
• Institutional Adoption: The growing interest and adoption of Bitcoin by institutional investors, such as corporations and hedge funds, are seen as a significant catalyst for price appreciation.
• Macroeconomic Factors: The ongoing uncertainty surrounding global economic conditions and inflationary pressures is driving investors towards safe-haven assets like Bitcoin.
• Technical Indicators: In addition to the golden cross, other technical indicators, such as the Relative Strength Index (RSI) and Moving Average Convergence Divergence (MACD), are also signaling bullish momentum.
Breaking Above the Falling Wedge
Bitcoin's price action has also been supported by a breakout above a descending falling wedge pattern on the daily chart. This technical formation suggests that a bullish reversal is underway, further bolstering the case for higher prices.
However, it's important to note that while Bitcoin has reached a new high, it has yet to close a daily candle above the resistance level of the falling wedge. A successful close above this level would confirm the breakout and increase the likelihood of further upward movement.
Conclusion
The formation of a golden cross and the breakout above a falling wedge pattern have ignited bullish sentiment surrounding Bitcoin. Analysts are predicting parabolic price movements as institutional adoption, macroeconomic factors, and technical indicators all point towards a sustained uptrend.
While the cryptocurrency's future remains uncertain, the current technical landscape suggests that Bitcoin is well-positioned for a significant price increase. However, it's crucial to approach investing in cryptocurrencies with caution and be aware of the inherent risks involved.

Bitcoin could go parabolic very soon!Hello Tradingview community!
As always: If this pattern I'm showcasing doesn't work as predicted..
then please don't come crying to me (ty) -> NFA DYOR
I got 2 scenarios that's considered BULLISH clearly..
Yellow line: Breakout now and retest the channel for higher prices later on
White line: Have some corrective price action now and breakout a bit later
Always a chance none of these scenarios works.. But we shall see!
BOOST and follow for more charts
NFA DYOR <----

Bitcoin to new all time high Bitcoin daily chart closed above the 67k
I'm now 14% ROI in this trade that started September 1st and 30% ROin total (2 trades)
Next week will be huge we will see a new all time high

Will the all-time high in open interest support Bitcoin's rally?Macro theme:
- Bitcoin jumped over 5% yesterday, following a positive trend across the crypto market. This has fuelled investor optimism for further gains in the coming months. Improved market sentiment, global stock rallies, and limited negative news from Middle East tensions have supported the rise of bitcoin.
- Additionally, open interest in Bitcoin futures and perpetual surged by about 33,000 bitcoin last week, reaching an all-time high in USD terms, according to ETC Group. These factors strengthen the case for a continued rally through "Uptober."
Technical theme:
- BTCUSD is around its resistance at 68340, confluence with the descending trendline. The price is trading above both EMAs, indicating a solid bullish momentum.
- If BTCUSD extends its rally above 68340, it may retest the nearby key resistance area 71400-73000.
- Meanwhile, BTCUSD may retrace to test its support area at 62800-64400 before resuming its upward movement.
Analysis by: Dat Tong, Senior Financial Markets Strategist at Exness
