Bitwise Bitcoin ETF | BITB | Long at $46.25It definitely should get everyone's attention when a US Senator (David McCormick) is willing to dish out up to $600,000 in a Bitcoin ETF ( AMEX:BITB ):
Feb. 27: Bought $50,000 to $100,000
Feb. 28: Bought $15,000 to $50,000
March 3: Bought $50,000 to $100,000
March 5: Bought $15,000 to $50,000
March 10: Bought $50,000 to $100,000
March 11: Bought $15,000 to $50,000
March 13: Bought $15,000 to $50,000
March 20: Bought $50,000 to $100,000
Something may be brewing this year with the "U.S. crypto reserve" and I'll throw down a couple grand at $46.25 with a self-proclaimed wild prediction into 2026: Bitcoin to $120,000.
Bitwise ETF Targets:
$50.00
$55.00
$60.00
$65.00
Bitcoinlong

BITCOIN ON THE MORNINGAfter a long period of ups and downs that felt like an endless journey, my favorite formation has finally appeared the 'Cup and Handle.'
I just love it a perfect setup that gets the engines ready for a long flight toward 120.
After testing the low to high range and multiple rejections at the 103 level, all that’s needed now is a push from the giants to break the resistance — and from there, the sky’s the limit.
If you're looking for practical steps, here you go:
Entry: 100K
Breakout: 103K
First take profit: 110K
Final target: 120K
Safe travel this will be an exciting and especially fun journey.
Of course, nothing mentioned here is financial advice just my personal opinion!!!

BTC Strength Alert: Key Levels, Fibonacci & VolatilityBitcoin (BTCUSD) Strength Alert: Key Levels, Fibonacci & Volatility Point to Entry Opportunities
Bitcoin (BTCUSD) Technical Analysis: Navigating Strength and Volatility
Bitcoin (BTCUSD) continues to capture the attention of the global financial markets, demonstrating notable resilience and underlying strength. The current market structure suggests a period where bulls are actively defending key price thresholds, creating a fascinating technical landscape. This analysis will provide an in-depth examination of BTCUSD, focusing on its price action relative to significant psychological levels, the supportive role of Fibonacci retracements, characteristic volatility patterns, and strategic entry considerations based on bullish candlestick formations.
1. Introduction to Bitcoin and the BTCUSD Pair
Bitcoin, introduced in 2009, stands as the progenitor of cryptocurrencies, operating on a decentralized peer-to-peer network secured by cryptographic principles and recorded on a public distributed ledger known as the blockchain. It was designed as a digital alternative to traditional fiat currencies, free from central bank control. The BTCUSD pair represents the exchange rate between Bitcoin and the United States Dollar, making it one of the most liquid and heavily traded instruments in the digital asset space. Its price movements are a barometer for the broader cryptocurrency market sentiment and are influenced by a myriad of factors including adoption trends, regulatory news, macroeconomic developments, and technological advancements within the Bitcoin network itself. Understanding the technical dynamics of BTCUSD is crucial for traders, investors, and market analysts seeking to navigate its often-turbulent price swings.
2. Current Market Sentiment and Price Action: Holding Above Key Psychological Levels
A significant observation in the current BTCUSD market is its ability to maintain its footing above a key psychological price level. Such levels, often round numbers (e.g., $50,000, $60,000, or in this context, a hypothetical significant level like $100,000 if we assume a major bull run has occurred), act as important mental benchmarks for market participants. When price successfully breaks above such a level and subsequently holds it as support, it can signal a powerful shift in market sentiment. This behavior suggests that buyers are willing to step in and defend this new valuation, absorbing selling pressure and preventing a swift retracement.
The act of holding above a major psychological level often has a self-fulfilling prophecy component. As traders and algorithms identify this level as critical, buy orders tend to cluster around it, reinforcing its strength as a support zone. Conversely, if the price were to decisively break below such a level after holding above it, it could trigger a cascade of stop-loss orders and a rapid decline, indicating that the previous bullish conviction has waned. The current strength shown by Bitcoin in maintaining its position above such a noted psychological threshold is therefore a bullish indicator, suggesting underlying demand and a positive short-to-medium-term outlook, provided this support continues to hold. This resilience can build confidence among market participants, potentially attracting further capital inflow.
3. Fibonacci Retracement Analysis: Identifying Strong Support
Fibonacci retracement levels are a cornerstone of technical analysis, employed to identify potential areas of support and resistance. Derived from the Fibonacci sequence – a series of numbers where each number is the sum of the two preceding ones (0, 1, 1, 2, 3, 5, 8, 13, etc.) – the key retracement levels are 23.6%, 38.2%, 50%, 61.8%, and 78.6%. These percentages are applied to a prior price swing (from a significant low to a significant high in an uptrend, or vice-versa in a downtrend) to project areas where the price might pull back before resuming the primary trend.
The observation that Fibonacci retracement levels suggest strong support at current BTCUSD levels is particularly pertinent. When the market is in an uptrend and experiences a corrective pullback, traders watch these Fibonacci levels closely. The 38.2%, 50%, and 61.8% levels are often considered the most significant. A retracement to, and subsequent bounce from, one of these levels indicates that the correction is likely a healthy pause within a larger bullish trend, rather than a reversal.
If BTCUSD is currently finding support near a critical Fibonacci level, it implies that the preceding upward momentum was strong, and the current consolidation or minor pullback is being met with buying interest at a mathematically significant point. For example, if Bitcoin recently rallied from point A (low) to point B (high), and has now retraced to the 61.8% level of that rally and is holding, it's a classic sign that bulls are re-entering the market, viewing the pullback as a discounted buying opportunity. The confluence of a psychological level with a Fibonacci support level would create an even more potent support zone, significantly increasing the probability of a price bounce. Traders often look for candlestick confirmation at these Fibonacci levels before committing to a position.
4. Volatility Analysis: US Evening and Asian Morning Hours
Volatility is an inherent characteristic of Bitcoin, representing the degree of variation of its trading price series over time. The observation that BTCUSD volatility tends to increase during US evening and Asian morning hours is a valuable insight for strategic trade timing. This period typically corresponds to the overlap between the closing of the New York trading session and the opening of major Asian financial centers like Tokyo, Hong Kong, and Singapore.
Several factors contribute to this heightened volatility:
Market Overlap and Liquidity Shifts: As one major market winds down and another ramps up, there can be shifts in liquidity. The initial hours of the Asian session often bring fresh news, order flows, and participants, leading to price discovery and increased trading activity.
News Dissemination: Significant economic data releases, corporate earnings (for Bitcoin-related companies), or crypto-specific news from either the US (late announcements) or Asia can occur during these hours, directly impacting BTCUSD prices.
Algorithmic Trading: Many trading algorithms are programmed to react to specific inter-market conditions or news events, and their activity can amplify price movements during these transitional periods.
Derivatives Market Activity: The global nature of Bitcoin derivatives markets (futures, options) means that activity in these markets can influence spot prices around the clock. The US evening/Asian morning window sees active participation from traders in these regions.
For traders, this period of increased volatility presents both opportunities and risks. Opportunities arise from potentially larger price swings that can be capitalized upon with well-timed entries. Risks are elevated due to the potential for rapid price changes, which can trigger stop-losses or lead to slippage. Therefore, while these hours can be opportune for entry, they also demand heightened vigilance and robust risk management.
5. Entry Strategies: Volatility, Candlestick Patterns, and Timing
Leveraging the increased volatility during US evening and Asian morning hours for entry timing requires a methodical approach, primarily focusing on the confirmation provided by bullish candlestick patterns. Candlestick charts offer a visual representation of price movements and can signal shifts in market sentiment and potential reversals or continuations.
Key Bullish Candlestick Patterns for Entry Confirmation:
Hammer: Appearing after a downtrend, a Hammer is characterized by a small real body at the upper end of the trading range, with a long lower shadow (at least twice the size of the body) and little to no upper shadow. It indicates that sellers initially pushed prices down, but buyers stepped in strongly to drive prices back up near the open, suggesting a potential bottom and bullish reversal.
Inverted Hammer: Also a bottom reversal pattern, the Inverted Hammer has a small real body at the lower end of the trading range, a long upper shadow, and a short (or absent) lower shadow. It suggests that buyers attempted to push the price up, but sellers resisted. However, the fact that buyers showed strength is a tentative bullish sign, requiring further confirmation.
Bullish Engulfing: This is a powerful two-candle reversal pattern. The first candle is bearish (red/black), and the second candle is bullish (green/white) with a real body that completely "engulfs" the real body of the preceding bearish candle. It signifies that buying pressure has overwhelmed selling pressure.
Piercing Line: Another two-candle bullish reversal pattern seen after a downtrend. The first candle is a strong bearish candle. The second candle opens below the low of the first candle but then closes more than halfway up the real body of the first bearish candle. This indicates a significant shift in sentiment from bearish to bullish during the second candle's session.
Morning Star: A three-candle bullish reversal pattern. It begins with a long bearish candle, followed by a small-bodied candle (which can be bullish or bearish and ideally gaps down from the first candle), and then a long bullish candle that closes well into the body of the first bearish candle (ideally gapping up from the second candle). The small middle candle (the "star") represents indecision, and the strong bullish third candle confirms the reversal.
Three White Soldiers: This is a strong bullish continuation or reversal pattern consisting of three consecutive long-bodied bullish candles. Each candle should open within the body of the previous candle and close at or near its high, making progressively higher highs. It signals sustained buying pressure.
Strategic Entry Timing:
Monitor Volatile Periods: Be particularly attentive to price action during the US evening and Asian morning hours.
Identify Key Support: Note the psychological levels and Fibonacci retracement zones where BTCUSD is expected to find support.
Scan for Bullish Candlesticks: Look for the formation of one of the aforementioned bullish candlestick patterns (or others like Dojis at support, Bullish Harami) at or near these support levels during the identified volatile periods.
Seek Confirmation: Wait for the candlestick pattern to fully complete at the close of its period (e.g., end of the hour for an hourly chart). Some traders wait for the next candle to trade above the high of the bullish pattern for further confirmation.
Volume Analysis: Higher trading volume accompanying the formation of a bullish candlestick pattern adds to its reliability, indicating stronger conviction behind the buying pressure.
Context is Key: Bullish reversal patterns are most potent when they appear after a discernible pullback within a larger uptrend, or at the end of a consolidation phase near strong support.
By combining the timing advantage of predictable volatility spikes with the confirmation signals from bullish candlestick patterns at technically significant support levels, traders can refine their entry strategies for BTCUSD.
6. Other Key Technical Indicators for Comprehensive Analysis
While the core observations provide a strong foundation, incorporating other technical indicators can offer a more holistic view of BTCUSD's market dynamics:
Moving Averages (MAs): MAs smooth out price data to identify trend direction and potential support/resistance. The 50-day, 100-day, and 200-day SMAs (Simple Moving Averages) or EMAs (Exponential Moving Averages) are widely watched. Price trading above these MAs is generally bullish. Crossovers, like a "golden cross" (50-day MA crossing above the 200-day MA), are considered strong long-term bullish signals. Conversely, a "death cross" (50-day MA crossing below the 200-day MA) is bearish.
Relative Strength Index (RSI): This momentum oscillator measures the speed and change of price movements, ranging from 0 to 100. An RSI above 70 is often considered overbought (suggesting a potential pullback), while below 30 is oversold (suggesting a potential bounce). However, in strong trends, BTCUSD can remain in overbought or oversold territory for extended periods. Bullish or bearish divergences between price and RSI (e.g., price making a new high while RSI makes a lower high) can signal weakening momentum.
MACD (Moving Average Convergence Divergence): This trend-following momentum indicator consists of the MACD line and a signal line. A bullish crossover occurs when the MACD line crosses above the signal line, suggesting increasing upward momentum. A bearish crossover is the opposite. The MACD histogram visualizes the distance between the MACD and signal lines; a growing positive histogram is bullish.
Horizontal Support and Resistance Levels: Beyond Fibonacci, historical price action creates distinct support (price floor) and resistance (price ceiling) levels. These are areas where the price has previously reversed or consolidated. Identifying these levels on daily and weekly charts provides a broader map of potential turning points.
Trendlines and Channels: Drawing trendlines connecting successive lows (uptrend line) or highs (downtrend line) helps visualize the dominant trend. Price often respects these lines. Parallel trendlines can form channels, providing dynamic support and resistance boundaries. A break out of a well-established trendline or channel can signal a significant change in trend.
Volume Analysis: Trading volume is a critical confirming indicator. A price rally accompanied by increasing volume is generally seen as healthy and sustainable. Conversely, a rally on declining volume may indicate weakening conviction. Spikes in volume during breakouts above resistance or bounces from support add validity to the price move.
Integrating these indicators with the primary observations about psychological levels, Fibonacci support, and candlestick patterns during volatile periods can provide a more robust and nuanced trading framework.
7. Risk Management in Bitcoin Trading
The high volatility inherent in BTCUSD, while offering profit potential, also necessitates stringent risk management. Without it, traders expose themselves to significant losses. Key risk management practices include:
Stop-Loss Orders: Always define an exit point for a trade if it moves against you. A stop-loss order automatically closes a position when the price reaches a predetermined level, limiting potential losses.
Position Sizing: Determine the appropriate amount of capital to allocate to a single trade based on your overall portfolio size and risk tolerance. A common rule is to risk no more than 1-2% of trading capital on any individual trade.
Risk/Reward Ratio: Before entering a trade, assess the potential profit (reward) versus the potential loss (risk). Aim for trades where the potential reward is significantly greater than the risk (e.g., 2:1 or 3:1).
Diversification: While this analysis focuses on BTCUSD, traders should consider diversifying their overall crypto portfolio if they are investors, rather than concentrating all funds in one asset.
Emotional Discipline: Avoid making trading decisions based on fear (FUD - Fear, Uncertainty, Doubt) or greed (FOMO - Fear Of Missing Out). Stick to a well-defined trading plan.
8. Potential Future Outlook (Based on Technicals)
Based on the current technical posture where Bitcoin shows strength above a key psychological level and finds support at Fibonacci retracement zones, the outlook leans cautiously optimistic, contingent on these supports holding.
Bullish Scenario: If BTCUSD continues to respect these support levels, particularly during periods of consolidation, and bullish candlestick patterns during volatile US evening/Asian morning hours lead to upward impulses, further upside is likely. A sustained break above immediate overhead resistance, confirmed by volume, could see BTCUSD challenge its next major resistance zones and potentially trend towards new highs. The ongoing defense of psychological levels is paramount for this scenario.
Bearish Scenario: Should the identified support levels (psychological and Fibonacci) fail to hold, the outlook could shift. A decisive break below these supports, especially on increased selling volume, would indicate that sellers have gained control. This could lead to a deeper correction, targeting lower support structures and potentially invalidating the current bullish sentiment. Increased volatility during the US evening/Asian morning hours could, in this case, exacerbate downward moves if bearish patterns emerge.
9. Conclusion
The technical analysis of BTCUSD reveals a market displaying notable strength, characterized by its ability to hold above a significant psychological price point and find robust support at Fibonacci retracement levels. This underlying resilience is a positive sign for bulls. The tendency for volatility to surge during the US evening and Asian morning trading sessions presents strategic windows for traders, particularly when seeking entries confirmed by validated bullish candlestick patterns at these critical support junctures.
A comprehensive trading approach should also integrate other indicators like moving averages, RSI, MACD, and volume analysis to confirm signals and understand the broader market context. While the current technical setup suggests a favorable environment for bulls, the inherent volatility of Bitcoin demands disciplined risk management practices. Traders must remain vigilant, adapting their strategies to the evolving price action and ensuring that any bullish conviction is continuously validated by the market's behavior at these key technical inflection points. The interplay between these technical elements will be crucial in determining BTCUSD's trajectory in the near to medium term.

BTC | New ATH Incoming | + 135% ??A very interesting fractal from 2021 lead to a 135% increase - and a new all time high.
Bitcoin has been following similar patterns to the bullish twin-peaks in 2021. After a multi-month correction, the price proceeded to increase another 135% over the next few months. Some weeks fast, and some weeks sideways.
Is it possible that BTC follows a similar pattern - and increase another 135%, all the way to 170k?
Hec, I'd even be happy with just a 100% ! That would lead us up to around 149k, which can also be considered a phycological resistance zone.
While you're here! Check out this post on PEPE:
_________________
BINANCE:BTCUSDT


Bitcoin could reach as high as $250,000.I think Bitcoin could reach as high as $250,000 per coin in wave 5, as crypto often experiences extended fifth waves—similar to what we see in commodity markets like gold and silver. It’s possible for it to go even higher than this, but I believe $250,000 is a very realistic target.
As always, stay profitable.
– Dalin Anderson

BTCUSD , 1DPattern is looking very good , we can expect a very good move if the upper trendline will Break
wait until for the break of upper trendline
follow for more swing trade ideas

Pairing between BTC & Global Liquidity IndexSup everyone,
if you're active on twitter or have been looking around for crypto trade ideas you might have stumbled upon the Global Liquidity Index chart (at least I have).
I've stumbled upon it a few months back and have been testing it ever since, let me tell you what this chart is about:
The Global Liquidity Index basically measures how much money is flowing through global markets—think of it like the pulse of the financial system... traders and investors use it to get a sense of overall market conditions, liquidity availability, and risk appetite.
Now, here’s the cool thing: when you layer the Global Liquidity Index onto the Bitcoin chart, you notice something interesting— BITSTAMP:BTCUSD tends to react, but with a delay. Typically, there's about a 2-3 month lag. If global liquidity spikes or makes a sharp V-shaped recovery, Bitcoin usually mirrors this movement roughly 80 days later.
Why does this happen? Well, Bitcoin is a highly speculative asset, and institutions—especially banks—often wait to see solid liquidity signals before moving their capital into riskier assets like crypto. They prefer confirmation over speculation, which explains the delay.
So, in simple terms, by tracking global liquidity, you get a pretty useful heads-up about where Bitcoin might be headed a couple of months down the road.
The Global Liquidity Index is essentially a snapshot showing how much money central banks and financial institutions are injecting or pulling out of the global economy. Think of it like a big gauge tracking how "easy" or "tight" money conditions are worldwide.
It usually takes into account factors like:
Central Bank Policies: How much money central banks are printing or how they're changing interest rates.
Bank Reserves and Credit Availability: The amount banks can lend out, influencing how easily money flows through markets.
Government Spending and Stimulus: Fiscal policies injecting liquidity directly into the economy.
International Capital Flows: Money moving across borders, affecting global market liquidity.
When liquidity is abundant, there's more money sloshing around looking for places to invest. That typically pushes up asset prices—including speculative ones like Bitcoin—as investors seek higher returns. Conversely, when liquidity tightens (like when central banks raise interest rates or pull back stimulus), money becomes scarcer, risk appetite shrinks, and assets tend to dip.
So, when you're watching the Global Liquidity Index, you're basically monitoring how central banks and institutions are influencing market sentiment and investment behaviors, which eventually impacts speculative assets like Bitcoin—but with that notable delay we talked about earlier.
Practically speaking, here's how you apply the Global Liquidity Index to Bitcoin:
You watch for major turning points—peaks, bottoms, or sharp reversals—in global liquidity. Once you spot one, mark your calendar about 2–3 months forward (around 80 days). That’s usually when Bitcoin mirrors that move.
So, for instance, if the Global Liquidity Index sharply rebounds upward (a V-shaped recovery), you'd expect BTC to follow with a rally roughly two to three months later. On the flip side, if liquidity peaks and starts declining, it's a heads-up that Bitcoin could face downward pressure within the next few months.
This gives you a practical edge—you're essentially previewing BTC’s possible moves.
All things said, if you look at BTC's chart right now and apply the Global Liquidity Index to it you can see how the second has broken its previous high a few months back, but BTC yet has to break its, you can arrive to the conclusions here....
With no reversal in sight (for now) in the Global Liquidity Index, there don't seem to be signs of "spoofing", no case in which the index starts declining and so makes traders who know about this delay start to sell earlier than the delay.
End of the story - things look promising for BTC and you should definitely keep the Global Liquidity Index in your list of indicators.

Bitcoin is still following 2017 run. Surprising things to see
As many of you know, I have been referring This cycle of Bitcoin to that of the 2013 ->2017 bull run. And while PA has Fallen off and below the Fractal itself, we do still have one Very Major thing to see and it is a Good one.
So, the chart above has an arrow. This is pointing to Sep, Oct, Nov 2024.
See how PA pushed up to the "Neckline" of the Range and got rejected for 2 weeks.
A Red then Green Candles, on or below that "Neckline" and then Off it went.
We are currently just below the "Neckline" of this Range and we are currently printing a Red candle. It is early days but maybe we will repeat the same pattern.
There are reasons that I have explained in an earlier post today, that point towards a possible Red candle this week.
The other thing I want to show you on this subject is the MACD
This is a Daily MACD ( the main chart being Weekly) But while the actual PA of the MACD is different, I want you to see the Histogram. The Histogram shows us the % Difference between the MACD line ( yellow) and its Signal line ( Red)
Have a look at the the similarity the histogram pattern in 2024 ( arrow ) compared to this period Now.
The Large green Climb from a Low, the fall, the new smaller climb, the drop to Red and then a push higher.
OK, so the scale is different but, to me, it shows a similar pattern to the previous end of Ranging period.
We need to see if this pays out. If so, we will see a Red Histogram for a while..
This ties in with the ideas presented above on the PA patterns.
But overall this cycle, we do seem to be repeating patterns in a broad sense, with a larger scale currently. The larger scale of thispossible Red Histogram also plays into the idea mentioned at the end of this post.
So , what is the connection to the 2013 - 2017 Cycle.
Look at the upper trendline that has rejected PA since 2024. This is an OLD line of resistance from before 2017...
Lets look at a zoomed out chart
Look at that Arrow on the Left and that trend line.
It is the SAME LINE - Not only that, it rejected PA twice in late 2016 and 2017, before PA broke through and went on to reach a new ATH
So, Having seen this, I am happy to believe that we ARE Still following that 2013 -> 2017 Cycle pattern.
True, PA has fallen below the Fractel but we do seem to be repeating the Trend line Rejection, Dip, Rejection and........
You can also see how this same trend line, once crossed, is extremely strong support - infact we did not drop back below until July 2022, after another ATH
BUT, as ever, I look to BOTH sides and there is a chance we may see a stiffer rejection, IF we get rejected here again.
Should events dictate a further Drop in PA, we may see PA return to the next trend line below, around 82K. ( remember that Red Histogram pattern I mentioned earlier )
While this would Scare many, it would still play into the pattern we have been seeing.
2024 saw 3 major Rejections off its Neckline.
We have had 2 so far in 2025 and we are there right now, waiting to see what happens, with a RED candle. A Drop back to 82K would also reset the Daily MACD very nicely.
I remain Cautious and Bullish
what ever happens in the short term, I have little doubt about further pushes higher, maybe a LOT higher

BTC longterm overviewIt seems that we have around 4 months to the end of this bull-run and Bitcoin top.
-------------------------------------
Share and follow me for further analyses.

Bitcoin Daily update , MACD & RSI - whats possibility short Term
Bitcoin has reached above the next Fib circle. You can see how PA reacts to these by looking back
For me, I can see PA sliding down the 618 Circle we currently sit on until we reach that dashed line that shows the lower line of support of the rising channel.
We reach that around 17 May if we range sideways, slide along fib circle.
It could also be said that the 1.5 "local" Fib extension is what is offering Support here and the same date is used for when PA reached that dashed line of support.
Which ever option you choose, PA has support here and we should remain around this area unless the inflation figures released TODAY are not good
Why will PA range and not continue to Rise ?
RSI is up in overbought
This can range high and we need to watch and see if the RSI bounces of its own MA ( yellow line)
The Daily MACD is showing a desire to turn Bearish. for the 2nd time, it is curling over and not just pushing higher as previously.
This is NOT an over all Bearish signal to me but one that shows that PA is pushing hard against resistance. See how the histogram has reduced in size
The 4 hour MACD is still falling Bearish, recovering from the previous pushes.
In conclusion
The combination of a High RSI and Weakening MACD leads me to think that PA will Range across at best for a while, Till the 4 hour MACD reverses and climbs, Maybe with small Dips and Troughs.
If BTC Looses 100K, that is a big mental blow and I think the Bulls will try and avoid this.
However There is a possibility that we could drop back to the Low around 82K by the end of this month. I think this is a low possibility and I will post a report on this today but it is Good to look at all possibilities.
Long Term still Very BULLISH

Bullish Tide: Are Bears Drowning as $31M Shorts VanishBullish Tide: Are Bears Drowning as FWB:31M Shorts Vanish and "Price Discovery 2" Looms?
The cryptocurrency landscape is once again electric with anticipation, and at the heart of this renewed fervor stands Bitcoin. As of May 2025, the prevailing winds appear to be firmly in the sails of the bulls. A cascade of recent market events, headlined by a dramatic $31 million liquidation of Bitcoin short positions, is sending a stark warning to pessimistic speculators. This, coupled with compelling technical analysis suggesting that Bitcoin must close the week above a crucial level to initiate 'price discovery 2', paints a picture of a market on the brink of a potentially explosive upward trajectory.
This isn't merely about fleeting price surges. Underlying these market dynamics is a growing conviction that Bitcoin doesn’t need to change; the world does. While critics often call for Bitcoin to become "faster, cheaper, greener," a powerful counter-narrative champions its existing, robust design as a solution to the inherent weaknesses of traditional systems. Adding fuel to this bullish fire is the subtle but significant trend of Bitcoin’s Quiet Coup, as wealth funds methodically build up their holdings. Furthermore, market sentiment indicators like Bitcoin funding rates remaining positive on major exchanges like Binance seem to confirm a strong, underlying uptrend. Are Bitcoin bears truly losing out, and are we witnessing the dawn of a new era for the king of cryptocurrencies?
The Cost of Doubt: $31 Million in BTC Shorts Wiped Out
The unforgiving nature of leveraged trading in the cryptocurrency markets was recently laid bare with the news that a staggering $31 million in Bitcoin short positions were liquidated. This event serves as a potent illustration of the risks involved in betting against Bitcoin's momentum, especially in the current climate.
Short selling in the crypto sphere, much like in traditional markets, involves traders borrowing Bitcoin, selling it with the expectation that its price will fall, and then planning to buy it back at a lower price to profit from the difference. However, the crypto markets are known for their high volatility and the widespread use of leverage, particularly in perpetual futures contracts. Leverage allows traders to control a much larger position than their initial capital would normally allow, amplifying potential profits but also, crucially, potential losses.
When the market moves sharply against a leveraged short position – meaning Bitcoin's price surges upwards – traders can face a margin call. If they cannot add more funds to cover their mounting losses, the exchange automatically closes their position to prevent further debt. This forced closure is a liquidation. The $31 million wipeout signifies that a substantial volume of bets on Bitcoin's price decline was overwhelmed by a potent wave of buying pressure.
This mass liquidation event has several implications. Firstly, it inflicts significant financial pain on those who were positioned for a downturn, effectively Bitcoin bears losing out on their wagers. Secondly, these forced closures inherently involve buying Bitcoin to cover the short positions, which paradoxically adds more fuel to the upward price movement. This can trigger a "short squeeze," where rising prices force more shorts to cover, leading to further liquidations and an accelerated price rally. Such events bolster bullish sentiment, demonstrating underlying market strength and deterring further aggressive short selling. It’s a clear signal that the market's undercurrent was far more robust than the bears had anticipated.
On the Cusp of a New Frontier: The Critical Weekly Close and "Price Discovery 2"
The excitement among Bitcoin proponents is palpable, with many analysts asserting that Bitcoin bulls are on the cusp of launching the market back to all-time highs and beyond. Central to this optimistic outlook is the focus on an upcoming, crucial weekly close. According to prevailing technical analysis, Bitcoin must close the week above a specific, strategically important price level to start 'price discovery 2'.
"Price discovery" is the process by which market participants determine the fair value of an asset through their buying and selling activities. When an asset like Bitcoin surpasses its previous all-time high (ATH), it enters a phase where historical resistance levels cease to exist. This is true price discovery – the market is venturing into uncharted territory, with no past price ceilings to act as psychological or technical barriers. "Price Discovery 1" can be considered Bitcoin's journey to its previous peak (around $69,000 in November 2021). The term "Price Discovery 2" thus implies a new, sustained bull run that would take Bitcoin significantly beyond that former zenith.
The significance of a "weekly close" above a key resistance level cannot be overstated in technical analysis. Weekly charts smooth out short-term noise and are often seen as better indicators of major trend shifts. A decisive weekly close above, say, the previous ATH or a major interim peak, would be a powerful confirmation for many traders and investors that the bulls are firmly in control. It would invalidate bearish scenarios that predicted a rejection at these upper levels and would likely attract a fresh wave of capital into the market.
Several potent catalysts could fuel this ascent into "Price Discovery 2." The quadrennial Bitcoin halving event, the most recent of which occurred in April 2024, historically constricts the new supply of Bitcoin, often leading to significant price appreciation in the months and years that follow as demand outstrips this reduced supply. Continued institutional adoption, evidenced by wealth funds accumulating Bitcoin, provides a steady stream of large-scale buying pressure. Furthermore, a challenging macroeconomic environment, characterized by persistent inflation in major fiat currencies or geopolitical uncertainties, can enhance Bitcoin's appeal as a non-sovereign store of value and a hedge against systemic risks. Should Bitcoin achieve this critical weekly close and embark on "Price Discovery 2," the upside could be substantial, as the market seeks to establish a new equilibrium in uncharted price territory.
The Unwavering Standard: Bitcoin Doesn’t Need to Change, The World Does
Amidst the price charts and market analyses, a more profound narrative is solidifying: Bitcoin doesn’t need to change; the world does. For years, critics have argued that Bitcoin should be faster, cheaper, greener, often comparing its transaction throughput or energy consumption to centralized payment networks or newer, less proven blockchain protocols. However, an increasing number of proponents argue that maybe the point isn’t to fix Bitcoin. Maybe it’s to fix everything else with Bitcoin.
This perspective champions Bitcoin's core attributes – often perceived as limitations by detractors – as its most vital strengths:
• Unparalleled Decentralization: Bitcoin operates on a globally distributed network with no single point of control. This makes it resistant to censorship, shutdown, or manipulation by any government or corporation. In an age of increasing financial surveillance and control, this is a feature, not a bug.
• Robust Security and Immutability: The Proof-of-Work (PoW) consensus mechanism, while energy-intensive, is what underpins Bitcoin's formidable security. The immense computational power dedicated to mining creates an economic fortress around the network, making its transaction history virtually tamper-proof. While the "greener" argument often pushes for alternatives like Proof-of-Stake (PoS), many believe PoW offers a unique level of objective security crucial for a global store of value. Moreover, the narrative around Bitcoin's energy use is evolving, with increasing adoption of renewable and stranded energy sources for mining, and a growing recognition that its energy consumption is a worthwhile trade-off for securing a truly independent financial system.
• Absolute Scarcity: Bitcoin's supply is capped at 21 million coins, a hard-coded limit that cannot be altered. This programmatic scarcity makes it a powerful antidote to the inflationary pressures inherent in fiat currencies, which can be created limitlessly by central banks. This "digital gold" characteristic is fundamental to its value proposition.
• Layered Scaling: While the Bitcoin base layer prioritizes security and decentralization over raw transaction speed, innovation is flourishing on Layer 2 solutions like the Lightning Network. These protocols enable fast, low-cost transactions by batching them off-chain and settling them periodically on the main Bitcoin blockchain, thus allowing Bitcoin to scale for everyday payments without compromising its core principles.
The argument is that instead of trying to mold Bitcoin to fit the constraints of the old financial world, we should recognize how its unique properties can address the systemic flaws within that world – issues like inflation, financial exclusion, censorship, and counterparty risk. Bitcoin, in its current form, offers a radical, resilient alternative.
The Silent Infiltration: Wealth Funds Build Up Bitcoin Holdings
Further bolstering the bullish case is the ongoing, often understated, trend of Bitcoin’s Quiet Coup: Wealth Funds Build Up Holdings. This isn't about flashy headlines but rather a methodical, strategic accumulation of Bitcoin by sophisticated institutional investors, including pension funds, endowments, sovereign wealth funds, and large family offices.
These entities, traditionally conservative and managing trillions of dollars in assets, are increasingly allocating a portion of their portfolios to Bitcoin. Their motivations are manifold:
• Diversification: Bitcoin has historically exhibited low correlation with traditional assets like stocks and bonds, making it an attractive addition for enhancing portfolio risk-adjusted returns.
• Inflation Hedge: In an environment of persistent global inflation, Bitcoin's finite supply positions it as a potential store of value, a digital hedge against currency debasement.
• Asymmetric Upside: Even a small allocation to Bitcoin can offer significant upside potential, an appealing proposition for large funds seeking growth.
• Growing Regulatory Clarity and Infrastructure: The approval of Bitcoin ETFs in major jurisdictions like the U.S. has provided regulated and accessible avenues for institutional investment, alongside the development of institutional-grade custody and trading solutions.
This "Quiet Coup" signifies a maturing perception of Bitcoin, moving it from a speculative niche asset to a legitimate component of institutional investment strategy. The steady inflow of significant capital from these large players not only provides price support but also lends credibility and encourages further adoption, potentially reducing long-term volatility as more Bitcoin is held by entities with long-term horizons.
Reading the Bullish Tea Leaves: Bitcoin Funding Rates Remain Positive
Adding another layer of confirmation to the prevailing bullish sentiment is the observation that Bitcoin Funding Rates Remain Positive On Binance — Strong Uptrend Confirmed? Funding rates are a key mechanism in cryptocurrency perpetual futures markets, designed to keep the price of the perpetual contract aligned with the spot price of the underlying asset.
When funding rates are positive, it generally means that traders holding long positions (betting on a price increase) are paying a premium to those holding short positions. This indicates a higher demand for long leverage, reflecting overall bullish sentiment in the derivatives market. Consistently positive funding rates on a major exchange like Binance, which boasts significant trading volume, suggest that this optimism is sustained. It implies that traders are confident enough in Bitcoin's upward trajectory to pay a recurring fee to maintain their leveraged long positions.
While extremely high funding rates can sometimes signal an over-leveraged market ripe for a correction (a "long squeeze"), moderately and persistently positive rates, as currently observed, are often interpreted as a healthy sign of a strong and well-supported uptrend. It suggests that the rally is not just speculative froth but is backed by conviction among active traders.
Conclusion: A Perfect Storm for Bitcoin's Next Chapter?
As May 2025 progresses, the confluence of factors points towards a potentially transformative period for Bitcoin. The $31 million decimation of short positions serves as a stark reminder of the perils of underestimating Bitcoin's strength. The market's eager anticipation of a weekly close that could unlock "Price Discovery 2" highlights the potent bullish technical setup. This is further reinforced by the fundamental conviction that Bitcoin's core design is its ultimate strength, offering solutions the traditional financial world desperately needs.
The quiet, strategic accumulation by wealth funds injects not only capital but also a profound sense of legitimacy, while positive funding rates reflect a confident and sustained bullish sentiment among active traders. While the path ahead will undoubtedly feature volatility – a characteristic inherent to Bitcoin's journey – the current alignment of technical indicators, institutional adoption, strong market sentiment, and a compelling fundamental narrative suggests that Bitcoin bears may indeed be losing out, and significantly so. The stage appears set for Bitcoin to not only challenge its previous highs but to potentially embark on a new, exhilarating phase of growth and adoption, further solidifying its role in the evolving global financial order.

Bitcoin Smashes $103K: Is $150K Just Around the Corner?Bitcoin's Resurgence: Navigating the $100K Breakthrough and What Comes Next
In a remarkable display of market resilience, Bitcoin has reclaimed the coveted $100,000 level, just three months after dropping below this significant psychological threshold. The flagship cryptocurrency's powerful comeback has sent shockwaves through financial markets, triggering a massive short squeeze and reigniting debates about Bitcoin's long-term potential. As the asset pushes beyond $103,000 and approaches its previous all-time high, traders and investors are scrambling to position themselves for what many believe could be the next phase of an extraordinary bull cycle.
The Historic Reclamation of $100K
Bitcoin's journey back to $100,000 represents more than just a numerical milestone—it's a testament to the asset's remarkable resilience in the face of significant headwinds. After briefly touching six-figure territory in early 2025, Bitcoin experienced a substantial correction that saw prices retreat below $90,000, triggering concern among market participants and no shortage of bearish predictions from skeptics.
What makes this recovery particularly impressive is the speed with which it occurred. Historically, Bitcoin has often experienced extended consolidation periods after major corrections, sometimes lasting months or even years. The rapid three-month turnaround suggests underlying strength in Bitcoin's market structure that distinguishes this cycle from previous ones.
On-chain data reveals fascinating dynamics behind the recovery. Throughout the correction, long-term holders continued accumulating Bitcoin, with wallet addresses holding more than 1 BTC increasing by 5.2% even as prices declined. This pattern of "smart money" accumulation during periods of retail fear often precedes significant upward price movements.
The reclamation of $100,000 also coincided with several favorable macro developments, including renewed expectations for central bank easing and diminishing concerns about regulatory crackdowns. These factors, combined with Bitcoin's post-halving supply dynamics, created ideal conditions for a powerful recovery.
The Massive Short Squeeze
A key accelerant in Bitcoin's surge beyond $100,000 was an extraordinary short squeeze that forced bearish traders to cover their positions at increasingly higher prices. Data from cryptocurrency derivatives platforms reveals that over $850 million in short positions were liquidated during a 72-hour period as Bitcoin broke above key resistance levels.
The mechanics of a short squeeze are particularly powerful in cryptocurrency markets due to the prevalence of leverage. Many platforms offer leverage ratios of 10x, 20x, or even higher, meaning relatively small price movements can trigger automatic liquidations. As these liquidations occur, trading algorithms automatically purchase Bitcoin to close the short positions, creating additional upward pressure on prices and potentially triggering more liquidations in a self-reinforcing cycle.
What made this particular short squeeze especially impactful was its timing relative to market sentiment. The Crypto Fear & Greed Index had been hovering in "Neutral" to "Fear" territory for weeks, indicating widespread caution among market participants. This cautious positioning resulted in a market structure where relatively few traders were positioned for upside, creating the perfect conditions for a powerful squeeze when momentum shifted.
Is $150,000 Now Conservative?
In light of Bitcoin's powerful resurgence, price predictions that once seemed ambitious are being reevaluated. Earlier this year, several major financial institutions and research firms issued year-end targets of $150,000 for Bitcoin—forecasts that were met with skepticism by many market observers. Now, with Bitcoin already above $103,000 and demonstrating strong momentum, these once-ambitious targets appear increasingly conservative.
Technical analysts point to several factors supporting the case for higher prices. The weekly Relative Strength Index (RSI), despite the recent surge, remains below extreme overbought levels that typically signal exhaustion. Additionally, volume profiles show relatively little resistance above the previous all-time high, suggesting potential for rapid advancement if that level is breached.
The most bullish analysts have begun floating targets of $170,000 to $200,000 for this cycle, basing their projections on Fibonacci extensions, comparative analysis with previous bull markets, and on-chain metrics indicating strong holder conviction. These projections represent a dramatic shift in market sentiment compared to just a few months ago when many were questioning whether Bitcoin would reclaim $100,000 within the year.
Is It Too Late to Buy Bitcoin?
As Bitcoin pushes beyond $103,000, the perennial question resurfaces: is it too late to buy Bitcoin? This query, which has appeared at virtually every significant price level in Bitcoin's history, reflects the challenge of evaluating assets in price discovery mode without extensive historical reference points.
Historical perspective offers valuable context for addressing this question. Investors who asked whether it was "too late" to buy Bitcoin at $10,000, $20,000, or $50,000 and chose to remain on the sidelines missed substantial returns. However, those who purchased at local tops often endured extended drawdowns before seeing their investments return to profitability.
On-chain data provides additional perspective for evaluating current price levels. The MVRV (Market Value to Realized Value) ratio, which compares Bitcoin's market capitalization to its realized capitalization, currently sits around 2.8—elevated compared to bear market conditions but significantly below the extreme readings above 4.0 that characterized previous market tops.
Similarly, the percentage of Bitcoin supply in profit currently stands at approximately 93%, approaching but not yet reaching the 98-99% levels typically seen at cycle peaks. These metrics suggest that while Bitcoin isn't in "bargain" territory, present valuations haven't reached the extreme overvaluation levels that preceded major corrections in previous cycles.
Bull Run Warning: Navigating the Path Forward
While enthusiasm surrounds Bitcoin's reclamation of $100,000, experienced market participants recognize the importance of maintaining perspective during periods of strong momentum. Several potential warning signs merit attention as traders navigate the current environment.
The rapid nature of Bitcoin's ascent to $103,000 has created technically overbought conditions on shorter timeframes, suggesting the potential for near-term consolidation or pullbacks. The daily RSI has reached levels above 80, a zone that has historically preceded at least temporary pauses in uptrends, even during the strongest bull markets.
Additionally, funding rates on perpetual futures contracts have reached extremely positive levels, indicating traders are paying significant premiums to maintain long positions. This condition often occurs near local tops as market participants become overly enthusiastic about near-term prospects.
Risk management becomes particularly important during such periods of strong momentum. Many professional traders reduce position sizes when volatility increases, recognizing that while potential returns expand during such phases, so do potential drawdowns.
Next Price Targets: From $106K to $1M
As Bitcoin pushes into record territory, analysts have begun identifying potential targets for the next phase of the bull cycle. The immediate focus remains on the previous all-time high around $106,000, which represents both a psychological and technical resistance level. Beyond this point, limited historical price action creates a potential vacuum that could allow for rapid advancement if bullish momentum continues.
Technical analysts have identified several key levels through Fibonacci projections and extension analysis. The 1.618 Fibonacci extension from the previous major correction projects a target around $122,000, while the 2.618 extension suggests potential toward $170,000. These levels represent natural points where the market might experience resistance or consolidation during continued uptrends.
More ambitious predictions extend considerably higher. The stock-to-flow model, which relates Bitcoin's scarcity to its market value, suggests potential long-term valuations approaching $1 million per Bitcoin. While such forecasts remain highly speculative, they illustrate the wide range of potential outcomes for this emerging asset class.
Support levels are equally important to monitor, particularly for traders managing risk in leveraged positions. The psychological $100,000 level now represents initial support, followed by the $94,000-$96,000 zone where significant buying emerged during the recent advance. The 50-day moving average, currently around $92,000 and rising, provides an additional technical reference point for potential support during pullbacks.
Market Sentiment: Fear and Greed Dynamics
Market sentiment indicators provide valuable context for understanding Bitcoin's current positioning. The Crypto Fear & Greed Index has shifted into the "Greed" zone after spending much of the previous month in "Neutral" territory, reflecting improved market sentiment following Bitcoin's reclamation of $100,000.
This transition marks an important psychological shift but also signals increasing risk of overexuberance. Historically, when the index reaches extreme readings in either direction, it has often served as a contrarian indicator. Extreme greed readings have typically occurred near local tops, while extreme fear has often presented buying opportunities.
Social media activity metrics reveal a significant increase in Bitcoin-related discussions, with sentiment analysis showing predominantly positive expressions. Google Trends data indicates search interest for "Bitcoin" has reached its highest level since January, suggesting renewed attention from retail participants who typically enter during periods of strong price performance.
Institutional sentiment provides a contrasting perspective to retail excitement. Surveys of professional investors indicate a more measured outlook, with many maintaining Bitcoin allocations but expressing concern about near-term volatility and the potential for consolidation after the recent surge. This divergence between institutional caution and retail enthusiasm creates an interesting dynamic that may influence price action in the weeks ahead.
Trading Strategies for the Current Environment
For traders navigating Bitcoin's volatile price action, adapting strategies to current market conditions is essential. Different approaches suit varying risk tolerances and time horizons, particularly during periods of expanded volatility and strong directional momentum.
Trend-following strategies have performed exceptionally well during Bitcoin's recent advance, with systematic approaches based on moving average crossovers or momentum indicators capturing much of the upside movement. These strategies typically involve entering positions when short-term momentum aligns with longer-term trends and using trailing stops to protect profits.
Countertrend strategies face greater challenges in the current environment but can still prove effective when applied with appropriate risk parameters. These approaches involve identifying potential exhaustion points where trends might temporarily reverse, typically using oscillators like RSI or Stochastic indicators to identify overbought or oversold conditions.
For longer-term investors, dollar-cost averaging continues to demonstrate effectiveness in navigating volatile markets without requiring precise timing decisions. This approach involves regularly purchasing Bitcoin in fixed dollar amounts regardless of price, mathematically ensuring better average entry prices during periods of volatility.
Conclusion: Navigating Bitcoin's New Era
Bitcoin's resurgence beyond $100,000 represents a significant milestone in cryptocurrency market development, potentially signaling the beginning of the next phase in this remarkable asset's evolution. The speed and magnitude of the recovery from below $90,000 to above $103,000 demonstrates both the volatility inherent in this emerging asset class and the powerful market forces that can drive prices when technical breakouts coincide with favorable fundamental catalysts.
For traders and investors, the path forward requires balancing enthusiasm about Bitcoin's demonstrated resilience with pragmatic risk management appropriate for an asset capable of significant price swings in both directions. While the backdrop appears favorable for continued strength, history suggests the journey will include both exhilarating advances and challenging retracements.
As market participants position themselves for what may come next, maintaining perspective on both historical precedents and the unique aspects of the current market cycle provides the most sustainable approach to navigating this dynamic landscape. Bitcoin's breakthrough beyond $100,000 creates both opportunity and risk—the traders who successfully balance these competing forces while maintaining disciplined execution will likely find the greatest success in capturing the potential of this extraordinary market.
The question is no longer whether Bitcoin can reach $100,000, but rather how far beyond this once-unimaginable milestone the current cycle might extend. For an asset that began trading at fractions of a penny, the reclamation of six-figure territory serves as a powerful reminder of cryptocurrency's capacity to challenge conventional financial assumptions and create paradigm-shifting returns for those willing to embrace both its potential and its risks.

#BITCOIN: $130,000 Is Where Price Headed To? BINANCE:BTCUSDT consolidated at 75k and reversed from the region as predicted in our previous chart. We now have strong confirmation that price will likely break through the daily bearish trendline. We can enter when it retests the identified area.
We have two major targets. Do your own research and analysis, and use this as secondary bias.
Good luck trading.
❤️
Hope you’re having a great weekend.
Team Setuspfx_

#BTCUSDT:Price Moving Well From $88,000 to $96,000,Next $128,000Bitcoin has moved well from our last idea of $88,000 to $96,000. However, a small correction is expected, which could be a good point to enter a swing trade. This could take the price to a new record high of around $128,000.
We have three targets, but each can be set based on your overview. The last three candles are not clear, so it’s best to wait for price to have a clearer indication of its next move.
We wish you the best and good luck in your trading journey. Thank you for your unwavering support! 😊
If you’d like to contribute, here are a few ways you can help us:
- Like our ideas
- Comment on our ideas
- Share our ideas
Team Setupsfx_
❤️🚀

Scenario #BTCUSDT long📉 LONG BYBIT:BTCUSDT.P from $104,353.0
🛡 Stop loss: $103,572.0
🕒 Timeframe: 1H
✅ Market overview:
➡️ The price confidently broke above $103,729 and held, confirming the uptrend.
➡️ The next target zone is $104,720–$105,090 — nearest movement objectives.
➡️ Volume increased during the impulse, indicating strong buyer presence.
➡️ A local support level formed around $103,729 — on a pullback, this zone may hold the price.
➡️ POC at $94,479 remains far below — the market has left the balance zone and is trading in an impulsive phase.
🎯 TP Targets BYBIT:BTCUSDT.P :
💎 TP1: $104,720.0
💎 TP2: $105,090.0
💎 TP3: $105,275.0
⚠️ Important: current structure BYBIT:BTCUSDT.P suggests possible correction (wedge breakdown), requiring caution or exit on key level loss.
⚠️ Despite the initial long from $104,353, a breakdown below $103,572 (stop loss) invalidates the long setup.
📢 If H1 closes below $103,572 — better to exit, scenario invalid.
🚀 Scenario BYBIT:BTCUSDT.P valid while holding above $103,729 — below that, correction likely toward lower targets!

Bitcoin Breaks Trendline-Is $109k Next?Technical Analysis: Ascending Channel Pattern
The asset is exhibiting an ascending channel pattern, indicative of sustained bullish momentum. Key observations include:
- Channel Boundaries: The price has consistently respected the channel's upper and lower boundaries, forming higher highs and higher lows.
- Breakout and Retest: Following a strong momentum breakout, the price is potentially retesting a key support level, previously acting as resistance.
- Support Zone: If buyers confirm support at this level, it may signal a continuation of the uptrend, targeting the upper boundary of the channel at $109,000.
Key Monitoring Points:
- Bullish Confirmation Signals: Look for bullish engulfing candles, strong wicks rejecting the support zone, or increased buying volume to confirm long positions.
- Risk Management: Failure to hold support could signal a bearish shift, emphasizing the importance of monitoring price action and adjusting strategies accordingly.

Ether-Bitcoin Ratio Signals ETH Is 'Extremely Undervalued,' The cryptocurrency market is a realm of intricate signals, complex metrics, and often-conflicting narratives. Among the myriad indicators traders and investors scrutinize, the Ether-Bitcoin (ETH/BTC) ratio holds a prominent place. This metric, a simple division of Ethereum’s price by Bitcoin’s price, serves as a barometer for the relative strength and market sentiment between the two leading crypto assets. Recently, this ratio has dipped to levels that historically signaled significant undervaluation for Ether, sparking debate about a potential upcoming rally. However, a confluence of factors – notably surging ETH supply, stagnant network demand, and a weakened token burn mechanism – casts a considerable shadow over this optimistic outlook, suggesting that past performance may not be a reliable guide in the current, uniquely challenging environment.
Understanding the ETH/BTC Ratio: A Barometer of Relative Strength
At its core, the ETH/BTC ratio reflects the market's perception of Ethereum's value proposition relative to Bitcoin. When the ratio trends upwards, it indicates that ETH is outperforming BTC, suggesting growing investor confidence in Ethereum's ecosystem, technological advancements, or utility. Conversely, a declining ratio signifies BTC's relative strength, potentially due to factors like "digital gold" narratives, safe-haven appeal, or specific Bitcoin-centric catalysts.
A low ETH/BTC ratio, such as those observed in recent times, is often interpreted by analysts as a sign that ETH is "cheap" or "undervalued" compared to Bitcoin. The logic is that, over time, capital flows within the crypto market tend to seek out assets with stronger growth potential or those perceived as lagging behind their fundamental value. If ETH is indeed undervalued, the expectation is that it will eventually catch up, leading to a rally in both its USD price and its value relative to BTC. This potential for "mean reversion" or a "catch-up trade" is what excites many market participants when the ratio hits historical lows.
Historical Precedents: When Undervaluation Sparked Rallies
The argument for an impending ETH rally based on the current low ETH/BTC ratio is not without historical merit. There have been several instances where a depressed ratio preceded substantial upward movements for Ether.
1. Post-2018 Crypto Winter: After the ICO boom and subsequent crash, the ETH/BTC ratio languished for an extended period. However, as the DeFi (Decentralized Finance) ecosystem began to gain traction in 2020 ("DeFi Summer"), ETH, as the foundational layer for most DeFi protocols, experienced a resurgence. The ratio climbed significantly as capital flowed into Ethereum to participate in yield farming, lending, and decentralized exchange activities.
2. The NFT Boom (2021): The explosion of Non-Fungible Tokens (NFTs) in early 2021, predominantly on the Ethereum blockchain, provided another major catalyst. The increased demand for ETH to mint, buy, and sell NFTs pushed its price and the ETH/BTC ratio upwards, as Ethereum's utility as a platform for digital collectibles and art became undeniable.
3. Anticipation of The Merge (2021-2022): As Ethereum moved closer to its pivotal transition from Proof-of-Work (PoW) to Proof-of-Stake (PoS) – "The Merge" – market sentiment turned increasingly bullish. The promise of significantly reduced energy consumption, coupled with the "ultrasound money" narrative (where ETH issuance would drastically decrease and potentially become deflationary due to EIP-1559's burn mechanism), fueled strong buying pressure. The ETH/BTC ratio saw notable gains during periods of heightened Merge anticipation.
In these instances, the low ETH/BTC ratio acted as a tinderbox, and specific fundamental catalysts served as the spark that ignited significant rallies. Investors who recognized the undervaluation signal and anticipated these catalysts were handsomely rewarded. This historical pattern underpins the current optimism among some analysts who see the present low ratio as a similar buying opportunity.
The Complicating Factors: Why This Time Might Be Different
Despite the compelling historical precedents, the current market environment for Ethereum presents a unique set of challenges that complicate the simple "undervalued, therefore rally" thesis. These headwinds stem from fundamental shifts in Ethereum's tokenomics and network dynamics.
1. Surging Supply: The Post-Merge Issuance Reality
While The Merge successfully transitioned Ethereum to a more environmentally friendly PoS consensus mechanism, its impact on ETH supply has been more nuanced than initially portrayed by some bullish narratives.
• Staking Rewards: Under PoS, new ETH is issued as rewards to validators who stake their ETH to secure the network. While the rate of new ETH issuance is significantly lower than it was under PoW, it is still a consistent inflationary pressure. The annual inflation rate from staking rewards is currently in the low single digits.
• Net Issuance vs. Deflation: The "ultrasound money" thesis largely depended on the EIP-1559 burn mechanism (discussed later) consistently burning more ETH than is issued through staking rewards, leading to a net deflationary supply. However, this has not always been the case post-Merge. There have been extended periods where ETH has been net inflationary.
• Unstaking and Liquid Staking Derivatives: The ability for validators to unstake their ETH (enabled by the Shanghai/Capella upgrade) means that previously locked supply can re-enter the market. Furthermore, the proliferation of Liquid Staking Derivatives (LSDs) like Lido's stETH or Rocket Pool's rETH, while enhancing capital efficiency, also means that staked ETH is not entirely removed from liquid circulation, as these derivative tokens can be traded or used in DeFi.
This consistent, albeit reduced, issuance contributes to sell pressure, especially if demand does not keep pace. The narrative of ETH becoming a deflationary asset has been weakened, impacting one of the key bullish arguments that previously supported a higher ETH/BTC ratio.
2. Flat Demand: A Stagnant Network Picture
For ETH's price to appreciate significantly, there needs to be robust demand for the token, driven by network usage and adoption. Currently, several indicators suggest that demand is, at best, flat, and in some areas, declining.
• Network Activity Metrics: Key on-chain metrics such as daily active addresses, transaction counts, and total gas consumed have shown periods of stagnation or even decline. While Layer 2 scaling solutions are processing more transactions, this activity doesn't always translate directly into proportional demand for ETH on the mainnet, especially if Layer 2s manage their own fee markets efficiently.
• Total Value Locked (TVL) in DeFi: While DeFi remains a cornerstone of Ethereum's value proposition, the growth in TVL has slowed considerably compared to the explosive growth seen in 2020-2021. Capital inflows into DeFi protocols on Ethereum have been less aggressive, partly due to macroeconomic conditions, regulatory concerns, and the emergence of competitive DeFi ecosystems on other blockchains.
• Competition from Alternative Layer 1s and Layer 2s: Ethereum faces increasing competition from other Layer 1 blockchains (e.g., Solana, Avalanche, Aptos, Sui) that offer higher throughput and lower transaction fees, attracting users and developers. Moreover, Ethereum's own Layer 2 ecosystem (e.g., Arbitrum, Optimism, Polygon zkEVM, Starknet, zkSync Era), while crucial for its long-term scalability, also fragments user activity and can, in some ways, reduce direct demand pressure on ETH for L1 transactions if users primarily operate within these L2 environments.
• Macroeconomic Headwinds & Regulatory Uncertainty: Broader economic conditions, including inflation, interest rate hikes, and recession fears, have generally dampened risk appetite across financial markets, including crypto. Additionally, the ongoing regulatory uncertainty in key jurisdictions like the United States creates an environment of caution, potentially hindering institutional adoption and large-scale investment in assets like ETH.
• NFT Market Cool-Down: The NFT market, which was a significant driver of ETH demand, has experienced a substantial cool-down from its peak in 2021-2022. While innovation continues, transaction volumes and average sale prices have fallen, reducing the ETH velocity associated with this sector.
Without a significant uptick in genuine network demand – more users transacting, more capital flowing into DeFi, a resurgence in NFT activity, or new killer dApps emerging – it becomes harder for ETH to absorb the ongoing supply issuance and stage a sustainable rally.
3. Weakened Burn Mechanics: The Diminished Impact of EIP-1559
EIP-1559, implemented in August 2021, was a landmark upgrade for Ethereum. It introduced a mechanism where a portion of every transaction fee (the "base fee") is burned, permanently removing that ETH from circulation. This was a key pillar of the "ultrasound money" narrative, as it created a deflationary pressure that could, under conditions of high network demand, outpace new ETH issuance.
However, the effectiveness of this burn mechanism is directly tied to network congestion and the level of the base fee.
• Lower Network Congestion: In periods of lower network activity and congestion (as has been observed more frequently recently), the base fee required to get transactions included in a block decreases. A lower base fee means less ETH is burned per transaction.
• Impact of Layer 2s: As more transaction activity shifts to Layer 2 scaling solutions, which have their own, typically much lower, fee structures, the demand for block space on Ethereum Layer 1 can decrease. While L2s do periodically batch transactions and settle them on L1 (consuming L1 gas and contributing to the burn), the overall L1 gas consumption directly attributable to individual user transactions might be lower than if all those transactions occurred on L1.
• Periods of Low Burn: Consequently, there have been extended periods post-Merge where the amount of ETH burned via EIP-1559 has been insufficient to offset the ETH issued as staking rewards. During these times, ETH's supply becomes net inflationary, undermining the deflationary narrative that was a strong catalyst in previous cycles.
While EIP-1559 remains a crucial and beneficial upgrade for Ethereum's fee market predictability, its power as a consistent deflationary force has been tempered by the current realities of network demand and the evolving Layer 2 landscape.
Synthesizing the Outlook: A Tug-of-War
The current situation for Ethereum is a complex tug-of-war. On one side, the historically low ETH/BTC ratio flashes a compelling "undervaluation" signal, suggesting a potential for significant upside based on past market behavior. This attracts traders looking for relative value plays and those who believe in Ethereum's long-term fundamental strengths.
On the other side, the fundamental picture is clouded by persistent, albeit reduced, supply issuance, a lack of explosive growth in network demand, and a burn mechanism whose deflationary impact is currently muted. These factors create genuine headwinds that could prevent ETH from easily replicating its past ratio-driven rallies.
For ETH to truly capitalize on its apparent undervaluation relative to Bitcoin, several things likely need to occur:
1. A Resurgence in Demand: This could come from a new "killer app" or narrative on Ethereum, a significant rebound in DeFi or NFT activity, increased institutional adoption (perhaps spurred by clearer regulation or new investment products like spot ETH ETFs in more jurisdictions), or a general improvement in macroeconomic conditions that boosts risk appetite.
2. Successful Maturation and Value Accrual from Layer 2s: As Layer 2 solutions mature and gain wider adoption, their success needs to translate into tangible value accrual for ETH itself. This could happen through increased L1 settlement demand, the use of ETH as a primary gas token on L2s, or innovative mechanisms that tie L2 economic activity back to the L1 token. EIP-4844 ("Proto-Danksharding") is a step in this direction by aiming to reduce L2 transaction costs, potentially fostering more L2 activity and, consequently, more L1 settlement.
3. A Shift in Broader Market Sentiment: Often, major altcoin rallies, including for ETH, occur after Bitcoin has established a strong uptrend and market sentiment becomes broadly bullish. A sustained Bitcoin rally could create a "wealth effect" and encourage capital to rotate into ETH and other altcoins.
Conclusion: Caution Warranted Despite Undervaluation Signals
While the ETH/BTC ratio strongly suggests that Ether is trading at a significant discount compared to Bitcoin, historical precedent alone may not be enough to guarantee a rally in the current market. The fundamental challenges posed by ongoing supply, relatively flat demand, and a less potent burn mechanism are significant and cannot be ignored.
Investors and traders eyeing ETH must weigh the allure of its apparent undervaluation against these tangible headwinds. A potential ETH rally is likely contingent not just on the ratio mean-reverting, but on a demonstrable improvement in Ethereum's core demand drivers and a favorable shift in the broader market environment. The "extremely undervalued" signal is a call for attention, but thorough due diligence and a clear understanding of the current complexities are more crucial than ever. Ethereum's long-term vision remains ambitious, but its path to reclaiming relative market dominance against Bitcoin in the near term appears more challenging than in previous cycles.

Bitcoin Hits $100K: Bull Run IgnitesWhat Tariff Shock? Bitcoin Surges Past $100K as Market Recovery Continues
The cryptocurrency market has been making headlines again as Bitcoin (BTC) surges past the $100,000 mark, signaling a robust recovery and potentially the start of a new bull cycle. In an environment marked by economic uncertainty, geopolitical tensions, and fluctuating central bank policies, Bitcoin’s remarkable resurgence has captured the attention of retail investors, institutional participants, and financial analysts alike.
This article delves into multiple facets of Bitcoin’s ongoing rally, including its recent rebound after a sharp drop, the role of whales in fueling the push toward $100K, the realized cap hitting a record high, and whether aggressive profit-taking by investors signifies a local top. Additionally, we’ll explore the implications of Bitcoin's return to $100K and why it hints at a "significant price move" that could shape the broader financial landscape.
________________________________________
Bitcoin Rebounds After Sharp Decline: The $100K Push
Bitcoin’s journey to $100,000 has been anything but smooth. After experiencing a sharp correction earlier in the year, many market participants feared that the cryptocurrency's bull run was over. However, Bitcoin's ability to rebound from its lows with renewed vigor has defied expectations.
Whales Drive the Rally
One key factor behind Bitcoin’s resurgence is the activity of "whales," large-scale investors who hold significant amounts of BTC. On-chain data reveals that whales have been accumulating Bitcoin during periods of lower prices, effectively acting as a stabilizing force during market downturns. By reducing liquidity in the market and concentrating their holdings, whales have created conditions conducive to a price surge.
In addition, whale wallets have been observed transferring large sums of Bitcoin out of exchanges and into cold storage, signaling a long-term bullish outlook. This withdrawal pattern reduces the supply of Bitcoin available for trading, increasing upward pressure on the price.
________________________________________
Realized Cap Hits Record High: A Bullish Signal
Another notable development supporting Bitcoin's rally is its realized capitalization (realized cap) hitting an all-time high. Unlike market capitalization, which multiplies the total supply of Bitcoin by the current price, the realized cap calculates the value of each Bitcoin at the price it was last moved. This metric provides a clearer picture of the aggregate cost basis of Bitcoin holders.
The realized cap reaching a record high indicates that a significant portion of Bitcoin has changed hands at higher price levels, reflecting increased investor confidence. This metric aligns with the narrative of accumulation, as both retail and institutional investors appear to be buying Bitcoin at higher prices in anticipation of future gains.
Accumulation Continues
On-chain analytics reveal that accumulation trends have persisted throughout Bitcoin's recovery. Wallet addresses holding between 1 and 10 BTC have grown substantially, showing that smaller investors are also entering the market. This broad-based accumulation not only adds to Bitcoin's bullish momentum but also reduces volatility by distributing supply across a wider range of participants.
________________________________________
Profit-Taking and Local Top Concerns
While Bitcoin's surge past $100,000 has been met with enthusiasm, some analysts caution that aggressive profit-taking by investors could signal a local top. Short-term holders, in particular, have been selling their Bitcoin to lock in gains, as evidenced by the increasing Spent Output Profit Ratio (SOPR).
Signs of a Local Top?
A high SOPR indicates that investors are realizing profits at a significant rate, which often coincides with price corrections. However, it’s important to note that profit-taking is a natural part of any market cycle and does not necessarily signal the end of a bull run. In fact, periods of consolidation and minor corrections can strengthen the foundation for a more sustainable rally.
Market sentiment, as measured by the Fear & Greed Index, has also entered the "Greed" zone, suggesting that bullish enthusiasm may be running high. Historically, extreme greed has preceded short-term pullbacks, making it crucial for investors to remain cautious.
________________________________________
New Bull Cycle? Bitcoin’s Return to $100K Hints at Significant Price Move
Bitcoin’s return to the $100,000 milestone has rekindled hopes of a new bull cycle, with analysts pointing to several factors that support this narrative. The cryptocurrency market has historically moved in cycles, driven by supply-demand dynamics, macroeconomic conditions, and technological advancements. The current environment appears to align with the early stages of a new bull phase.
Institutional Adoption and Macro Tailwinds
Institutional interest in Bitcoin has grown exponentially over the past few years. Major financial institutions, including hedge funds, pension funds, and publicly traded companies, have embraced Bitcoin as a hedge against inflation and a store of value. This influx of institutional capital has not only validated Bitcoin’s role as a legitimate asset class but also provided a steady source of demand.
Moreover, macroeconomic tailwinds such as high inflation, declining confidence in fiat currencies, and geopolitical instability have enhanced Bitcoin's appeal as a decentralized, non-sovereign asset. Central banks’ monetary policies, including quantitative easing and low interest rates, have further eroded the purchasing power of traditional currencies, driving investors toward Bitcoin.
Supply Shock and Halving Cycles
Bitcoin’s fixed supply of 21 million coins and its halving cycles play a crucial role in its price dynamics. The most recent halving in 2024 reduced the block reward for miners, effectively decreasing the rate at which new Bitcoin enters circulation. This supply shock, coupled with growing demand, has historically preceded significant price rallies.
On-chain data shows that long-term holders, who typically accumulate Bitcoin during bear markets, are now distributing their holdings during this bull phase. This redistribution of supply suggests that a new wave of investors is entering the market, further fueling the rally.
________________________________________
What’s Next for Bitcoin?
As Bitcoin continues to defy expectations, the question on everyone’s mind is: What’s next? While predicting Bitcoin’s price movements with precision is challenging, several scenarios could play out in the near term.
Scenario 1: Sustained Bull Run
If accumulation trends persist and institutional interest continues to grow, Bitcoin could maintain its upward trajectory, potentially reaching new all-time highs. Key resistance levels to watch include $120,000 and $150,000, which could serve as psychological barriers for further price appreciation.
Scenario 2: Short-Term Correction
A short-term correction is always a possibility, especially given the aggressive profit-taking observed in recent weeks. However, such corrections are often healthy for the market, allowing for consolidation and setting the stage for more sustainable growth.
Scenario 3: Macro-Driven Volatility
External factors, such as changes in monetary policy, regulatory developments, or geopolitical events, could introduce volatility to the market. While Bitcoin has shown resilience in the face of macroeconomic challenges, it remains sensitive to major news events.
________________________________________
Conclusion
Bitcoin’s surge past $100,000 marks a pivotal moment for the cryptocurrency market, signaling a robust recovery and the potential start of a new bull cycle. Driven by whale activity, record-high realized capitalization, and persistent accumulation, Bitcoin has defied skeptics and reasserted its dominance as the leading digital asset.
While concerns about a local top and profit-taking are valid, the broader trends suggest that Bitcoin is preparing for a significant price move. Whether this rally leads to sustained growth or faces temporary setbacks, one thing is clear: Bitcoin remains a transformative force in the financial world, offering a decentralized, inflation-resistant alternative to traditional assets.
As we look ahead, the combination of institutional adoption, macroeconomic tailwinds, and Bitcoin’s unique monetary policy positions it for continued success. For investors and enthusiasts, the journey to $100,000 and beyond is more than just a milestone—it’s a testament to the enduring promise of blockchain technology and the future of decentralized finance.

BTC/USDT Analysis: Resumption of a Full Bullish Trend
Hello everyone! This is CryptoRobotics' trader-analyst with the daily analysis.
Yesterday, Bitcoin finally broke the previous high. There was no false breakout or seller defense on higher timeframes, so the uptrend continues.
The next target is $105,000.
A local support zone has formed at $98,000–$97,200 after the breakout. So far, there are no signs of seller presence, but low volume remains a concern. Any strong surge in seller activity could trigger a significant correction.
Resistance zones:
$107,000–$109,000 (volume anomalies)
Support zones:
$98,000–$97,200 (local support)
$91,500–$90,000 (strong buy-side imbalance)
$88,100–$87,000 (absorption of market selling)
$85,500–$84,000 (accumulated volumes)
$82,700–$81,400 (volume zone)
Level $74,800
$69,000–$60,600 (accumulated volumes)
This publication is not financial advice.

Bitcoin showing itself to be the STRONGEST ASSET right nowThsi is a VERY Bold statement but there is a saying that we need to understand
CHARTS NEVER LIE
This chart is the 4 hour charts of
Bitcoin - Gold
DXY $ - S&P500
There are a number of things to see here.
The First and strongest sign is simply that Bitcoin has risen over the last 36 hours alongside the $ Rising.
This in itself is a huge sign. 80% of the time, these 2 assets go in opposite directions. To me, this is showing a weakness in Faith in the $,
With Lower interest rates, less return on Holding. However, the USa will not want to see the $ drop much further and so I imagine it is being bought up to safeguard its price.
Next week, on the 13th, we have inflation figures published.
We need to watch that Closely.
The $ is currently Lower than it has been for a long time and while this can be seen as a Negative, it has also made American goods cheaper to buy to Foreign Markets, while it has increased the value of other Currencies.
Making the $ cheaper is potentially a Good idea.
At the same time, we see the Global traditional "Safe Haven" Selling off.
The Daily CFD on Gold chart above it has formed a double Top, that usualy creates a draw down.
It is also overbought on a daily after its recent pushes higher.
But more than anything, with interest rates remainiiiiiiiiiiiiiiiiiing static, this has released pressure of investers and so Risk appetite is returning.
Again, we need to watch what happens around the 13th when USA inflation figures are released.
And then the S&P500
Overall, it has been dropping since Feb
This Daily chart shows us It made a recovery but this may not be to go to ATH again but more part of the ABC correction.
There is a possibility it could be forming an inverse Head and Shoulders...so, again, we watch
So, over all, what we see is BITCOIN taking on all the markets and making the biggest gains
It has certainly been the least volatile with Dips and Troughs shallower than the $ and S&P500 which is Stunning if you have ridden Bitcoin for the last 10 years....
Bitcoin has Matured in to a REAL Asset Class..
For me, it is NOT Crypto anymore.
.IT IS BITCOIN
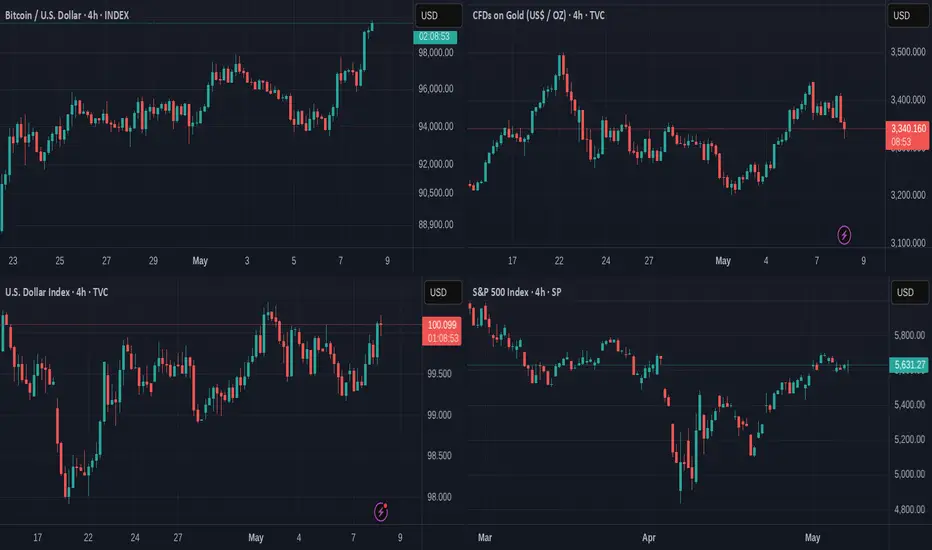
Bitcoin Daily Update - It is now the STRONGEST ASSET
The FED tells us that borrowing will remain as expensive as it was before, No change and so now, we see traders relax and BTC PA rises.
Bitcoin is now showing Huge strength, bang on time
The Blue Dashed line above is the current ATH and we may end up near there in the next few weeks, providing we keep momentum.
Before this, we may see PA slide down the top side of this red 236 Fib circle, using it as support while the Daily MACD cools off. The Daily MACD is not oversikd tghough, so can push higher yet.
PA also broke over the 2.628 Fib extension. It may not want to loose that.
We wait again but in confidence.
But that is not All - Look at this Chart
This is a 4 hour chart of
Bitcoin - Gold
DXY $ - S&P500
What is highly unusual here is how Bitcoin and the $ BOTH ROSE at the same time !
I will write more about this in another post but THIS Alone shows a Vast market swing and possibly a lack of faith in the $.
BUY BITCOIN AND HOLD

#Bitcoin's long-term road plan!-396 days Processed Between 2013 High and 2015 Bottom!
-365 days Processed Between 2017 High and 2018 Bottom!
-365 days Processed Between 2021 High and 2022 Bottom!
-1065 days processed between 2015 Bottom and 2017 Peak!
-1065 days processed between 2018 Bottom and 2021 Peak!
-1430 days Processed Between 2015 Bottom and 2018 Bottom!
-1430 days Processed Between 2018 Bottom and 2022 Bottom!
If the 1065 model is processed between 2022 Bottom and 2025 Peak, I think we will see a local peak in October.
If the 365 days Model is processed, I think we will see a 2025 Peak in October and a 2026 October Bottom.
I will be grateful if you appreciate...
