BTC Hits New All-Time High: Is a $128K Blow-Off Top Next?Bitcoin's Meteoric Ascent: New All-Time Highs Fuel $128K "Blow-Off Top" Predictions Amidst Unprecedented Adoption
The digital gold rush of the 21st century is reaching a fever pitch. Bitcoin (BTC), the pioneering cryptocurrency, has not only shattered previous records but is now tantalizingly close to new, stratospheric all-time highs, with analysts eyeing a potential "blow-off top" as high as $128,000. This electrifying surge, which saw BTC climb to within 1.5% of new peaks as bullish sentiment decisively overcame final resistance, is underpinned by a confluence of factors: soaring institutional and retail adoption, particularly in the United States, booming ETF inflows, growing political and regulatory support, and a shifting macroeconomic landscape that increasingly favors non-traditional assets. As of May 21, 2025, Bitcoin has firmly established itself above the $109,000 mark, a testament to its resilience and burgeoning mainstream acceptance.
The recent price action has been nothing short of spectacular. Bitcoin bulls have been relentlessly "grilling sellers," pushing the price to historic milestones. On May 21, 2025, Bitcoin etched a new all-time high (ATH) above $109,000, a landmark achievement that notably placed 100% of BTC holders into profit. This surge saw Bitcoin's market capitalization briefly surpass that of e-commerce giant Amazon, a symbolic victory highlighting its growing financial clout. Specific figures around this period include a climb to a record $109,302, and another peak at a historic $109,500, demonstrating the intense buying pressure and bullish conviction in the market. Analysts are now recalibrating their upside targets, with many calling for $116,000 as the next significant milestone on the path to even loftier valuations.
This bullish momentum isn't occurring in a vacuum. It's the culmination of years of development, increasing understanding, and a series of pivotal events that have collectively propelled Bitcoin into the financial limelight.
The American Bitcoin Boom: Adoption Surpasses Gold, Institutions Dive In
One of the most compelling narratives driving Bitcoin's current rally is its explosive growth in the United States. A staggering 50 million Americans now own Bitcoin, a figure that notably surpasses the 37 million gold holders in the country. This demographic shift signifies a profound change in investment preferences, particularly among younger generations who are increasingly comfortable with digital assets. Bitcoin is no longer a niche interest for tech enthusiasts; it's becoming a recognized component of diversified investment portfolios across a broad swathe of the American population.
The institutional embrace within the US is equally, if not more, impactful. US firms now hold an astonishing 94.8% of the Bitcoin reserves held by publicly traded companies globally. This concentration underscores the confidence American corporations have in Bitcoin as a treasury reserve asset, a hedge against inflation, and a potential source of significant returns. Furthermore, the United States is solidifying its position as the global epicenter of the Bitcoin industry, with 40% of all Bitcoin companies headquartered domestically. This robust ecosystem of miners, exchanges, wallet providers, and ancillary service companies fosters innovation and provides a strong foundation for continued growth.
The advent and subsequent success of Bitcoin Exchange Traded Funds (ETFs) have been a game-changer. These regulated financial products have opened the floodgates for a new wave of capital, allowing retail and institutional investors to gain exposure to Bitcoin through traditional brokerage accounts without the complexities of direct ownership and custody. The "booming ETF inflows" are a direct contributor to the recent price surge, creating sustained buying pressure and signaling widespread market acceptance.
Macroeconomic Tailwinds and Regulatory Optimism
Beyond direct adoption, broader economic and political factors are playing a crucial role. The recent new all-time high of $109,000 was notably set just nine days after the US and China closed a 90-day trade agreement. This resolution eased economic uncertainty and market jitters that had previously weighed on global markets. In such an environment, assets perceived as hedges against traditional market volatility or fiat currency devaluation, like Bitcoin and gold, often thrive. Indeed, concurrent with Bitcoin's rise, concerns such as Japan's debt woes have contributed to gold surpassing the $3,300 mark, indicating a broader flight to alternative stores of value.
Furthermore, there's growing optimism around US regulations concerning cryptocurrencies. While the regulatory landscape is still evolving, recent pronouncements and actions suggest a move towards greater clarity and a more accommodative stance, rather than outright prohibition. This "growing political support" is crucial for long-term institutional commitment, as regulatory uncertainty has historically been a significant barrier to entry for larger, more conservative investors. The fact that Bitcoin climbed to a record of $109,302, breaching a previous high set around the time of a major political event like a presidential inauguration (specifically referenced as Trump's inauguration on Jan. 20 in a historical context for a previous ATH), often correlates with market sentiment interpreting political or regulatory shifts as favorable.
The "Bitcoin Strategic Reserve" (BSR): A Paradigm Shift for National Economies?
An intriguing, albeit more speculative, concept gaining traction is the idea of a "Bitcoin Strategic Reserve" (BSR). While not yet a formal policy in any major nation, the discussion itself highlights Bitcoin's evolving perception from a purely speculative asset to one with potential strategic geopolitical and economic importance.
A BSR would involve a nation-state, such as the United States, acquiring and holding Bitcoin as part of its national reserves, much like it currently holds gold or foreign currencies. The rationale behind such a move could be multifaceted:
1. Hedging Against Fiat Devaluation: As central banks globally continue to engage in monetary expansion, concerns about the long-term purchasing power of fiat currencies persist. Bitcoin, with its fixed supply, offers a potential hedge against this inflation.
2. Participating in a New Financial System: If Bitcoin continues its trajectory towards becoming a globally recognized store of value or even a medium of exchange for certain international transactions, holding it in reserve would position a nation to participate actively in this emerging financial infrastructure.
3. Technological Leadership: For a country like the US, which already leads in Bitcoin company headquarters and corporate holdings, establishing a BSR could further cement its leadership in the digital asset space, attracting talent and capital.
4. Economic Resilience: In a future where digital currencies play a more significant role, a BSR could offer a degree of economic resilience and autonomy, reducing reliance on traditional financial systems or the currencies of other nations.
The implications of a major economic power like the US even seriously considering, let alone implementing, a BSR would be monumental for Bitcoin's legitimacy and price. It would signal ultimate institutional acceptance and could trigger a wave of similar considerations by other nations, creating immense demand for a limited supply of BTC. While the "Bitcoin Strategic Reserve Explained and What BSR Means for the US Economy" remains a topic of forward-looking discussion, its emergence in financial discourse is a testament to how far Bitcoin has come.
The Path to $128K: Understanding the "Blow-Off Top"
With Bitcoin having decisively broken past $109,000 and upside targets of $116,000 now in common parlance, the ultimate bull-case scenario being discussed is a "blow-off top" potentially reaching $128,000 or even higher.
A "blow-off top" is a chart pattern that signifies a steep and rapid price increase in an asset, often on high volume, followed by an equally sharp reversal. It typically occurs at the end of a prolonged bull market or a parabolic advance. The psychology behind it involves:
1. Euphoria and FOMO (Fear Of Missing Out): As prices accelerate, media attention intensifies, and stories of quick riches abound. This draws in a flood of retail investors who don't want to miss out on the gains.
2. Exhaustion of Buyers: The parabolic rise eventually becomes unsustainable. The last wave of enthusiastic buyers enters at or near the peak.
3. Smart Money Distribution: Experienced traders and institutions, who may have accumulated positions much lower, begin to sell into this heightened demand, taking profits.
4. Sharp Reversal: Once buying pressure is exhausted and selling pressure mounts, the price can fall dramatically as latecomers panic-sell and stop-losses are triggered.
Predicting the exact peak of a blow-off top is notoriously difficult. However, analysts use a combination of technical analysis (chart patterns, momentum indicators, Fibonacci extensions), on-chain data (network activity, holder behavior), and market sentiment to identify potential price targets and warning signs. The $128,000 figure is likely derived from such analyses, representing a significant psychological level or a projection based on previous market cycle behavior.
Navigating the Bull Market: Indicators for Identifying a Cycle Top
While the current sentiment is overwhelmingly bullish, savvy Bitcoin traders and investors are always mindful of market cycles and the potential for corrections or trend reversals. The question, "Is Bitcoin price close to a cycle top?" is one that prudent market participants constantly evaluate. Several indicators can help traders gauge whether a market might be overheating:
1. Moving Average Convergence Divergence (MACD): This trend-following momentum indicator can show bearish divergences, where the price makes new highs, but the MACD fails to do so, signaling weakening momentum.
2. Relative Strength Index (RSI): An RSI reading above 70 is generally considered overbought, and readings above 80 or 90 in a strong bull market can signal extreme conditions, though Bitcoin can remain overbought for extended periods. Bearish divergences on the RSI are also key.
3. On-Chain Metrics (e.g., MVRV Z-Score, Puell Multiple, SOPR):
o MVRV Z-Score (Market Value to Realized Value): Compares Bitcoin's market cap to its realized cap (the price at which each coin last moved). High Z-scores indicate the market cap is significantly higher than the average cost basis, suggesting the asset is overvalued and potentially near a top.
o Puell Multiple: Looks at the supply side of Bitcoin's economy – miners and their revenue. It divides the daily issuance value of bitcoins (in USD) by the 365-day moving average of daily issuance value. High values suggest miner profitability is high compared to historical norms, which has sometimes coincided with market tops.
o Spent Output Profit Ratio (SOPR): This indicates if holders are, on average, selling in profit or loss. Values significantly above 1 suggest holders are realizing substantial profits, which can increase sell pressure. A sustained drop below 1 after a peak can signal a shift in trend.
4. Logarithmic Growth Curves: Bitcoin's long-term price action has often respected logarithmic growth channels. When the price reaches the upper band of these channels, it has historically indicated a market top.
5. Funding Rates and Open Interest in Derivatives Markets: Extremely high positive funding rates on perpetual swaps indicate that an overwhelming number of traders are long and paying a premium to maintain those positions. This can signal excessive bullishness and a crowded trade, making the market vulnerable to a long squeeze if prices reverse. High open interest can also exacerbate volatility.
While Bitcoin is currently refusing to give up on its quest to revisit $108,000 (a level now surpassed) and beyond, concerns over a trend change, though perhaps quieter amidst the euphoria, are always present in the minds of seasoned investors. These indicators provide a more objective lens through which to assess the sustainability of the current rally.
The Road Ahead: Uncharted Territory with Immense Potential
As Bitcoin forges new all-time highs, it enters uncharted territory. The confluence of unprecedented US adoption, robust institutional investment via ETFs, a more favorable regulatory outlook, and supportive macroeconomic conditions has created a potent cocktail for price appreciation. The surpassing of Amazon's market cap, even if temporary, and the fact that 100% of BTC holders are in profit, are powerful psychological milestones that can fuel further confidence.
The predictions of a $116,000 interim target and a potential $128,000 blow-off top are no longer fringe theories but are being seriously discussed by mainstream analysts. The narrative of Bitcoin as "digital gold" is gaining more traction than ever, especially as traditional safe havens like gold also see increased interest amidst global economic uncertainties like Japan's debt situation.
However, the path is unlikely to be linear. Bitcoin's inherent volatility means that sharp corrections can and will occur, even within a broader uptrend. The "concerns over a trend change" will likely grow louder as prices reach more extreme levels, and profit-taking becomes more tempting. Investors should remain vigilant, utilize the available indicators to assess market conditions, and practice sound risk management.
In conclusion, May 2025 has marked a historic period for Bitcoin. Its surge above $109,000, driven by a powerful combination of fundamental adoption and favorable market dynamics, has set the stage for potentially even more dramatic price action. Whether the ultimate peak of this cycle is $116,000, $128,000, or another figure entirely, one thing is clear: Bitcoin has firmly cemented its place in the global financial landscape, and its journey is far from over. The coming weeks and months will be closely watched by investors worldwide as the world's preeminent cryptocurrency continues to redefine the boundaries of financial assets.
________________________________________
Disclaimer: This article is for informational purposes only, based on the provided snippets, and should not be considered financial advice. Investing in Bitcoin and other cryptocurrencies is highly speculative and carries a significant risk of loss. Past performance is not indicative of future results. Always conduct your own thorough research and consult with a qualified financial advisor before making any investment decisions.
Bitcoinlong

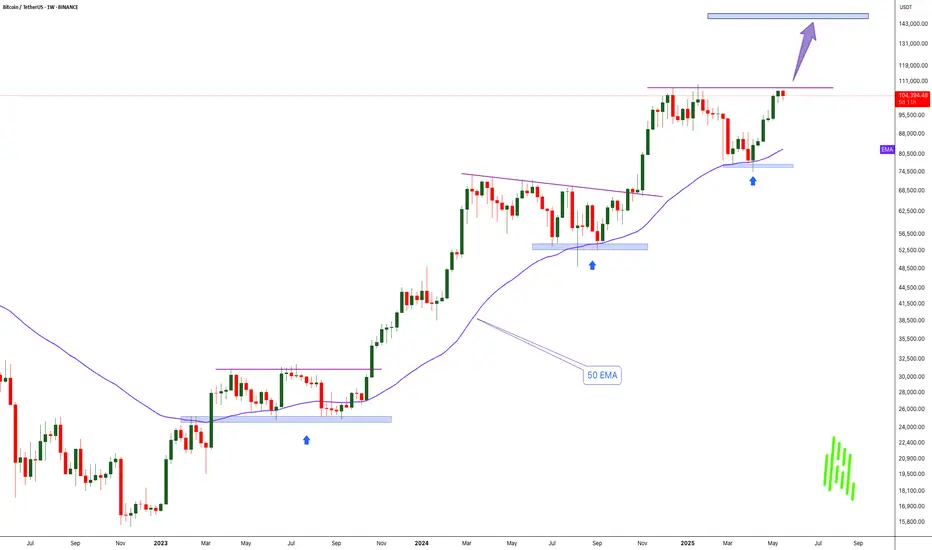
History Repeats: Bitcoin Bounces from Weekly 50 EMA-$150K Next!!MARKETSCOM:BITCOIN continues to show exceptional strength and bullish momentum. If we look back at the charts from 2023 and 2024, a clear pattern emerges — every time BINANCE:BTCUSDT touched the 50 EMA on the weekly chart, it led to a significant rally and eventually new all-time highs. That same setup seems to be unfolding again right now.
Recently, COINBASE:BTCUSD tested the 50 EMA around the $75,000 level and has since bounced strongly. The price has reclaimed the $100,000 mark and is now challenging previous all-time high resistance. Historically, after a successful bounce from this key moving average, Bitcoin hasn’t just recovered — it’s exploded to new highs.
Based on this repeating pattern, our current cycle target is set at $150,000. A clean breakout above the current resistance zone could be the catalyst that propels BYBIT:BTCUSDT Bitcoin into uncharted territory once again. The structure remains bullish, momentum is building, and the trend clearly favors the upside.
This is a classic “Buy and HODL” moment. The technicals are aligning, the market psychology is shifting, and all signs point toward a continued bull run. Buckle up — it looks like we’re in for another legendary Bitcoin rally.
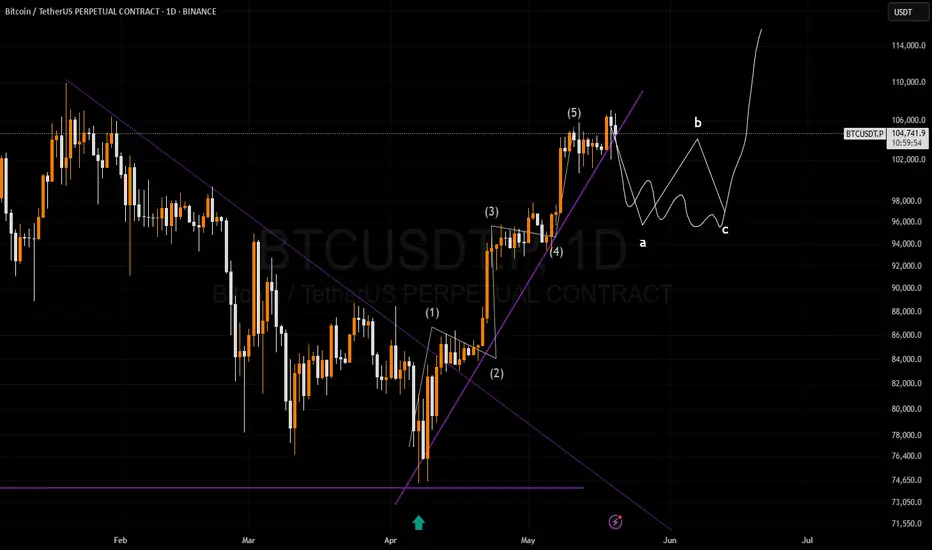
BTC new elliot ideaIf the trendline breaks, according to Elliott Wave theory, we might see an ABC correction form, and after completing wave 1, the market could rise again.
Well pk, Ending Diagonal, still the move is upUnpredictable Ending Diagonal But it is still up
Buy levels 104.600 / 104.100
Take Profits Levels 108.100 / 109.800
Trade Idea: BTCUSD (SELL STOP)BTCUSD Trade Setup Analysis
FUSIONMARKETS:BTCUSD
1. Trend Analysis
- Price Action: BTC is in a strong uptrend, with recent highs near **105,819.00**.
- RSI (14): 72.88** (approaching overbought, but no divergence yet).
- MACD: Bullish but showing potential slowing momentum (histogram decreasing).
- **Key Levels:**
- Support: 82,447.57 (previous resistance turned support).
- Resistance: 105,819.00 (current high).
2. Entry Precision
- Price Action: Recent rejection from **108,104.70** (lower high) with a drop to **104,834.80**.
- RSI (14): 58.39 (neutral, slight bearish bias).
- MACD: Bearish crossover (249.955 → 241.911).
- **Key Levels:**
- Resistance:108,104.70 (recent high).
- Support: 104,834.80 (immediate level).
3. Confluence
- Price Action: Downtrend in shorter timeframe, with price below **106,237.30**.
- RSI (14): 50.6 (neutral, leaning bearish).
- MACD: Positive but weakening (41.156).
- **Key Levels**:
- Resistance: 106,237.30 (recent high).
- Support: 102,928.15 (next key level).
---
**Trade Idea: Short-Term Bearish Pullback**
Entry:
- Short near 105,820.00 (daily resistance confluence with 15M rejection).
Stop Loss (SL):
- 106,300.00 (above recent 3M high)
Take Profit (TP):
- TP1: 104,834.80 (15M support, 1:2 RRR).
- TP2: 102,928.15 (3M support, 1:4 RRR). (IDEAL)

Bitcoin (BTC/USDT) - Support Trendline & Zone Price Test - DailyBitcoin (BTC/USDT) price recently rejected down from $107000 on May 19th, 2025.
The yellow Support Trendline below is currently being tested ($103000 price level).
Several candle body closes below the Support Trendline could signal weakness in the daily price trend (potential rising wedge pattern).
The April inverse head-and-shoulders price pattern and targets have been completed (+12% and +24%).
note: Breaking news, government law changes, corporate announcements, and crypto crime could affect the Bitcoin price and charts.

BITCOIN SCALP?.
here is my famous words to you guys from this book
;>>>Now a lot of people will be looking for sells from here, so if we know that. So
once we have a nice rejection from this double top and nice retrace, this looks
good for the majority of people, because price come up but we failed to break
above this DT or as we know a EQH.
We have got a nice retrace candle, which again retail love retrace candle,
because its showing potential move to the downside, and rejection from an
area.
So now that we have got a rejection from this DT, people are looking to sell
this, and when people are looking to sell at DT, where are their stop losses
going? Well they are going above the DT. But clearly they have going above the
DT.
Retail always put stops above DT or below DB, and then expect to move down.
So that is exactly why there is liquidity this areas. So that basically means that
a lot of stop losses are at this areas..
all traders on bitcoin would longs right. My target would be the 106k only for scalping.
Goodluck traders, see cap and charts. its the same on our EURUSD ideas right?
Grab it and take the trade. don't missed it. pewww

Bitcoin Analysis: Bullish Bias, But Waiting for a Smart Entry!🚀 BTCUSDT Outlook: Bullish Momentum, But Waiting for Value 📉💰
Bitcoin (BTCUSDT) continues to push higher, showing strong bullish momentum across the daily and 4H timeframes. That said, current price action appears to be overstretched—in my view, it’s trading well into premium territory 📈⚠️.
💡 Although I maintain a bullish outlook, I’m now eyeing a pullback toward a more balanced zone—ideally between the 50% to 61.8% Fibonacci retracement levels. This would bring BTC closer to equilibrium and offer a more strategic opportunity to engage with the trend.
🔎 In this video, we break down:
- The dominant trend and current structure
- How to identify potential market structure shifts
- My buy scenario, which depends on a retracement forming a bearish short-term move (e.g. on the 30-min chart), followed by a bullish break of structure 📊✅
🕒 Timing is everything. Let price unfold—we’re not predicting, we’re preparing. Entries should only be considered when price action confirms the scenario laid out in this video.
⚠️ Disclaimer:
This content is intended for educational purposes only and reflects my personal analysis and opinion. It is not financial advice. Always conduct your own research and use proper risk management.

BTC new Cycle has began so you can still catch it pretty much confirmed move
Wate for pullback to 105.800 and reentry
levels and meassures in the chart
Happy Trading Week
Bitcoin Stalls, But Chart Watchers Eye $300,000 Peak: Here's Whe
Bitcoin, the world's leading cryptocurrency, has experienced a period of consolidation, leaving investors and analysts alike pondering its next move. While the price has stalled below the $105,000 mark, a confluence of factors, including popular predictive models and bullish sentiment from prominent crypto analysts, suggests that a significant surge could be on the horizon. The potential for Bitcoin to reach new all-time highs, possibly soaring to between $275,000 and $300,000 by October of this year, is fueling excitement and speculation within the crypto community.
This article delves into the factors driving the bullish outlook for Bitcoin, examining the predictive models, analyst forecasts, and underlying fundamentals that support the possibility of a substantial price increase. We will explore the potential catalysts that could propel Bitcoin to new heights and analyze the technical indicators that chart watchers are monitoring closely.
Predictive Models Point to a Massive Surge
One of the primary drivers of the bullish sentiment surrounding Bitcoin is the existence of popular predictive models that suggest a massive price surge in the coming months. These models, often based on historical data, supply and demand dynamics, and other relevant factors, attempt to forecast the future price of Bitcoin with varying degrees of accuracy.
One such model, which has gained considerable attention in the crypto community, points to a potential surge to between $275,000 and $300,000 by October of this year. While the specifics of this model are not explicitly detailed in the prompt, it is likely based on factors such as Bitcoin's scarcity, its increasing adoption as a store of value, and the potential for institutional investment to drive demand.
It is important to note that predictive models are not foolproof and should not be taken as definitive guarantees of future price movements. However, they can provide valuable insights into potential scenarios and help investors make informed decisions.
Analyst Forecasts: $159,000 This Cycle
In addition to predictive models, bullish forecasts from prominent crypto analysts are also contributing to the optimistic outlook for Bitcoin. One analyst, in particular, has predicted that Bitcoin's price could reach $159,000 this cycle.
While the specific methodology used by this analyst is not detailed in the prompt, it is likely based on a combination of technical analysis, fundamental analysis, and market sentiment. Technical analysis involves studying price charts and other technical indicators to identify potential trends and patterns. Fundamental analysis involves evaluating the underlying value of Bitcoin based on factors such as its adoption rate, network security, and regulatory environment. Market sentiment involves gauging the overall mood and expectations of investors in the crypto market.
The analyst's forecast of $159,000 this cycle suggests a belief that Bitcoin is currently undervalued and that its price will eventually catch up to its intrinsic value.
Bitcoin IS The Opt Out
The phrase "Bitcoin IS The Opt Out" encapsulates a growing sentiment within the crypto community that Bitcoin represents a viable alternative to traditional financial systems. This sentiment is based on the belief that Bitcoin offers several advantages over traditional currencies and financial institutions:
• Decentralization: Bitcoin is not controlled by any single entity, such as a government or central bank. This decentralization makes it resistant to censorship and manipulation.
• Scarcity: Bitcoin has a limited supply of 21 million coins, which makes it a scarce asset. This scarcity is expected to drive its price higher over time as demand increases.
• Transparency: All Bitcoin transactions are recorded on a public ledger called the blockchain. This transparency makes it difficult to engage in illicit activities using Bitcoin.
• Security: The Bitcoin network is secured by cryptography, making it difficult to hack or tamper with.
The belief that Bitcoin offers a viable "opt out" from traditional financial systems is driving increased adoption and investment in the cryptocurrency.
BTC Price to $116K Next? 'Early Week' All-Time High
The prospect of Bitcoin reaching $116,000 in the near future, potentially even achieving an all-time high early in the week, is further fueling bullish sentiment. This forecast, attributed to a Bitcoin trader, suggests that the cryptocurrency is poised to break out of its current consolidation phase and enter a new period of price discovery.
The trader's forecast is likely based on technical analysis, identifying potential breakout patterns and momentum indicators that suggest an imminent surge in price. The expectation of an "early week" all-time high suggests a belief that the market is primed for a rapid and decisive move to the upside.
Leaving the Tight Range Behind
The statement that "Bitcoin is in line to leave its tight range behind in the coming days" suggests that the period of consolidation is nearing its end. A tight trading range typically indicates a period of indecision in the market, where buyers and sellers are evenly matched. However, such periods often precede significant price movements, as pent-up energy is released in one direction or another.
The expectation that Bitcoin will leave its tight range behind suggests a belief that the balance of power is shifting in favor of buyers, setting the stage for a potential breakout to the upside.
Retaking All-Time Highs and Pushing into Price Discovery
The ultimate goal for Bitcoin bulls is to see the cryptocurrency retake its all-time highs and push into price discovery. Price discovery refers to the process of establishing a new price level for an asset when it breaks out of its previous range.
When Bitcoin reaches a new all-time high, it enters a period of price discovery, where there are no historical resistance levels to impede its upward movement. This can lead to rapid and substantial price increases, as buyers are willing to pay higher and higher prices to acquire the asset.
Potential Catalysts for a Bitcoin Surge
Several potential catalysts could propel Bitcoin to new all-time highs and trigger a period of price discovery:
• Increased Institutional Investment: As more and more institutional investors, such as hedge funds, pension funds, and corporations, allocate capital to Bitcoin, demand for the cryptocurrency is likely to increase, driving its price higher.
• Regulatory Clarity: Greater regulatory clarity surrounding Bitcoin and other cryptocurrencies could remove a major source of uncertainty and encourage more investors to enter the market.
• Mainstream Adoption: As Bitcoin becomes more widely accepted as a form of payment and a store of value, its adoption rate is likely to increase, driving demand and price appreciation.
• Macroeconomic Factors: Macroeconomic factors, such as inflation, currency devaluation, and geopolitical instability, could drive investors to seek refuge in Bitcoin as a safe haven asset.
Technical Indicators to Watch
Chart watchers are closely monitoring several technical indicators to gauge the potential for a Bitcoin surge:
• Breakout Patterns: Identifying potential breakout patterns, such as ascending triangles, cup and handle formations, and flag patterns, can provide clues about when Bitcoin is likely to break out of its current range.
• Volume: Monitoring trading volume can help to confirm the validity of a breakout. A breakout accompanied by high volume is generally considered more reliable than a breakout accompanied by low volume.
• Momentum Indicators: Momentum indicators, such as the Relative Strength Index (RSI) and the Moving Average Convergence Divergence (MACD), can help to gauge the strength of a trend and identify potential overbought or oversold conditions.
• Support and Resistance Levels: Identifying key support and resistance levels can help to anticipate potential price movements and set appropriate entry and exit points.
Conclusion: Awaiting the Next Chapter in Bitcoin's Story
Bitcoin's recent period of consolidation has left investors and analysts eager to see what the future holds. While the price has stalled below $105,000, a confluence of factors, including predictive models, analyst forecasts, and bullish market sentiment, suggests that a significant surge could be on the horizon.
The potential for Bitcoin to reach new all-time highs, possibly soaring to between $275,000 and $300,000 by October of this year, is fueling excitement and speculation within the crypto community. Whether Bitcoin achieves these lofty targets remains to be seen, but the stage is set for what could be another exciting chapter in the cryptocurrency's story. As always, investors should conduct their own research, assess their risk tolerance, and make informed decisions before investing in Bitcoin or any other cryptocurrency. The journey ahead promises to be volatile, but the potential rewards could be substantial for those who are willing to navigate the risks.
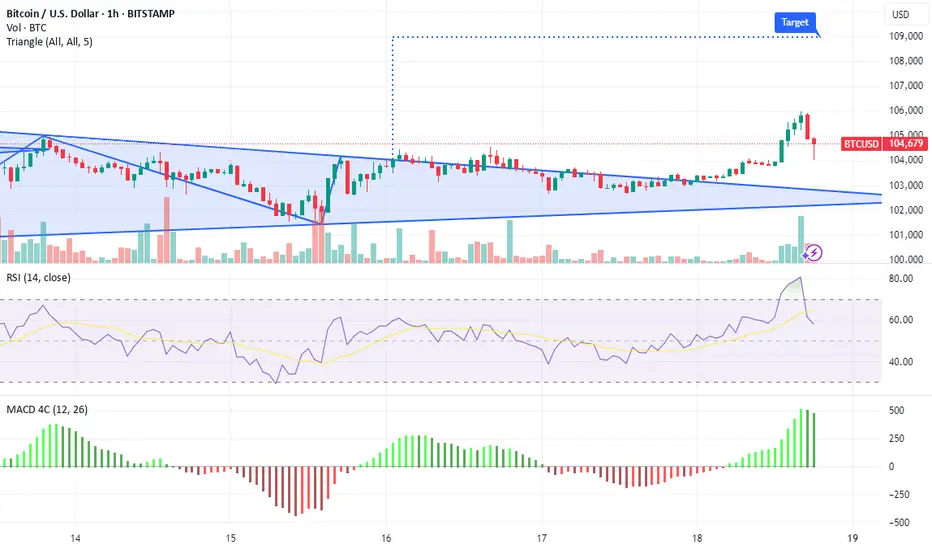
BTC perfect wick to wick symmetrical triangle - 109K or 98K You are looking at a 100% perfect wick to wick symmetrical triangle
Widest vertical range of the triangle from
Top wick: ~$105,700
Bottom wick: ~$100,700
Height = $5,000
Breakout level (horizontal mid-point of triangle):
Roughly $103,500 -104,000
Bullish Breakout Target:
$103,500 + $5,000 = $108,500
$104,00 + $5,000 = $109.000
108.5 to 109K will be your pure pattern target if BTC breaks to the upside with volume.
Bearish Breakdown Target: GETTEX:98K
FOR FUN I ASK CHAT GPT WHAT ARE THE ODDS WE BREAKOUT
Break Direction Target Confidence
Up (likely) $109,000 60–70%
Down (less likely) $98,000 10–15%

Bitcoin Remains BullishIn Still Buying BTC either from current leveld as and from 102.000 too
Targets 108.500 / 12.000

Bitcoin update 17th of mayhope you enjoy my analysis! Bitcoin has a sustainable Pa as for now and i'm expecting a big break out shortly!

Bitcoin Breakout Loading: Resistance Zone Under Pressure!!!Bitcoin ( BINANCE:BTCUSDT ) made the correction I expected , as I predicted in my previous idea .
Bitcoin is trading in the Resistance zone($103,320-$102,600) and near the Resistance lines . Given the momentum of the previous hour's candle and the fact that the previous three candles together formed a Morning Star Candlestick Reversal pattern , it is expected that the Resistance lines will be broken soon.
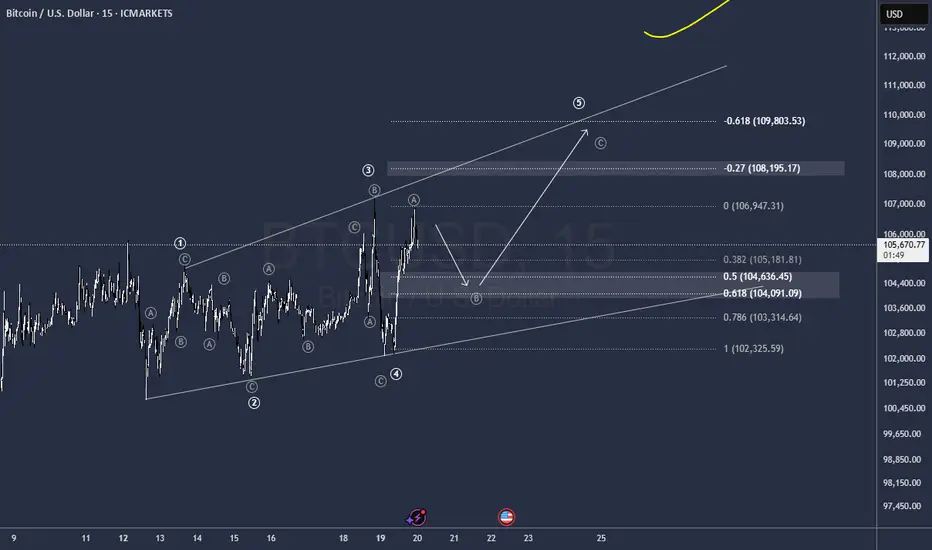
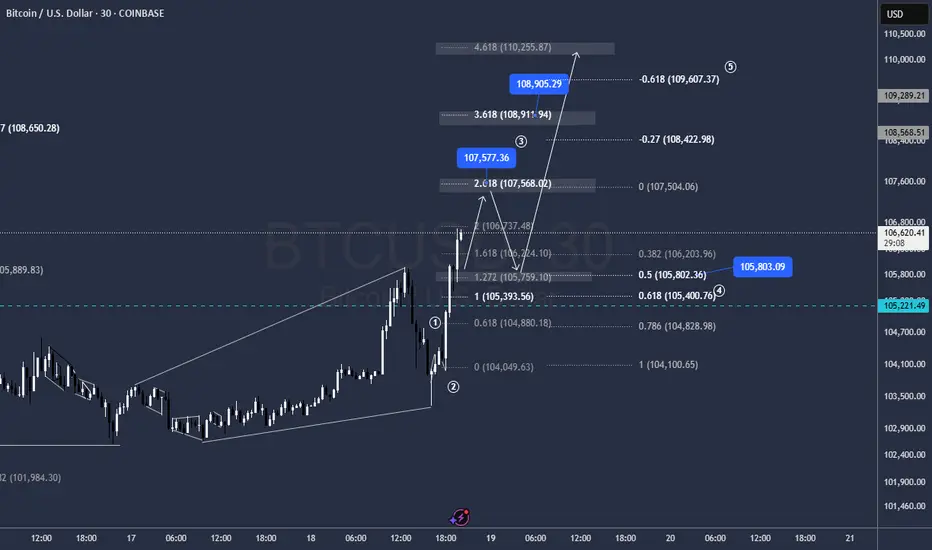
In terms of Elliott Wave theory , it looks like Bitcoin has completed the main wave 4 as I expected with a Zigzag Correction(ABC/5-3-5) . A break of the Resistance lines by Bitcoin could confirm the end of the main wave 4 .
Also, given Bitcoin's higher correlation with the S&P500 Index ( SP:SPX ) and the fact that I expect the S&P500 Index to increase , the increase in the S&P500 Index could help Bitcoin increase further .
I expect Bitcoin to break the Resistance zone($103,320-$102,600) and Resistance lines soon and attack towards the Resistance zone($105,100-$104,520) .
Cumulative Long Liquidation Leverage: $101,360-$100,600
Note: If Bitcoin falls below $101,280, we should expect further declines.
Please respect each other's ideas and express them politely if you agree or disagree.
Bitcoin Analyze (BTCUSDT), 1-hour time frame.
Be sure to follow the updated ideas.
Do not forget to put a Stop loss for your positions (For every position you want to open).
Please follow your strategy and updates; this is just my Idea, and I will gladly see your ideas in this post.
Please do not forget the ✅' like '✅ button 🙏😊 & Share it with your friends; thanks, and Trade safe.

Bitwise Bitcoin ETF | BITB | Long at $46.25It definitely should get everyone's attention when a US Senator (David McCormick) is willing to dish out up to $600,000 in a Bitcoin ETF ( AMEX:BITB ):
Feb. 27: Bought $50,000 to $100,000
Feb. 28: Bought $15,000 to $50,000
March 3: Bought $50,000 to $100,000
March 5: Bought $15,000 to $50,000
March 10: Bought $50,000 to $100,000
March 11: Bought $15,000 to $50,000
March 13: Bought $15,000 to $50,000
March 20: Bought $50,000 to $100,000
Something may be brewing this year with the "U.S. crypto reserve" and I'll throw down a couple grand at $46.25 with a self-proclaimed wild prediction into 2026: Bitcoin to $120,000.
Bitwise ETF Targets:
$50.00
$55.00
$60.00
$65.00

BITCOIN ON THE MORNINGAfter a long period of ups and downs that felt like an endless journey, my favorite formation has finally appeared the 'Cup and Handle.'
I just love it a perfect setup that gets the engines ready for a long flight toward 120.
After testing the low to high range and multiple rejections at the 103 level, all that’s needed now is a push from the giants to break the resistance — and from there, the sky’s the limit.
If you're looking for practical steps, here you go:
Entry: 100K
Breakout: 103K
First take profit: 110K
Final target: 120K
Safe travel this will be an exciting and especially fun journey.
Of course, nothing mentioned here is financial advice just my personal opinion!!!

BTC Strength Alert: Key Levels, Fibonacci & VolatilityBitcoin (BTCUSD) Strength Alert: Key Levels, Fibonacci & Volatility Point to Entry Opportunities
Bitcoin (BTCUSD) Technical Analysis: Navigating Strength and Volatility
Bitcoin (BTCUSD) continues to capture the attention of the global financial markets, demonstrating notable resilience and underlying strength. The current market structure suggests a period where bulls are actively defending key price thresholds, creating a fascinating technical landscape. This analysis will provide an in-depth examination of BTCUSD, focusing on its price action relative to significant psychological levels, the supportive role of Fibonacci retracements, characteristic volatility patterns, and strategic entry considerations based on bullish candlestick formations.
1. Introduction to Bitcoin and the BTCUSD Pair
Bitcoin, introduced in 2009, stands as the progenitor of cryptocurrencies, operating on a decentralized peer-to-peer network secured by cryptographic principles and recorded on a public distributed ledger known as the blockchain. It was designed as a digital alternative to traditional fiat currencies, free from central bank control. The BTCUSD pair represents the exchange rate between Bitcoin and the United States Dollar, making it one of the most liquid and heavily traded instruments in the digital asset space. Its price movements are a barometer for the broader cryptocurrency market sentiment and are influenced by a myriad of factors including adoption trends, regulatory news, macroeconomic developments, and technological advancements within the Bitcoin network itself. Understanding the technical dynamics of BTCUSD is crucial for traders, investors, and market analysts seeking to navigate its often-turbulent price swings.
2. Current Market Sentiment and Price Action: Holding Above Key Psychological Levels
A significant observation in the current BTCUSD market is its ability to maintain its footing above a key psychological price level. Such levels, often round numbers (e.g., $50,000, $60,000, or in this context, a hypothetical significant level like $100,000 if we assume a major bull run has occurred), act as important mental benchmarks for market participants. When price successfully breaks above such a level and subsequently holds it as support, it can signal a powerful shift in market sentiment. This behavior suggests that buyers are willing to step in and defend this new valuation, absorbing selling pressure and preventing a swift retracement.
The act of holding above a major psychological level often has a self-fulfilling prophecy component. As traders and algorithms identify this level as critical, buy orders tend to cluster around it, reinforcing its strength as a support zone. Conversely, if the price were to decisively break below such a level after holding above it, it could trigger a cascade of stop-loss orders and a rapid decline, indicating that the previous bullish conviction has waned. The current strength shown by Bitcoin in maintaining its position above such a noted psychological threshold is therefore a bullish indicator, suggesting underlying demand and a positive short-to-medium-term outlook, provided this support continues to hold. This resilience can build confidence among market participants, potentially attracting further capital inflow.
3. Fibonacci Retracement Analysis: Identifying Strong Support
Fibonacci retracement levels are a cornerstone of technical analysis, employed to identify potential areas of support and resistance. Derived from the Fibonacci sequence – a series of numbers where each number is the sum of the two preceding ones (0, 1, 1, 2, 3, 5, 8, 13, etc.) – the key retracement levels are 23.6%, 38.2%, 50%, 61.8%, and 78.6%. These percentages are applied to a prior price swing (from a significant low to a significant high in an uptrend, or vice-versa in a downtrend) to project areas where the price might pull back before resuming the primary trend.
The observation that Fibonacci retracement levels suggest strong support at current BTCUSD levels is particularly pertinent. When the market is in an uptrend and experiences a corrective pullback, traders watch these Fibonacci levels closely. The 38.2%, 50%, and 61.8% levels are often considered the most significant. A retracement to, and subsequent bounce from, one of these levels indicates that the correction is likely a healthy pause within a larger bullish trend, rather than a reversal.
If BTCUSD is currently finding support near a critical Fibonacci level, it implies that the preceding upward momentum was strong, and the current consolidation or minor pullback is being met with buying interest at a mathematically significant point. For example, if Bitcoin recently rallied from point A (low) to point B (high), and has now retraced to the 61.8% level of that rally and is holding, it's a classic sign that bulls are re-entering the market, viewing the pullback as a discounted buying opportunity. The confluence of a psychological level with a Fibonacci support level would create an even more potent support zone, significantly increasing the probability of a price bounce. Traders often look for candlestick confirmation at these Fibonacci levels before committing to a position.
4. Volatility Analysis: US Evening and Asian Morning Hours
Volatility is an inherent characteristic of Bitcoin, representing the degree of variation of its trading price series over time. The observation that BTCUSD volatility tends to increase during US evening and Asian morning hours is a valuable insight for strategic trade timing. This period typically corresponds to the overlap between the closing of the New York trading session and the opening of major Asian financial centers like Tokyo, Hong Kong, and Singapore.
Several factors contribute to this heightened volatility:
Market Overlap and Liquidity Shifts: As one major market winds down and another ramps up, there can be shifts in liquidity. The initial hours of the Asian session often bring fresh news, order flows, and participants, leading to price discovery and increased trading activity.
News Dissemination: Significant economic data releases, corporate earnings (for Bitcoin-related companies), or crypto-specific news from either the US (late announcements) or Asia can occur during these hours, directly impacting BTCUSD prices.
Algorithmic Trading: Many trading algorithms are programmed to react to specific inter-market conditions or news events, and their activity can amplify price movements during these transitional periods.
Derivatives Market Activity: The global nature of Bitcoin derivatives markets (futures, options) means that activity in these markets can influence spot prices around the clock. The US evening/Asian morning window sees active participation from traders in these regions.
For traders, this period of increased volatility presents both opportunities and risks. Opportunities arise from potentially larger price swings that can be capitalized upon with well-timed entries. Risks are elevated due to the potential for rapid price changes, which can trigger stop-losses or lead to slippage. Therefore, while these hours can be opportune for entry, they also demand heightened vigilance and robust risk management.
5. Entry Strategies: Volatility, Candlestick Patterns, and Timing
Leveraging the increased volatility during US evening and Asian morning hours for entry timing requires a methodical approach, primarily focusing on the confirmation provided by bullish candlestick patterns. Candlestick charts offer a visual representation of price movements and can signal shifts in market sentiment and potential reversals or continuations.
Key Bullish Candlestick Patterns for Entry Confirmation:
Hammer: Appearing after a downtrend, a Hammer is characterized by a small real body at the upper end of the trading range, with a long lower shadow (at least twice the size of the body) and little to no upper shadow. It indicates that sellers initially pushed prices down, but buyers stepped in strongly to drive prices back up near the open, suggesting a potential bottom and bullish reversal.
Inverted Hammer: Also a bottom reversal pattern, the Inverted Hammer has a small real body at the lower end of the trading range, a long upper shadow, and a short (or absent) lower shadow. It suggests that buyers attempted to push the price up, but sellers resisted. However, the fact that buyers showed strength is a tentative bullish sign, requiring further confirmation.
Bullish Engulfing: This is a powerful two-candle reversal pattern. The first candle is bearish (red/black), and the second candle is bullish (green/white) with a real body that completely "engulfs" the real body of the preceding bearish candle. It signifies that buying pressure has overwhelmed selling pressure.
Piercing Line: Another two-candle bullish reversal pattern seen after a downtrend. The first candle is a strong bearish candle. The second candle opens below the low of the first candle but then closes more than halfway up the real body of the first bearish candle. This indicates a significant shift in sentiment from bearish to bullish during the second candle's session.
Morning Star: A three-candle bullish reversal pattern. It begins with a long bearish candle, followed by a small-bodied candle (which can be bullish or bearish and ideally gaps down from the first candle), and then a long bullish candle that closes well into the body of the first bearish candle (ideally gapping up from the second candle). The small middle candle (the "star") represents indecision, and the strong bullish third candle confirms the reversal.
Three White Soldiers: This is a strong bullish continuation or reversal pattern consisting of three consecutive long-bodied bullish candles. Each candle should open within the body of the previous candle and close at or near its high, making progressively higher highs. It signals sustained buying pressure.
Strategic Entry Timing:
Monitor Volatile Periods: Be particularly attentive to price action during the US evening and Asian morning hours.
Identify Key Support: Note the psychological levels and Fibonacci retracement zones where BTCUSD is expected to find support.
Scan for Bullish Candlesticks: Look for the formation of one of the aforementioned bullish candlestick patterns (or others like Dojis at support, Bullish Harami) at or near these support levels during the identified volatile periods.
Seek Confirmation: Wait for the candlestick pattern to fully complete at the close of its period (e.g., end of the hour for an hourly chart). Some traders wait for the next candle to trade above the high of the bullish pattern for further confirmation.
Volume Analysis: Higher trading volume accompanying the formation of a bullish candlestick pattern adds to its reliability, indicating stronger conviction behind the buying pressure.
Context is Key: Bullish reversal patterns are most potent when they appear after a discernible pullback within a larger uptrend, or at the end of a consolidation phase near strong support.
By combining the timing advantage of predictable volatility spikes with the confirmation signals from bullish candlestick patterns at technically significant support levels, traders can refine their entry strategies for BTCUSD.
6. Other Key Technical Indicators for Comprehensive Analysis
While the core observations provide a strong foundation, incorporating other technical indicators can offer a more holistic view of BTCUSD's market dynamics:
Moving Averages (MAs): MAs smooth out price data to identify trend direction and potential support/resistance. The 50-day, 100-day, and 200-day SMAs (Simple Moving Averages) or EMAs (Exponential Moving Averages) are widely watched. Price trading above these MAs is generally bullish. Crossovers, like a "golden cross" (50-day MA crossing above the 200-day MA), are considered strong long-term bullish signals. Conversely, a "death cross" (50-day MA crossing below the 200-day MA) is bearish.
Relative Strength Index (RSI): This momentum oscillator measures the speed and change of price movements, ranging from 0 to 100. An RSI above 70 is often considered overbought (suggesting a potential pullback), while below 30 is oversold (suggesting a potential bounce). However, in strong trends, BTCUSD can remain in overbought or oversold territory for extended periods. Bullish or bearish divergences between price and RSI (e.g., price making a new high while RSI makes a lower high) can signal weakening momentum.
MACD (Moving Average Convergence Divergence): This trend-following momentum indicator consists of the MACD line and a signal line. A bullish crossover occurs when the MACD line crosses above the signal line, suggesting increasing upward momentum. A bearish crossover is the opposite. The MACD histogram visualizes the distance between the MACD and signal lines; a growing positive histogram is bullish.
Horizontal Support and Resistance Levels: Beyond Fibonacci, historical price action creates distinct support (price floor) and resistance (price ceiling) levels. These are areas where the price has previously reversed or consolidated. Identifying these levels on daily and weekly charts provides a broader map of potential turning points.
Trendlines and Channels: Drawing trendlines connecting successive lows (uptrend line) or highs (downtrend line) helps visualize the dominant trend. Price often respects these lines. Parallel trendlines can form channels, providing dynamic support and resistance boundaries. A break out of a well-established trendline or channel can signal a significant change in trend.
Volume Analysis: Trading volume is a critical confirming indicator. A price rally accompanied by increasing volume is generally seen as healthy and sustainable. Conversely, a rally on declining volume may indicate weakening conviction. Spikes in volume during breakouts above resistance or bounces from support add validity to the price move.
Integrating these indicators with the primary observations about psychological levels, Fibonacci support, and candlestick patterns during volatile periods can provide a more robust and nuanced trading framework.
7. Risk Management in Bitcoin Trading
The high volatility inherent in BTCUSD, while offering profit potential, also necessitates stringent risk management. Without it, traders expose themselves to significant losses. Key risk management practices include:
Stop-Loss Orders: Always define an exit point for a trade if it moves against you. A stop-loss order automatically closes a position when the price reaches a predetermined level, limiting potential losses.
Position Sizing: Determine the appropriate amount of capital to allocate to a single trade based on your overall portfolio size and risk tolerance. A common rule is to risk no more than 1-2% of trading capital on any individual trade.
Risk/Reward Ratio: Before entering a trade, assess the potential profit (reward) versus the potential loss (risk). Aim for trades where the potential reward is significantly greater than the risk (e.g., 2:1 or 3:1).
Diversification: While this analysis focuses on BTCUSD, traders should consider diversifying their overall crypto portfolio if they are investors, rather than concentrating all funds in one asset.
Emotional Discipline: Avoid making trading decisions based on fear (FUD - Fear, Uncertainty, Doubt) or greed (FOMO - Fear Of Missing Out). Stick to a well-defined trading plan.
8. Potential Future Outlook (Based on Technicals)
Based on the current technical posture where Bitcoin shows strength above a key psychological level and finds support at Fibonacci retracement zones, the outlook leans cautiously optimistic, contingent on these supports holding.
Bullish Scenario: If BTCUSD continues to respect these support levels, particularly during periods of consolidation, and bullish candlestick patterns during volatile US evening/Asian morning hours lead to upward impulses, further upside is likely. A sustained break above immediate overhead resistance, confirmed by volume, could see BTCUSD challenge its next major resistance zones and potentially trend towards new highs. The ongoing defense of psychological levels is paramount for this scenario.
Bearish Scenario: Should the identified support levels (psychological and Fibonacci) fail to hold, the outlook could shift. A decisive break below these supports, especially on increased selling volume, would indicate that sellers have gained control. This could lead to a deeper correction, targeting lower support structures and potentially invalidating the current bullish sentiment. Increased volatility during the US evening/Asian morning hours could, in this case, exacerbate downward moves if bearish patterns emerge.
9. Conclusion
The technical analysis of BTCUSD reveals a market displaying notable strength, characterized by its ability to hold above a significant psychological price point and find robust support at Fibonacci retracement levels. This underlying resilience is a positive sign for bulls. The tendency for volatility to surge during the US evening and Asian morning trading sessions presents strategic windows for traders, particularly when seeking entries confirmed by validated bullish candlestick patterns at these critical support junctures.
A comprehensive trading approach should also integrate other indicators like moving averages, RSI, MACD, and volume analysis to confirm signals and understand the broader market context. While the current technical setup suggests a favorable environment for bulls, the inherent volatility of Bitcoin demands disciplined risk management practices. Traders must remain vigilant, adapting their strategies to the evolving price action and ensuring that any bullish conviction is continuously validated by the market's behavior at these key technical inflection points. The interplay between these technical elements will be crucial in determining BTCUSD's trajectory in the near to medium term.

BTC | New ATH Incoming | + 135% ??A very interesting fractal from 2021 lead to a 135% increase - and a new all time high.
Bitcoin has been following similar patterns to the bullish twin-peaks in 2021. After a multi-month correction, the price proceeded to increase another 135% over the next few months. Some weeks fast, and some weeks sideways.
Is it possible that BTC follows a similar pattern - and increase another 135%, all the way to 170k?
Hec, I'd even be happy with just a 100% ! That would lead us up to around 149k, which can also be considered a phycological resistance zone.
While you're here! Check out this post on PEPE:
_________________
BINANCE:BTCUSDT


Bitcoin could reach as high as $250,000.I think Bitcoin could reach as high as $250,000 per coin in wave 5, as crypto often experiences extended fifth waves—similar to what we see in commodity markets like gold and silver. It’s possible for it to go even higher than this, but I believe $250,000 is a very realistic target.
As always, stay profitable.
– Dalin Anderson

BTCUSD , 1DPattern is looking very good , we can expect a very good move if the upper trendline will Break
wait until for the break of upper trendline
follow for more swing trade ideas

Pairing between BTC & Global Liquidity IndexSup everyone,
if you're active on twitter or have been looking around for crypto trade ideas you might have stumbled upon the Global Liquidity Index chart (at least I have).
I've stumbled upon it a few months back and have been testing it ever since, let me tell you what this chart is about:
The Global Liquidity Index basically measures how much money is flowing through global markets—think of it like the pulse of the financial system... traders and investors use it to get a sense of overall market conditions, liquidity availability, and risk appetite.
Now, here’s the cool thing: when you layer the Global Liquidity Index onto the Bitcoin chart, you notice something interesting— BITSTAMP:BTCUSD tends to react, but with a delay. Typically, there's about a 2-3 month lag. If global liquidity spikes or makes a sharp V-shaped recovery, Bitcoin usually mirrors this movement roughly 80 days later.
Why does this happen? Well, Bitcoin is a highly speculative asset, and institutions—especially banks—often wait to see solid liquidity signals before moving their capital into riskier assets like crypto. They prefer confirmation over speculation, which explains the delay.
So, in simple terms, by tracking global liquidity, you get a pretty useful heads-up about where Bitcoin might be headed a couple of months down the road.
The Global Liquidity Index is essentially a snapshot showing how much money central banks and financial institutions are injecting or pulling out of the global economy. Think of it like a big gauge tracking how "easy" or "tight" money conditions are worldwide.
It usually takes into account factors like:
Central Bank Policies: How much money central banks are printing or how they're changing interest rates.
Bank Reserves and Credit Availability: The amount banks can lend out, influencing how easily money flows through markets.
Government Spending and Stimulus: Fiscal policies injecting liquidity directly into the economy.
International Capital Flows: Money moving across borders, affecting global market liquidity.
When liquidity is abundant, there's more money sloshing around looking for places to invest. That typically pushes up asset prices—including speculative ones like Bitcoin—as investors seek higher returns. Conversely, when liquidity tightens (like when central banks raise interest rates or pull back stimulus), money becomes scarcer, risk appetite shrinks, and assets tend to dip.
So, when you're watching the Global Liquidity Index, you're basically monitoring how central banks and institutions are influencing market sentiment and investment behaviors, which eventually impacts speculative assets like Bitcoin—but with that notable delay we talked about earlier.
Practically speaking, here's how you apply the Global Liquidity Index to Bitcoin:
You watch for major turning points—peaks, bottoms, or sharp reversals—in global liquidity. Once you spot one, mark your calendar about 2–3 months forward (around 80 days). That’s usually when Bitcoin mirrors that move.
So, for instance, if the Global Liquidity Index sharply rebounds upward (a V-shaped recovery), you'd expect BTC to follow with a rally roughly two to three months later. On the flip side, if liquidity peaks and starts declining, it's a heads-up that Bitcoin could face downward pressure within the next few months.
This gives you a practical edge—you're essentially previewing BTC’s possible moves.
All things said, if you look at BTC's chart right now and apply the Global Liquidity Index to it you can see how the second has broken its previous high a few months back, but BTC yet has to break its, you can arrive to the conclusions here....
With no reversal in sight (for now) in the Global Liquidity Index, there don't seem to be signs of "spoofing", no case in which the index starts declining and so makes traders who know about this delay start to sell earlier than the delay.
End of the story - things look promising for BTC and you should definitely keep the Global Liquidity Index in your list of indicators.

Bitcoin is still following 2017 run. Surprising things to see
As many of you know, I have been referring This cycle of Bitcoin to that of the 2013 ->2017 bull run. And while PA has Fallen off and below the Fractal itself, we do still have one Very Major thing to see and it is a Good one.
So, the chart above has an arrow. This is pointing to Sep, Oct, Nov 2024.
See how PA pushed up to the "Neckline" of the Range and got rejected for 2 weeks.
A Red then Green Candles, on or below that "Neckline" and then Off it went.
We are currently just below the "Neckline" of this Range and we are currently printing a Red candle. It is early days but maybe we will repeat the same pattern.
There are reasons that I have explained in an earlier post today, that point towards a possible Red candle this week.
The other thing I want to show you on this subject is the MACD
This is a Daily MACD ( the main chart being Weekly) But while the actual PA of the MACD is different, I want you to see the Histogram. The Histogram shows us the % Difference between the MACD line ( yellow) and its Signal line ( Red)
Have a look at the the similarity the histogram pattern in 2024 ( arrow ) compared to this period Now.
The Large green Climb from a Low, the fall, the new smaller climb, the drop to Red and then a push higher.
OK, so the scale is different but, to me, it shows a similar pattern to the previous end of Ranging period.
We need to see if this pays out. If so, we will see a Red Histogram for a while..
This ties in with the ideas presented above on the PA patterns.
But overall this cycle, we do seem to be repeating patterns in a broad sense, with a larger scale currently. The larger scale of thispossible Red Histogram also plays into the idea mentioned at the end of this post.
So , what is the connection to the 2013 - 2017 Cycle.
Look at the upper trendline that has rejected PA since 2024. This is an OLD line of resistance from before 2017...
Lets look at a zoomed out chart
Look at that Arrow on the Left and that trend line.
It is the SAME LINE - Not only that, it rejected PA twice in late 2016 and 2017, before PA broke through and went on to reach a new ATH
So, Having seen this, I am happy to believe that we ARE Still following that 2013 -> 2017 Cycle pattern.
True, PA has fallen below the Fractel but we do seem to be repeating the Trend line Rejection, Dip, Rejection and........
You can also see how this same trend line, once crossed, is extremely strong support - infact we did not drop back below until July 2022, after another ATH
BUT, as ever, I look to BOTH sides and there is a chance we may see a stiffer rejection, IF we get rejected here again.
Should events dictate a further Drop in PA, we may see PA return to the next trend line below, around 82K. ( remember that Red Histogram pattern I mentioned earlier )
While this would Scare many, it would still play into the pattern we have been seeing.
2024 saw 3 major Rejections off its Neckline.
We have had 2 so far in 2025 and we are there right now, waiting to see what happens, with a RED candle. A Drop back to 82K would also reset the Daily MACD very nicely.
I remain Cautious and Bullish
what ever happens in the short term, I have little doubt about further pushes higher, maybe a LOT higher
