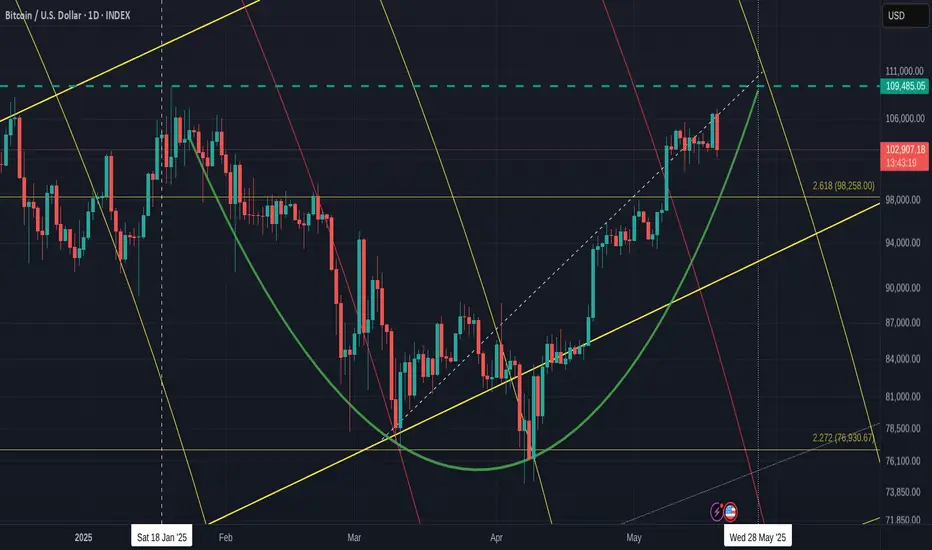
BITCOIN Daily Bullish / Bearish days ahaed with Big push after
Even though I have mentioned that we maybe in for some RED days this week, this chart shows how, ultimately, we are in a Bullish momentum still.
The CUP pattern that we have printed ( adjusted since I last posted this) , Goes from ATH line back to the ATH line.
We also see how there is this APEX that PA has fallen into that has its peak at the end of this month.
PA always reacts before the APEX
But before this, we may range across or drop down onto the CUP. This has Strong support and could possibly propel PA above thaT ATH line.
We do need to also understand, there is a 618 Fib circle at this intersection and that may not be easy to break through.
But PA has often searched out intersections of resistance to break through and so I am looking to this as the way forward.
The 2.618 Fib Ext on this chart may also offer support at around 98K if we loose support higher.
The RSI is already dropping from OverBought and so will probably continue to do so till we reach Neutral / Over Sold again.
And the Daily MACD, is also turning Bearish, But as mentioned before, this is possibly repeating what happened in Nv 2024
See the Arrow on the left...The Histogram is the one to take note of. Two Green peaks and then a red Dip
We have just begun the Red bit after the two Green peaks.
The scale is larger here and so we may have to wait longer till we return out of the green.
In 10 dayts, we will be near end of month
So, for me, this week will be possibly Red but towards the end of the month, things will begin to move higher.
All depends on PA following expected patterns and that does not always happen
We can only look, plan and react.
Bitcoinmacd
Bitcoin Weekly Closed GREEN -opens RED. Whats next ? After 6 consecutive Green Weeks, Bitcoin maybe about to Turn around and Cool for a bit.
BUT DO NOT PANIC
We have opened the week with a sharp drop back below the 2.618 Fib Extension. This in itself is a major move if unsurprising
Last week, we talked about this possibility by looking at the Daily MACD.
MACD Rising above the Signal line is a Bullish indication and Visa Versa
See the Arrow on the left, how MACD had 2 slight pullbacks and then went higher. This was in Nov 2024, just as the Ranging was finishing and PA was getting ready to push up to its Current ATH line
What I was looking at mostly though, was the Histogram. The Histogram shows us the distance between the MACD line ( yellow ) and its Signal line ( Red ) . The Bigger the bar, the bigger the difference between them.
See how it rose twice and then, went red for 2 days, recovered for a day and then , OFF WE WENT
And I am suggesting this is what may happen again.
So far, that pattern is repeating and the Histogram just went Red.
We may need to understand the difference in scale of this histogram though.
This could point towards a Week of unsettled PA, maybe Longer.
Notice how the MACD ( yellow) has now dropped below the Signal line ( red) as it did in Nov 2024.
During this period of MACD dropping and going red in 2024, we had 6 days of Red PA candles before the Bigger push higher. This may take longer this time but we have to wait and see.
We need to watch this close as the lines of support are in different place now.
If We zoom in on the Weekly PA chart, we see things a little more clearly
PA has fallen back below a line that was required as support. If you Look back to Nov 2024 area, we can also see a very Big difference in how PA is on the lines of support.
In 2024, we bounced off support.
We are currently being Rejected.
This Daily chart offers some more detail
The Circled area is the Nov 2024 area I been talking about.
Todays pull back is sharper but as we saw with the Histograms, we are in a bigger scale anyway
We could also see a similarity if we look back before the Circled area, see the W shape? A Double Bottom that appeared just before the push up.
Well, we just did that too.......If you back from where we are now, to the Low..There were 2 Dips down and then we pushed higher.
And, again, It is the scale that is Bigger.....
So, for me, this week maybe a bit bloody, but over all, Still Highly BULLISH
We need to regain that 2.618 Fib ext on this chart as support but that may not happen just yet.
There are "Local" lines of support near by and the LOG Daily chart I will post later gives some hope that Big Drops may not happen
The line of resistance just over head is strong and untill we break 112K and Hold it, we are likely to remain being bounced around.
But I do believe we Will do this and that we do seem to be repeating a pattern that led to a Goodpush higher.
We just have to wait and see
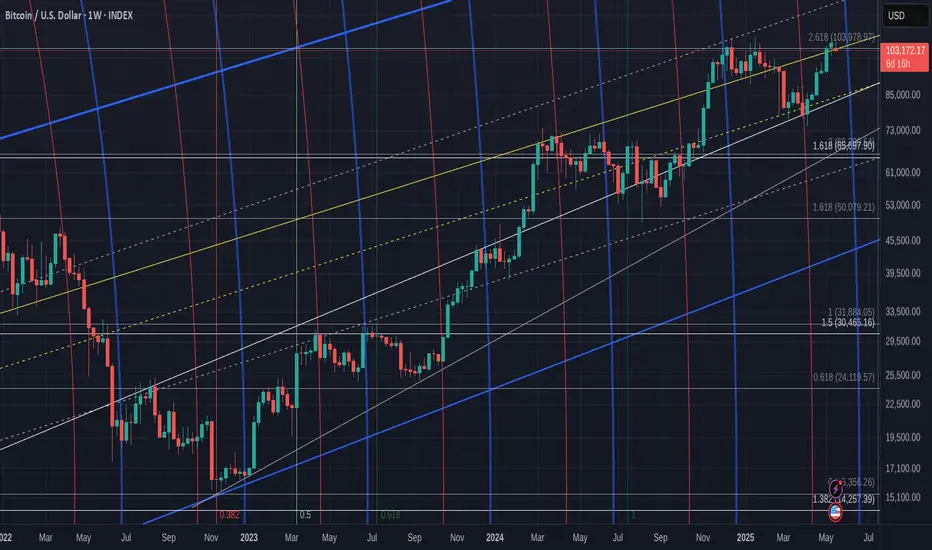
Bitcoin is still following 2017 run. Surprising things to see
As many of you know, I have been referring This cycle of Bitcoin to that of the 2013 ->2017 bull run. And while PA has Fallen off and below the Fractal itself, we do still have one Very Major thing to see and it is a Good one.
So, the chart above has an arrow. This is pointing to Sep, Oct, Nov 2024.
See how PA pushed up to the "Neckline" of the Range and got rejected for 2 weeks.
A Red then Green Candles, on or below that "Neckline" and then Off it went.
We are currently just below the "Neckline" of this Range and we are currently printing a Red candle. It is early days but maybe we will repeat the same pattern.
There are reasons that I have explained in an earlier post today, that point towards a possible Red candle this week.
The other thing I want to show you on this subject is the MACD
This is a Daily MACD ( the main chart being Weekly) But while the actual PA of the MACD is different, I want you to see the Histogram. The Histogram shows us the % Difference between the MACD line ( yellow) and its Signal line ( Red)
Have a look at the the similarity the histogram pattern in 2024 ( arrow ) compared to this period Now.
The Large green Climb from a Low, the fall, the new smaller climb, the drop to Red and then a push higher.
OK, so the scale is different but, to me, it shows a similar pattern to the previous end of Ranging period.
We need to see if this pays out. If so, we will see a Red Histogram for a while..
This ties in with the ideas presented above on the PA patterns.
But overall this cycle, we do seem to be repeating patterns in a broad sense, with a larger scale currently. The larger scale of thispossible Red Histogram also plays into the idea mentioned at the end of this post.
So , what is the connection to the 2013 - 2017 Cycle.
Look at the upper trendline that has rejected PA since 2024. This is an OLD line of resistance from before 2017...
Lets look at a zoomed out chart
Look at that Arrow on the Left and that trend line.
It is the SAME LINE - Not only that, it rejected PA twice in late 2016 and 2017, before PA broke through and went on to reach a new ATH
So, Having seen this, I am happy to believe that we ARE Still following that 2013 -> 2017 Cycle pattern.
True, PA has fallen below the Fractel but we do seem to be repeating the Trend line Rejection, Dip, Rejection and........
You can also see how this same trend line, once crossed, is extremely strong support - infact we did not drop back below until July 2022, after another ATH
BUT, as ever, I look to BOTH sides and there is a chance we may see a stiffer rejection, IF we get rejected here again.
Should events dictate a further Drop in PA, we may see PA return to the next trend line below, around 82K. ( remember that Red Histogram pattern I mentioned earlier )
While this would Scare many, it would still play into the pattern we have been seeing.
2024 saw 3 major Rejections off its Neckline.
We have had 2 so far in 2025 and we are there right now, waiting to see what happens, with a RED candle. A Drop back to 82K would also reset the Daily MACD very nicely.
I remain Cautious and Bullish
what ever happens in the short term, I have little doubt about further pushes higher, maybe a LOT higher

Bitcoin Daily update , MACD & RSI - whats possibility short Term
Bitcoin has reached above the next Fib circle. You can see how PA reacts to these by looking back
For me, I can see PA sliding down the 618 Circle we currently sit on until we reach that dashed line that shows the lower line of support of the rising channel.
We reach that around 17 May if we range sideways, slide along fib circle.
It could also be said that the 1.5 "local" Fib extension is what is offering Support here and the same date is used for when PA reached that dashed line of support.
Which ever option you choose, PA has support here and we should remain around this area unless the inflation figures released TODAY are not good
Why will PA range and not continue to Rise ?
RSI is up in overbought
This can range high and we need to watch and see if the RSI bounces of its own MA ( yellow line)
The Daily MACD is showing a desire to turn Bearish. for the 2nd time, it is curling over and not just pushing higher as previously.
This is NOT an over all Bearish signal to me but one that shows that PA is pushing hard against resistance. See how the histogram has reduced in size
The 4 hour MACD is still falling Bearish, recovering from the previous pushes.
In conclusion
The combination of a High RSI and Weakening MACD leads me to think that PA will Range across at best for a while, Till the 4 hour MACD reverses and climbs, Maybe with small Dips and Troughs.
If BTC Looses 100K, that is a big mental blow and I think the Bulls will try and avoid this.
However There is a possibility that we could drop back to the Low around 82K by the end of this month. I think this is a low possibility and I will post a report on this today but it is Good to look at all possibilities.
Long Term still Very BULLISH

Bitcoin, MACD and what we may get over the weekend - STILL BULLS
Just a quick post to explain how Ia m looking at this weekend with Bitcoin and I will use the MACD as amajor player here.
The BTC chart above is Daily, we can see the "Cuo " pattern, we can see the Long term rising Libne of support, we can see the red 236 Fib circle we shot through and the up coming 618 fib circle, that may or may not be trouble.
And that 2.618 Fib extension I can easily see us returning to to test as support.
WHY ?
The MACD on numerous timeframes...
What is MACD ?
MACD, short for Moving Average Convergence Divergence, is a technical indicator used in the analysis of securities prices. It was developed by Gerald Appel in the late 1970s and is widely used to identify changes in the strength, direction, momentum, and duration of a trend in a stock's price
OK, So, Lets start witht he 4 hour MACD -
I zoomed out on this a little so we can get a long term look at this and you can clearly see, we are already gettign near the High side, overbought levels where, historically, MACD turns Bearish, crosses over the Signal line ( red) and heads back down to cool off befoe heading higher again.
We are not yet as high as we were in Late April but it is not far off. Safe to assume this will turn down.
So now, lets see the Daily MACD
This is the daily MACD from around Nov last year and, again, we are heading into an area where it is prudent to be Bullish and Cautious.
Remember, the moves in the 4 hour are a lot quicker than the daily.
Go back and Look at the 4 hour, see where MAY began and what the MACD did in that time
See what that was on the Daily ? It was that little Blip on the rise up , that we are now continuing.
So, we have more room to go on the Daily.
and now the Master MACD, The WEEKLY ,the one that told us we were going to range in 2024, 2025 and will once again tell us when PA has reached Exhaustion later in this run
In this chart, you can see the 2 ATH's in 2021, you can see the Bear market and the recovery and everything ever since.
And you can also see that we have Still to cross the Signal line here to really enter a bullish state.
We have SO FAR to go here.....BUT with the high price now now have with BTC, it take more to push it higher. See how high MACD had to go to push PA up this last time ? The same height as it had to go in the 2024 push and yet we went twice as high on PA.
So, th be realistic here.....We are entering a bullish push but a $1 million BTC is NOT going to happen just yet.
SO, back to this weekend, the shorter term.
the 4 hour is high, already starting to turn as I write.
I can see BTC PA ranging or, maybe, as I said, testing the 2.518 as support at around 98K.
What people also need to watch os that BTC.D I talled about yesterday to guage if ALTS will Dip back lower or not.
Some alerady seem to be Dipping
SO, Bullish Caution for the weekend....Hang in there.....We only just begun

Bitcoin Daily - heading towards resistance with strength
Bitcoin is continuing to head towards that red 236 Fib circle while being Kept below the 2.618 Fib Extension
This could see PA Drop back to the 92K area where it will bump into the Cup shape it has created.
This Cup has strength . It has been tested 3 times previously and on each occasion, PA Bounced well off it
The overhead resistance and the Daily MACD are two reasons why this may happen
As you can see, the Daily MACD is touching its signal line, potentially Bearish but most likely only on a short term basis
But we should be ready incase things continue to turn Bearish, as it did before. See the rise in MACD on the left.
Not the similarity in the Histogram on both occasions.
Today, we have the DXY support group, otherwise known as the FED reserve, announcement on Rates.
This could trigger a move in either direction, depending on the choice.
Expectation is for Rates to remain unchanged
PA has the ability to move in both directions,.
We need to wait and see

Bitcoin Daily Bullish CUP pattern but with resistance coming in
Please excuse the number of lines here but this is my working chart and I am short of time but I wanted to share this.
Bitcoin Daily has printed a Bullish CUP and is back on the Rim but we have still to reach the edge of the Cup, which is expected around 15th May, 10 days. When PA entered thhis Cuo, it also ranged sideways for a while.....
Something that PA has to face in the near future is that red 236 fib circle. And PA may be already reacting to that.
Look to the left and see what happened last time we hit a red 236 fib circle.
I think we are in a stronger position this time though but a Drop to the Long term rising trend line is a very real possibility
That is around 92K - > 87K -Not a Major drop and it would actually play into the Bulls hands by resetting the Daily MACD that is already beginning to turn slightly Bearish
This is NOT a reason to PANIC or Sell but is more an opportunity, maybe the last one, to Buy BTC at around this price.
I think a drop back down to the 2.272 Fib extension at 77K is highly unlikely but we should have a plan should this happen.
We do have the DXY support group, sorry, THE FED announcing the Next decision of Rates on 7th and it is very likely that PA will Drop till then, slowly hopefully, resetting the MACD as previously mentioned, and then push through that 236 Fib circle after the continued Freeze on Rates is announced.
We have to wait and see......

Bitcoin Long is Overcrowded TradeSentiment is king in much of crypto and foreign exchange trading. This is mainly due to the fact that hedge funds, banks, and other financial institutions own all of the data on trader's positions and then can leverage that data by betting against the trend or the crowd to profit handsomely. Data from IG though can now give us a window into crowd sentiment. If you take a look at Daily FX's Bitcoin sentiment index, you can find that 79 percent of clients of about 1200 in total polled are net long on Bitcoin. However, they still weight this as a bullish signal due to the change in sentiment being that less traders are net long now than what they were last week. Because the weight changes as time progresses, this may change. I suspect given the positive sentiment that this indicator will eventually flash bearish.
I also have picked a few technicals to back this view up that the trend is shifting bearish. First, almost a dozen exponential moving averages from 25 day to 90 day are now in the red. Moreover, the awesome oscillator and MACD also suggest the tides are turning. Even though this is the case, it is not necessarily a shoe in. Bitcoin price action could move on a dime as it tends to succumb to dramatic price fluctuations over a very short period of time increasing the standard deviation of price, increasing beta, or in other words increasing risk.
In short, my bias has always been to short Bitcoin. Sentiment and a few technicals now just provides further evidence for this. If you would like to take a look at the Daily FX sentiment index, you can find it here: www.dailyfx.com and if you would like to take a look at any more of my analysis in longer form, you can check out my website at www.anthonylaurence.wordpress.com
