The profitability of TA trading rules in the Bitcoin market█ The profitability of technical trading rules in the Bitcoin market
The Bitcoin market, known for its wild fluctuations, poses a unique challenge for traders: Is it possible to consistently profit using technical trading rules?
Recent research analyzing Bitcoin's price data from July 2010 to January 2019 has shed light on this question, focusing on the effectiveness of seven trend-following indicators.
The research was conducted by Gerritsen et al. Notably, the trading range breakout rule emerged as a promising strategy, often outperforming the traditional buy-and-hold approach.
█ Some Background into the Bitcoin Market
Bitcoin's price path suggests market inefficiency, likely due to its short history and the erratic behaviors of market participants. Previous studies on Bitcoin's efficiency mainly focused on its predictability from a random walk perspective, leaving the performance of technical trading rules on Bitcoin prices largely unexplored.
The core aim of this study is to examine the profitability of technical trading rules, specifically to determine if these rules can surpass a basic buy-and-hold strategy.
By applying seven well-documented trading rules and analyzing their performance through the Sharpe ratio, the study seeks to provide practical insights for Bitcoin traders.
█ Methodology
The study uses daily price data from July 17, 2010, to December 31, 2018, totaling 3,084 daily observations. Gerritsen and team removed a brief period in 2011 due to a Mt. Gox hack and integrated data from Coinmarketcap starting April 28, 2013. The research also considers the risk-free rate, using 3-month US Treasury bill returns for its analysis.
█ Trading Rules Analyzed
1. Moving Averages (MA): This strategy issues buy signals when the recent price or its short-term average exceeds a longer-term average and sell signals in the opposite scenario. It tested combinations like 1-day vs. 50-day, 2-day vs 150-day, and 5-day vs 200-day averages.
2. Trading Range Breakout (TRB): It looks for price breakouts beyond the highest and lowest prices of a predefined period (50, 150, 200 days), signaling buys for breakouts above the high and sells below the low.
3. Moving Average Convergence Divergence (MACD): The MACD rule uses two exponential moving averages (EMAs), and triggers buy signals when the MACD line (the difference between a 12-day and a 26-day EMA) is above zero, and sell signals when it is below zero. It also examines the MACD signal line and MACD histogram as additional signals.
4. Rate of Change (ROC): This rule compares the current price with the price n days ago (commonly 10 days) to determine market momentum and issue buy/sell signals. The rule suggests buying when the ROC is positive, indicating upward momentum, and selling when it is negative, indicating downward momentum.
5. On-Balance-Volume (OBV): This volume-based indicator predicts price movements based on volume flow, asserting that volume changes precede price changes. The study applied MA rules to the OBV to generate signals, buying when the short-term MA of OBV crosses the long-term MA from below, and selling when it crosses from above.
6. Relative Strength Index (RSI): A momentum oscillator that identifies overbought or oversold conditions, suggesting buy signals when below 30 and sell signals above 70.
7. Bollinger Bands (BB): This strategy uses a moving average with upper and lower bands based on standard deviations from the MA, issuing buy signals when the price touches the lower band and sell signals at the upper band.
█ Strategies and Evaluation
The study applied each trading rule in three distinct strategies:
Literal Interpretation: Buying or selling Bitcoin directly based on the signal, including short positions.
Long Positions Only: Considering only buy signals due to the practical challenges of shorting Bitcoin on many exchanges.
Default Long Position with Adjustment on Signals: Maintaining a default long position, doubling investment on buy signals, and moving to risk-free assets on sell signals.
The performance of these strategies was evaluated using the Sharpe ratio, comparing the excess returns of the trading strategies over the risk-free rate to their volatility. A higher Sharpe ratio indicates a more efficient risk-adjusted return. The study used bootstrapping to assess the statistical significance of the Sharpe ratio differences between each trading rule strategy and a benchmark buy-and-hold strategy.
█ Key Findings
The study finds mixed results across different technical trading strategies when applied to Bitcoin.
Notably, the trading range breakout (TRB) rule consistently offers higher Sharpe ratios than a buy-and-hold strategy, signifying its superior performance.
On average, TRB strategies yield a Sharpe ratio of around 0.08, marking them as statistically significant against the buy-and-hold benchmark. This rule's success is further highlighted in specific periods, such as 2011–2012, 2013–2014, and 2017–2018, where its Sharpe ratios were notably higher than those of the buy-and-hold approach. The significant outperformance in these periods underscores the TRB rule's adaptability to market dynamics.
While most other technical trading rules did not consistently outperform the buy-and-hold strategy, certain strategies like MACD showed significant outperformance in specific applications (Strategy 2), illustrating the nuanced effectiveness of technical trading rules in the Bitcoin market.
Counter-trend indicators, such as the Relative Strength Index and Bollinger Bands, generally underperformed compared to the buy-and-hold benchmark, sometimes yielding negative Sharpe ratios.
█ Sensitivity to Market Conditions
The effectiveness of the TRB strategy, in particular, seems to be highly dependent on the prevailing market conditions. During periods of strong trends (either bull or bear markets), the TRB rule demonstrated notable outperformance.
However, during more stable periods, like 2015–2016, the TRB rule and most other trading rules did not show a significant advantage over the buy-and-hold strategy, aligning with the adaptive market hypothesis suggesting that the performance of trading strategies is contingent upon environmental factors.
█ Limitations and Future Research
One notable limitation is the focus solely on Bitcoin, leaving the question of whether these findings can be generalized to other cryptocurrencies.
Additionally, the analysis does not account for transaction costs, potentially affecting the trading strategies' profitability. Future research is encouraged to extend the investigation to other leading cryptocurrencies and to consider the impact of transaction costs on the profitability of the trading range breakout rule and other technical trading strategies.
█ Reference
Gerritsen, D.F., et al. (xxxx). The profitability of technical trading rules in the Bitcoin market. Finance Research Letters, xxx(x), xxx-xxx.
-----------------
Disclaimer
This is an educational study for entertainment purposes only.
The information in my Scripts/Indicators/Ideas/Algos/Systems does not constitute financial advice or a solicitation to buy or sell securities. I will not accept liability for any loss or damage, including without limitation any loss of profit, which may arise directly or indirectly from the use of or reliance on such information.
All investments involve risk, and the past performance of a security, industry, sector, market, financial product, trading strategy, backtest, or individual's trading does not guarantee future results or returns. Investors are fully responsible for any investment decisions they make. Such decisions should be based solely on evaluating their financial circumstances, investment objectives, risk tolerance, and liquidity needs.
My Scripts/Indicators/Ideas/Algos/Systems are only for educational purposes!
Bitcoinmarket

Bitcoin post-Halving: Possible ScenariosFor those of you who don't know me, I have two obsessions in life: AI and cryptocurrencies. Not necessarily in this order.
With the BTC Halving, I decided to explore the possible future scenarios—and to analyze the behavior of BTC during the past halvings. Here are some observations—of course, I can be wrong:
𝐇𝐢𝐬𝐭𝐨𝐫𝐢𝐜𝐚𝐥 𝐏𝐫𝐢𝐜𝐞 𝐌𝐨𝐯𝐞𝐦𝐞𝐧𝐭𝐬:
Post-halving, the price trajectory has shown notable patterns:
• After the first halving in 2012, BTC price skyrocketed by approximately 9,900%, peaking about a year later.
• The second halving in 2016 led to a price increase of about 2,946%, taking 17 months to reach its peak.
• Following the third halving in 2020, the increase was more subdued at around 679%, with the peak occurring 17 months later.
𝐄𝐯𝐨𝐥𝐯𝐢𝐧𝐠 𝐌𝐚𝐫𝐤𝐞𝐭 𝐃𝐲𝐧𝐚𝐦𝐢𝐜𝐬:
The form of the price line across these halvings demonstrates a market that is evolving and becoming more resilient.
Each post-halving period shows a gradual slowing down of volatility and price spikes, suggesting an increasing influence of institutional investors who tend to have longer investment horizons and more strategic approaches.
This trend indicates a shift from speculative retail behavior to a more stabilized and mature market.
𝐅𝐮𝐭𝐮𝐫𝐞 𝐏𝐫𝐞𝐝𝐢𝐜𝐭𝐢𝐨𝐧𝐬:
In the short run, there should be a correction. This might lead the price of BTC below $60,000. However, it seems that the cycle wasn't complete, and the sideways movement right before the halving was just a short "test" that resulted in a short accumulation phase.
Since the cycle wasn't completed, BTC should at least reach $128,000 in the coming months; however, be aware that the real downfall might still be yet to come!

BTC short term possible movementsBTC / USDT
BTC is still following my projection since my last idea :
What next ?
In LTF BTC is forming a range with 2 main levels 69k and 58k and potential falling wedge
According to liquidity pool in this area …High chance we will see one of this movements soon
This week is critical for altcoins market
Scenario 1 VS scenario 2 or do u have another opinion..share with us

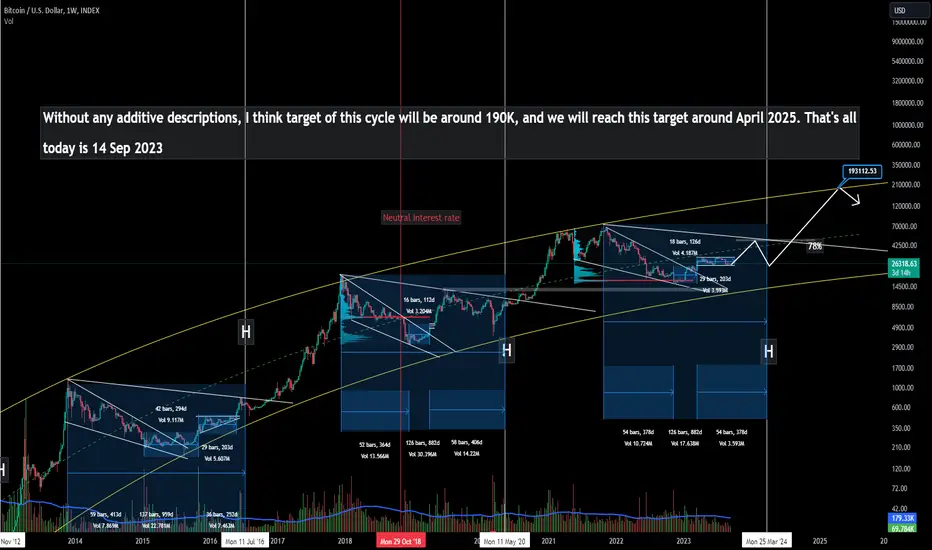
My expectation for Bitcoin for next 2 years Without any additive descriptions, I think target of this cycle will be around 190K, and we will reach this target around April 2025. That's all
BITCOIN mid week Update - 24/01/24Hello everyone,
Im back with just quick update to Monday pre-Market idea
__________________________________________________
So, as expected we went lower really close to our Sellside t1.
Price didnt touch our t1 box, but if you trade with Trailing Take Profit, you should be taking some profit-% off the table at this point.
Today and Tommorow, there should be volatility coming so I would be very carefull about Opening NEW trades.
Remember, ITS NOT SHAME TO NOT BE IN TRADE!
Its always better to wait for setup which is favourable FOR YOU!
At this MOMENT, Im observing price on lower time frames to decide if there is highier possibility of REVERSING on Daily time frame... So we possible could run up to 42-44k$ IF news later today favour that move... OR we can not work above smaller time frame Buyside liquidity targets, and we keep going LOWER as we was expecting...
In my opinion, RIGHT NOW, is very hard to make CALL if we go lower/highier TODAY, since we already went LOW enought on weekly basis without any liquidity drivers, so there is good chance for swept on other side. Thats why I suggest to be VERY CAREFULL and if you decide participate before news, you should use tight STOP LOSS for your own good.
I'll make next update when I will be more certain about which way we keep moving further.
Hopefully, this helps some of you with your perception of market.
If YES, please consider liking or sharing this post, it would mean a lot for me. Thanks
Joe

#Bitcoin - thoughts out loud #12Good evening from Ukraine!
Dear colleagues, I am glad to welcome you!
Work plan.
Because it is necessary.
There may be a slight deviation.
Thank you all for your attention, I wish you success.
Sometimes you win/sometimes you learn.
- thoughts out loud
- thoughts out loud
- thoughts out loud
P.S.
...Think positive)

BTCUSDT ShortBitcoin has been forming a rising flag for the past few days, reaching its new year high at 38800.
I am anticipating that the price will rebound from this HH, and the formation of the rising flag might be a strong indication of a bearish pullback.
My entry point for this trade is 38200, SL at 38600 and TP at 37600 as the R:R is 1:2.
Remember, only risk 1-2% of your account.

Bitcoin Will hit above 38.4 According to CMEBTC hit 38.4 over CME chart that I shown.we could see bitcoin itself follows the CME shoes for a higher liquidity grab at 38.8 or even low 39K.
Thanks for watching

Bitcoin Might Retest The Highs One More Time.Bitcoin hit our target from our last video on a short squeez then came back down to retest the resistance of our descending broadening wedge as a support.With this successful retest we could see another retest at the highs
Thanks for watching

BTC consolidation ends today according to the patternsBitcoin showing multiple sell signals shows its consolidation wants to end and maybe go to touch the lows.

3 Scenario Outcome for BitcoinSpeculation is just that, only speculation. Ideas to guide your trading and/or investing journey. I put a good amount of time in researching and charting over the last year to specifically develop this thesis. I hope you enjoy and please like and share, even if it's to ridicule my analysis!
With that said, it looks like there are three scenarios that are 'most' likely to play out over the next 2 years:
Scenario 1: Worst case (Red Path). Bitcoin ETF's are denied and/or a major market crash happens beginning Dec '23 or Q1/Q2 '24. Targets are the lower channel back at bear market bottom, the Value area low (Blue) & nPOC (naked point of control sitting above VAL) or below, to include CME gaps of a. 20.3k b. 9.7k & c. 3k at the very worst. 12k bears will rejoice. I for one will be selling the farm and my first born at 9k or below.
Scenario 2. Bitcoin ETF delays (Orange Path). The range continues with a top off near the Macro VAH at about where price stands as of today, 11/11/23 @ 37k-39k. Price would most likely seek to validate back to fair value at 32k, and then retest down to 20.3k for the CME gap fill creating one of the most powerful patterns as an inverse head and shoulders. Given the channels, this seems the most likely with an upside target to the VAH again near dump of April/May '22 and now resistance at 48k. Target is summer of '24.
Scenario 3. Moon boy status (Green Path). This means the Bitcoin ETF was approved prior to any fundamental problems (ie FTX 2.0, WW3, declared depression, etc) and no need to wait for price to come down past 32k, possibly ever.
B. There is the possibility of a priced in ETF scenario that allows for the channel to stay valid. In this case, if price action does not moon over 48k up to ATH's, it likely sets a re-accumulation zone above 48k, playing within the upper channel, with a last dip into the 30k's before we see ATH's.
Either way, Bitcoin is ready to rock and roll.
Now to the less juicy part of this bull run. Give the diminishing returns as most assets have as they age, it looks like 100k is going to be the biggest and baddest of all resistance from a percentage standpoint. Gone are the days of 33k% gains. From the top of each market cycle to the next top we go from over 1k% to now 250-ish% last cycle.
Here's where I 'm at from a charting and fundamental stance:
Bitcoin gets a 44-54% blow off top (Shown in price range) from previous ATH's up to 100k-ish. If it's more, great, sell because you've been stacking or you're long. Buy your lambo, more power to you. However, given the current M2 issue, loan maturations (refinancing in '25 from 2.9% to almost 5%) as well as the overall credit and savings crisis, Bitcoin's blow off top could be in the 80-88k range. That would put the total market crypto cap at ATH's of 3.5-4 Trillion range. If Chairman Powell decides to turn the printers on for 2025, then some of the moon boi's out there may see 150k, so we all win anyway from a plebs perspective. #Stackon

Bitcoin Moday And Weekly Analysis.Will Consolidation End ?Bitcoin showing Sell Signals a lot. but still holding the range and consolidating.We could see a pullback or a retracement happening this week
Thanks for watching

Bitcoin Will Sweep Both Sides Today Before The Main MoveBitcoin been conslidating in a tight range building both Sell and buy side liquidity.with FOMC today its a good possibility we grab both sides liqs before making any major move.
Thanks for watching

Long trade setup for KNCUSDTFor the BINANCE:KNCUSDT.P Long Trade Setup, the following values are suitable for our interval trade:
Entry: 0.6415
Target: 0.6935
Stop: 0.6048
Cost Reduction: -
The profit is reasonable relative to the risk.

Long trade setup for SFPUSDTFor the BINANCE:SFPUSDT.P Long Trade Setup, the following values are suitable for our interval trade:
Entry: 0.6196
Target: 0.6317
Stop: 0.5953
Cost Reduction: 6065
The profit is reasonable relative to the risk.

Bitcoin retrace before the push up Following today's developments involving Bitcoin and the circulating ETF misinformation, I anticipate a temporary pullback in the price of Bitcoin, followed by a potential upward surge, possibly reaching new highs. This is my two-week market outlook.

Long trade setup for TUSDTFor the BINANCE:TUSDT.P Long Trade Setup, the following values are suitable for our interval trade:
Entry: 0.02211
Target: 0.02477
Stop: 0.02074
Cost Reduction: 0.02095. The profit is reasonable relative to the risk.

Bitcoin getting weaker.More downside untill 26.8bitcoin last liquidity grab at 30K made a new extreme and now btc sell pressure is building up.will we see 26.8 at the end of this week?
Thanks for watching

Bitcoin Hit 28.8 Target.Is The Rally Over ?BTC hits a major level 28.8 and holding it.usually these major levels become support the first time we touch them but we could see lower.
Thanks for watching

Bitcoin Holding 30K.Soon To Go To 32.6!!Bitcoin holding 30K over the weekend with Ascending triangle pattern forming on 4H. possible breakout to the upside and then retest above the daily close for continuation to the upside.
Some Alts Looking Insanly Bullish.
Thanks for Watching

Bitcoin Moving To 32K.Will Volatility Continues Today ?Bitcoin broke out of the pennant as we expected and hit our dashed navy line again but this time without heavy rejection.Is this the signal of a move to new highs ? 32K Imminent IMO.
Thanks for watching

Bitcoin 32K This Week Then Huge Rejection Will FollowBitcoin spiked up to 31K yesterday triggering lots of Stop losses and grabbing liquidity,making the way to the upside clear for today.first 32K touch will have a nice rejection in my opinion
Thanks for watching

Bitcoin Could Break 31K Today Despite The Sell SignalsBitcoin Bounced Back from key level and now is trying to move up. will it break 31K or the Sell Signals were the sign of reversal ? two new bearish patterns emerged too which could get invalidated today if we go above 31.4
Thanks for watching and buckleup for a move
