BTC faces resistance at 29.9K.Will it retest or fall back down?*** DISCLAIMER No Financial Advice ***
Bitcoin retraced backup with the microsoft and google beating earnings but NQ1 still didnt respond because the earnings was post market.
So today it could go a little bit higher which will get btc around 29.8K hitting the white bold line and making a new high OR we could jebait and continue the dump
Bottom line is that crypto & stock markets are super bearish, and any upside move is a jebait or short squeez.
Please consider supporting me by Boost,Comment,Follow and sharing the video
Bitcoinmarkets


Bitcoin short-term target 28800!1h time frame
-
Bitcoin will probably create a potential inverse head and shoulders here, which neckline is 27880.
If this structure perfectly form, the target will be 28700~28800.

Bitcoin | Head and Shoulders
Well, well, well, look who's got their head in the game and their shoulders above the rest! You've spotted the head and shoulders pattern on the chart, and now you're ready to shoulder your way to success!
After closely analyzing a chart, you noticed a distinct pattern that caught your attention: the head and shoulders pattern. This technical analysis pattern is characterized by a peak (the "head") that is flanked by two smaller peaks on either side (the "shoulders"), creating a visual shape that resembles a human head and shoulders. The pattern is often seen as a sign of a trend reversal, and can be used by traders to make informed decisions about buying and selling. By identifying this pattern on the chart, you have gained valuable insight into the market and can use it to inform your investment strategy.
While technical analysis patterns can be a useful tool for traders, there are also risks involved. Here are some potential risks of trading patterns:
False signals: Technical patterns can sometimes generate false signals, which can lead to incorrect trading decisions. For example, a pattern may appear to be forming but then fails to materialize, or a pattern may appear to indicate a certain trend but then reverses unexpectedly.
Over-reliance on patterns: Relying too heavily on technical patterns can lead traders to overlook other important market factors, such as economic indicators, company news, and geopolitical events. It's important to consider a variety of factors when making trading decisions.
Limited information: Patterns are based solely on historical price and volume data, which may not provide a complete picture of the market. Traders may miss out on important contextual information that could impact their trades.
Market volatility: Markets can be volatile, and patterns may not always hold up in such conditions. Traders need to be prepared for sudden shifts in the market that could disrupt their trades.
Emotional biases: Trading patterns can sometimes trigger emotional responses in traders, such as greed or fear, which can lead to poor decision-making. It's important to stay objective and rational when analyzing patterns and making trades.
Overall, while trading patterns can be a useful tool for traders, it's important to approach them with a critical eye and to consider a variety of factors when making trading decisions.

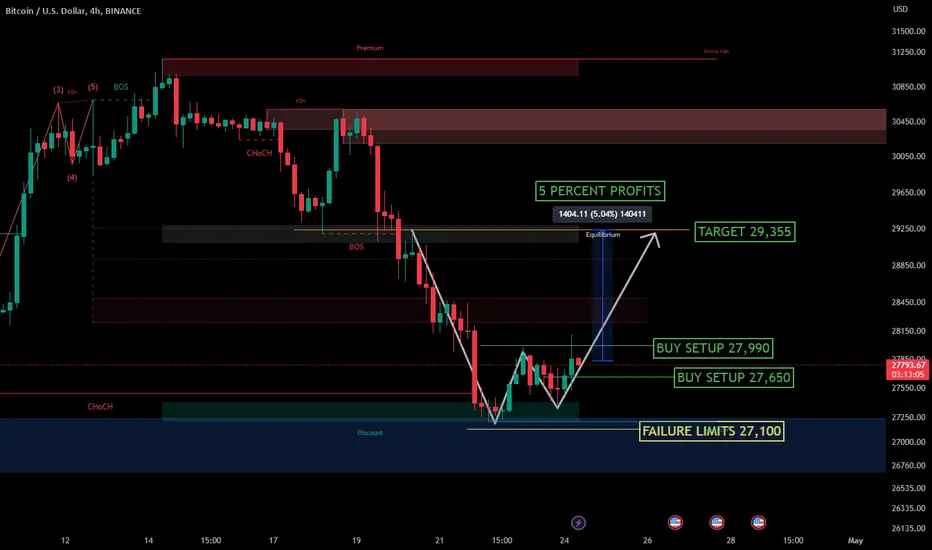
[BTCUSD] BITCOIN SCALPING STRATEGYTheVision:
We see bitcoin has a short-term strategy for trade right now with a percentage profit of 5%.
#disclaimeron
BTC Bitcoin Potential Retracement Price TargetBTC Bitcoin Potential Retracement to the next support level of $25170.
That is my price target for the next week!
Looking forward to read your opinion about it.

#BTC 15MinIn small timeframe Bitcoin startet little bullish move.
After 1H Candle close above we can spot this Falling Channel (Bullish)
Price respected our Support and bounce!
Waiting to see another move and try to break $28085 Resistance!

Bitcoin BTC Price Targets after the Ethereum Shanghai upgradeEthereum’s Shanghai upgrade is scheduled to launch on April 12.
The upgrade will make more than 18 million ether, worth approximately $34Billion, withdrawable, possibly causing a sudden crypto market supply dump.
This is my scenario for Bitcoin:
BTC /USDT short:
Entry Range: $30000 - $30900
Price Target 1: HKEX:26600
Price Target 2: $25300
Price Target 3: HKEX:23200
Stop Loss: $33500

Key Areas for Bitcoin: High probability reversal zonesI've marked three potential key support areas of Bitcoin. The areas marked are demand zones created by volume. There can be a fake bounce upwards once the price will reach those zones. Enter the trade only after a successful validation.

Bitcoin under Bearish Falling Wedge #Bitcoin 4hr #TA at #Binance
Bitcoin April month movements majority into 30k to 29k and at present it starts trends into #Bearish #FallingWedge Pattern and Soon April-May-June will be under #BearishZone pattern likewise of those patternic nos....
31 30 28 30 27 25 26 24 21 19 17
Also, Some Dangerous No's...
16 15 13 12 11 10 9 7...
🙏🐦🙏

Bitcoin Forecast For Next MonthIn this Idea Im sharing Bitcoin analysis based on technical analysis must do your own research before taking any decision

Bitcoin -> Please Don't PanicHello Traders,
welcome to this free and educational multi-timeframe technical analysis .
On the weekly timeframe you can see that Bitcoin just retested and already rejected a quite obvious previous weekly support zone which was now turned resistance exactly at the HKEX:30 ,000 area.
As mentioned in my last analysis linked below, after a 90% pump over the past couple of weeks a short term correction was quite likely and maybe Bitcoin will also retest the $24,000 level from which I then do expect a next rally towards the upside.
On the daily timeframe you can see that Bitcoin is currently already retesting a previous daily support zone at the HKEX:27 ,000 area so after we get some bullish confirmation, we could already see a short term rally towards the upside from here.
Thank you for watching and I will see you tomorrow!
You can also check out my previous analysis of this asset:

[BTC/USD] BITCOIN WILL HIT 41000 AROUND THE END OF THE YEARTheVision predicts Bitcoin will hit 41,000 USD around the end of 2023 or maybe the beginning of 2024.
Traders can use the vision with the buy area on the chart with a disclaimer first.

#BTC 1H ChartIt's time to play some Candlestick Chart
In 1H TF we can see 3 specified candles, in case we see close above good sight for bulls, in the opposed site bears will still be in control

Bitcoin On the Verge of FallIs Bitcoin finished on falling for now? Or is it gonna dip to 26,000.00? Still no confirmation but there's two sideways of it!

Liquidity Grab Towards Relative Equal Lows and Equilibrium PriceBTC is correcting towards its relative equal lows. In trading, relative equal lows refer to the occurrence of two or more lows in the price of a security that are approximately at the same level. These lows are considered "relative" because they are compared to other lows that have occurred in the recent past.
If a security has formed two or more lows at roughly the same level, it suggests that there is a level of support at that price point, and traders may see this as an opportunity to buy the security at a potentially favourable price. However, it's important to note that just because a security has formed relative equal lows does not necessarily mean that the price will continue to rise, and traders should always consider other factors such as market trends, news, and economic indicators before making a trading decision.
The Fibonacci 0.5 level is often considered as a midpoint or equilibrium point in price movements. However, it is important to note that it is not a fixed or absolute level and should not be relied upon solely as a trading signal. The Fibonacci retracement levels are used in conjunction with other technical analysis tools and indicators to identify potential support and resistance levels, as well as entry and exit points for trades. Therefore, while the Fibonacci 0.5 level may provide some information about price equilibrium, it is only one factor to consider in a comprehensive analysis of market conditions.

* BTCUSD TP HIT ** Here we can see clearly how My previous post on BTCUSD SELL Setup Soon, has worked perfectly accordingly to my analysis,
* Well done to whoever took the trade with us,
* Keep your eyes close on your trading journey,
* Happy pip hunting traders.
* FX KILLA *

Bitcoin Long setup 1:4RR Target 30800- Still uptrend on Daily and 4H timeframe
- Confluences are FIB 50%, Random trendlines, resistance to support zone, 200Moving average, and 1H engulfing

SHORT TO TIMEZONE, BUY REVERSE TRENDProjected buy entry time line is between 21th April to 15th May 2023
Correction floor is expected between this timezone
Price range to expect a turning point is between 13432 to 16627
Price range must align with projected timeline for a stronger turning point.
So first trade is a sell entry with TP on any of the two projected timelines
Trade 2 is a buy and hold entry with first at 34400.
Use reasonable stoploss according to risk

Bitcoin to continue in a selloff? Bitcoin - 24h expiry - We look to Sell at 28997 (stop at 29697)
We are trading at overbought extremes. Prices have reacted from 30987.
A Doji style candle has been posted from the high.
A break of the recent low at 29020 should result in a further move lower.
We look for losses to be extended today.
Our profit targets will be 27247 and 26847
Resistance: 29500 / 30000 / 30450
Support: 29020 / 28400 / 28000
Please be advised that the information presented on TradingView is provided to Vantage (‘Vantage Global Limited’, ‘we’) by a third-party provider (‘Signal Centre’). Please be reminded that you are solely responsible for the trading decisions on your account. There is a very high degree of risk involved in trading. Any information and/or content is intended entirely for research, educational and informational purposes only and does not constitute investment or consultation advice or investment strategy. The information is not tailored to the investment needs of any specific person and therefore does not involve a consideration of any of the investment objectives, financial situation or needs of any viewer that may receive it. Kindly also note that past performance is not a reliable indicator of future results. Actual results may differ materially from those anticipated in forward-looking or past performance statements. We assume no liability as to the accuracy or completeness of any of the information and/or content provided herein and the Company cannot be held responsible for any omission, mistake nor for any loss or damage including without limitation to any loss of profit which may arise from reliance on any information supplied by Signal Centre.

#Bitcoin - thoughts out loud #18!!! IT IS IMPORTANT TO READ THE DESCRIPTION !!!
Good evening, we are from Ukraine !
I want to continue my opinion and vision of the current situation on the cryptocurrency market on the example of this asset.
After the false breakout and liquidity withdrawal, I would like to draw special attention to the increased volumes and the price's rapid return to trading margin. At the moment, this is not enough, there is no confirmation. At this stage of the situation, we can partially open a position (5-10%). Then monitor the situation and add the rest of the volume if the buyer's test is successful and there is activity from professional operators, i.e., the asset needs a force to move the price to the next liquidity (price range 23300 - 24300 ).
The mood is long, that's the only way.
If the current situation does not meet the current criteria, I expect the asset to depreciate to 19000 .
Thank you all for your attention, I wish you success, and remember:
Sometimes you win /sometimes you learn .
#Bitcoin

Sideways Movement is Here!I think we will go a little bit sideways in a very tight range because last time we spend too much time in the 27.5K - 28.5K range.
In financial markets, sideways movement refers to a period when the price of an asset remains within a relatively narrow range, moving up and down without a clear trend in either direction. Sideways movement can last for a few days to several months, and it can occur in any asset class, including stocks, bonds, and cryptocurrencies.
There are several factors that can cause sideways movement in financial markets:
Lack of new information: Markets often react to news and information, such as economic data releases, corporate earnings reports, or geopolitical events. When there is a lack of new information or no significant news that affects the asset's value, the price may remain stable, resulting in sideways movement.
Uncertainty: Uncertainty is a significant driver of sideways movement. Investors may hesitate to take action or commit capital when there is uncertainty about the future direction of an asset. This uncertainty can be due to a variety of factors, including geopolitical tensions, economic policy uncertainty, or market volatility.
Technical factors: Technical factors, such as support and resistance levels, can also contribute to sideways movement. When an asset approaches a key technical level, such as a moving average or a trendline, it may bounce off the level, causing the price to move sideways for a period.
Market consolidation: After a period of significant price movements, an asset may consolidate, moving sideways as traders and investors digest the recent developments and reassess their positions.
Lack of trading volume: Trading volume is an essential factor in financial markets. When trading volume is low, the price may move sideways as there is not enough market participation to drive significant price movements.
Sideways movement can be frustrating for traders and investors who are looking for clear trends and opportunities for profits. However, it is also a natural part of the market cycle, and it can offer opportunities for patient investors who are willing to wait for the right moment to take action.
Also Dominance chart looks so good for altcoins.
If Bitcoin's sudden movement means a rise for dominance. However, as far as I have observed, the BTC dominance graph is not suitable for this.
I have positive feelings about a short-lived altseason.

BTC SHORT! | Publishing Ideas is my new addiction
Alright folks, buckle up for a wild ride on the Bitcoin express! We're going to take a 15-minute trip through the price movements of everyone's favorite cryptocurrency.
Think of it like a roller coaster: you've got your ups and downs, twists and turns, and of course, a few stomach-churning drops. But don't worry, we'll hold your hand the whole way and help you make sense of it all.
So, what do we see on this chart? Well, it's a bit like a high-speed chase, with the price of Bitcoin zooming up and down like a race car on a track. But fear not, we have our trusty technical indicators and tools to help us navigate the twists and turns.
We'll be on the lookout for those key levels of support and resistance like a hawk hunting its prey. And when we spot a breakout or reversal, it'll be like hitting the jackpot at the casino (but without all the noise and flashing lights).
So, hang on tight and let's ride this Bitcoin coaster together. Who knows, we might even have some fun along the way!
