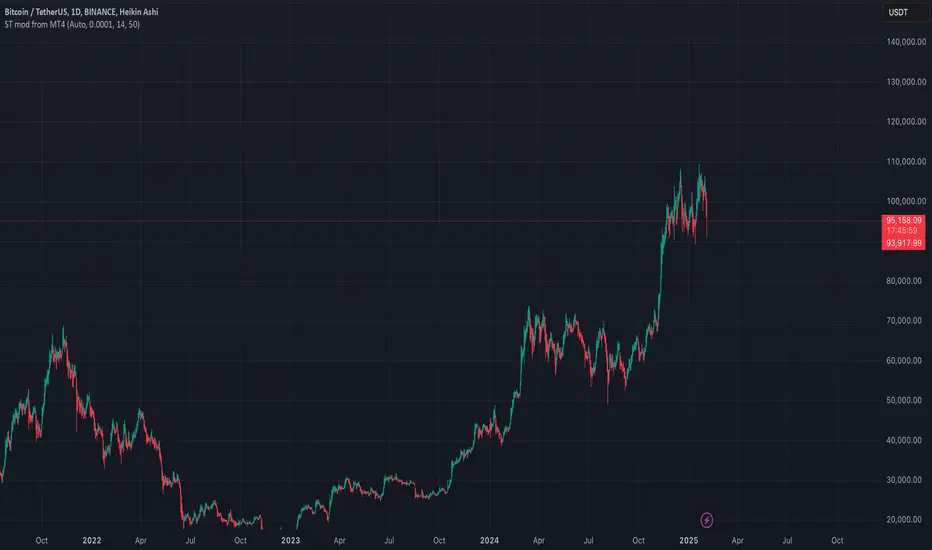
Bitcoin Yet To Recover Amidst February DipBitcoin ( CRYPTOCAP:BTC ) has yet to fully recover from its early February drop. The leading cryptocurrency remains colloquial, trading between $92,000 support and $102,200 resistance. This price variations posits a key contrast between digital and physical gold—while an ounce of gold trades at a relatively modest $3,000, Bitcoin fluctuates within a $10,000 price disparity.
BTC’s future direction remains uncertain. If buyers gain strength and push the price above $100,000, Bitcoin could test new highs in the $102,200–$105,500 range, potentially extending its upward trend.
However, a deeper correction could trigger a retest of the $93,000 support level, which would likely lead to a new local low within the $89,200–$92,000 range.
Presently Up 1.02% with a moderate RSI of 44.90 a moderation largely attributed to Michael Saylor's 7,633 purchase of Bitcoin worth $742 million today.
While the fear and greed index still remains at 35 this hints at a potential pull back might be inevitable.
Bitcoinmarkets

My safe entry for #LONG87.5k to 90k area is good for long zone, for me current market situation is suggesting me to Wait patiently for this area or let's see CAN BTC HOLDS 95-97K AREA,0
SUNDAY IS SPECULATION DAY😅

The Wait Is Almost Over – Alt Season Is Near
The moment we've all been waiting for is just around the corner. Now is the time to apply cycle indicators and accumulate high-potential coins.
I was much less active in January due to the 3-day cycle failures on most altcoins. The last 60-day cycle of the weekly trend didn’t offer great buying opportunities. But now, it's time to start aiming for those 100%-200% gains with relatively lower risk. (Premium members are already scouting top coins in our chat!)
🔸 Not Everything Is Straightforward Yet
Just because some alts have dipped **60-70%** over the last two months doesn’t mean they’ll immediately pump. You still need to **buy in the “green” zone** on cycle indicators—otherwise, you risk getting rekt.
🔹 Bitcoin Outlook
BTC is slowly approaching its **60-day cycle low** toward the end of the month. The **3-day cycle topped above 80**, increasing the chances of BTC heading toward the **90s area** before finding support.
😱 More blood on the charts?
Possibly. Right now, there are two types of traders:
1️⃣ Those who believe the top is in.
2️⃣ Those who think February will be extremely bullish.
I believe once both groups are confused, the upside will resume—likely in March, after the 3-day cycle resets and Bitcoin takes another leg down to shake out traders.
📉 Watching the 2-Week & 3-Day Cycles
When the 2-week cycle trends downward, we usually don’t perform well. Sure, we could reverse before the cycle fully resets, but ideally, we want the 3-day cycle to drop to around 20 before rebounding.
If the 3-day cycle continues to fall (which is likely unless we move up soon), February could see more bearish action before a stronger recovery.
Stay sharp & follow the cycles. 🚀

Bitcoin's Price Outlook: Support Levels, ETF Surge, and EmergingBitcoin's Price Outlook: Support Levels, ETF Surge, and Emerging Threats
Bitcoin, the world's leading cryptocurrency, finds itself at a critical juncture. While recent data reveals a surge in U.S. spot Bitcoin ETF inflows and identifies a key support level, looming challenges related to liquidity, government policy, and weakening momentum suggest a potential struggle in the near future. The next 30 days could prove to be a game-changer, determining whether Bitcoin can consolidate its gains or faces a significant downturn.
Key Support Level Identified
Technical analysis suggests a crucial support level for Bitcoin at $96,000. This figure coincides with the realized price for short-term Bitcoin holders, a metric that often acts as a reliable support or resistance level. Should Bitcoin fall below this threshold, it could trigger further sell-offs and potentially lead to a deeper correction. Conversely, if the price can hold above this level, it may signal renewed strength and pave the way for a potential rebound.
U.S. Spot Bitcoin ETF Inflows Surge
Despite the uncertainty surrounding Bitcoin's price action, U.S. spot Bitcoin ETFs have witnessed a remarkable surge in inflows. Year-over-year, these inflows have increased by a staggering 175%, with total net inflows exceeding $40.6 billion. This substantial investment from institutional and retail investors underscores the growing acceptance of Bitcoin as a legitimate asset class and suggests a strong underlying demand. The continued accumulation of Bitcoin by these investment vehicles could provide a buffer against potential price drops and contribute to long-term price appreciation.
The Next 30 Days: A Potential Turning Point
The next 30 days are crucial for Bitcoin. Several factors could influence its price trajectory, making this period a potential turning point for the market. These factors include:
• Liquidity Conditions: Bitcoin's price is heavily influenced by the availability of fiat currency. Concerns are rising as critical sources of fiat liquidity begin to tighten. This tightening could make it more difficult for investors to purchase Bitcoin, potentially putting downward pressure on the price.
• Government Policy: The U.S. presidential administration's approach to Bitcoin remains a significant factor. The slow progress in creating a strategic Bitcoin reserve raises questions about the government's long-term vision for the cryptocurrency. Clarity on regulatory frameworks and government adoption could significantly impact investor confidence and market sentiment.
• Technical Momentum: Bitcoin's upward momentum appears to be weakening. Technical charts suggest a potential loss of steam, with indicators pointing towards a possible correction. Traders will be closely monitoring these technical signals to gauge the direction of the market.
Risks to Watch Out For
Bitcoin faces several risks that could hinder its progress and potentially lead to a significant price correction. These include:
• Loss of the $96,000-$110,000 Range: Failure to hold above the $90,600 support level could lead to a retest of the broader $96,000-$110,000 range. A sustained break below this range could signal a more significant downturn.
• Tightening Liquidity: As mentioned earlier, the tightening of fiat liquidity poses a major threat to Bitcoin's price. Reduced access to fiat currency could limit buying power and lead to increased volatility.
• Uncertainty in Government Policy: The lack of clarity regarding government regulation and adoption of Bitcoin creates uncertainty in the market. Negative regulatory developments or a lack of clear guidance could dampen investor enthusiasm.
Balancing Act
Bitcoin's current situation is a delicate balancing act. While the surge in ETF inflows and the identification of a key support level offer some positive signs, the looming risks related to liquidity, government policy, and weakening momentum cannot be ignored. The next 30 days will be crucial in determining whether Bitcoin can navigate these challenges and continue its upward trajectory.
Conclusion
Bitcoin's price outlook remains uncertain. While the substantial inflows into U.S. spot Bitcoin ETFs and the presence of a key support level offer some encouragement, the cryptocurrency faces significant headwinds. Tightening liquidity, the slow progress in establishing a national Bitcoin reserve, and weakening technical momentum are all cause for concern. The next month will be critical in determining whether Bitcoin can maintain its footing or if it is poised for a correction. Investors should proceed cautiously, closely monitoring market developments and preparing for potential volatility. The long-term potential of Bitcoin remains a topic of much debate, but the short-term future hinges on how it navigates these immediate challenges.

Bitcoin Price Surges Despite US-China Trade TensionsBitcoin, the world's largest cryptocurrency, has seen a surge in price in recent weeks, despite ongoing trade tensions between the US and China. Bitcoin's price has risen by over 20% in the last few months, and some analysts believe that it could reach a new all-time high in the near future.
There are a number of factors that are driving Bitcoin's price growth. One factor is the increasing adoption of Bitcoin by institutional investors. In recent months, a number of major companies, such as Tesla and MicroStrategy, have announced that they have purchased Bitcoin as part of their treasury reserves.2 This has helped to legitimize Bitcoin as an investment asset and has attracted more institutional investors to the market.
Another factor that is driving Bitcoin's price growth is the increasing use of Bitcoin as a means of payment. In recent months, a number of major companies, such as PayPal and Visa, have announced that they will allow their customers to use Bitcoin to make payments.3 This has made it easier for people to use Bitcoin in their everyday lives and has helped to increase demand for the cryptocurrency.
Despite the ongoing trade tensions between the US and China, Bitcoin has continued to perform well. This suggests that Bitcoin is becoming increasingly decoupled from traditional financial markets. This is likely due to the fact that Bitcoin is a decentralized currency that is not controlled by any central bank or government. As a result, Bitcoin is not as susceptible to the same economic and political risks as traditional currencies.
However, it is important to note that the price of Bitcoin is still volatile and can fluctuate significantly in a short period of time. As a result, investors should be aware of the risks involved in investing in Bitcoin.
Other factors driving Bitcoin's price
In addition to the factors mentioned above, there are a number of other factors that are driving Bitcoin's price growth. These factors include:
• The increasing scarcity of Bitcoin. There will only ever be 21 million Bitcoins in existence. This scarcity is one of the reasons why Bitcoin is seen as a store of value.
• The increasing adoption of Bitcoin by developing countries. In many developing countries, Bitcoin is seen as a more stable and reliable currency than the local currency. This is driving demand for Bitcoin in these countries.
•
Overall, there are a number of factors that are driving Bitcoin's price growth. These factors suggest that Bitcoin could continue to perform well in the future. However, investors should be aware of the risks involved in investing in Bitcoin.

ShortYeah, it's pretty wild how quickly narratives shift, isn't it? A lot of these analysts seem to latch onto whatever fits their current agenda or the latest trend, and it's often the same people with different predictions based on the same factors. Like, one minute it's all about Trump's influence sending Bitcoin to the moon, and the next it's about geopolitics making a radical change in the market.
It seems like people can’t resist connecting anything and everything to Bitcoin’s price. It's like trying to predict weather patterns based on random social events.
It’s clear that a correction is overdue, and as usual, retail investors are going to jump in near the top, hoping to catch the momentum. But when the market starts to pull back, they’ll get stuck holding the bag as prices drop. The more they buy now, the more likely it is that the market will keep falling.
TOTAL Crypto Cap. Who called 800-pound Gorilla to enter a chatThe influence of Donald Trump on cryptocurrency markets has been a topic of significant discussion, particularly in light of his recent inauguration and the launch of various crypto-related initiatives. His evolving stance on cryptocurrencies, particularly Bitcoin, has led to both volatility and optimism within the market. This overview explores the implications of Trump's actions and statements on the cryptocurrency landscape, focusing on the factors contributing to market fluctuations and the broader economic context.
Trump's Evolving Stance on Cryptocurrency
Historically, Donald Trump has had a mixed relationship with cryptocurrencies. Initially dismissive, he referred to Bitcoin as "based on thin air" and a threat to the U.S. dollar. However, as his US-elections campaign progressed, his views shifted towards a more favorable outlook. In recent pre-elections statements (usual populist election rhetoric), Trump has expressed intentions to position the U.S. as "the crypto capital of the planet", for example.
This shift aligns with a broader trend where economic uncertainty has made alternative assets like Bitcoin more attractive. During Trump's first term, Bitcoin's price skyrocketed from around $1,000 to over $40,000, reflecting increased interest in cryptocurrencies as a hedge against traditional financial instability. Following his reelection in 2024, Bitcoin surged past $100 000, attributed in part to renewed investor confidence driven by Trump's pro-crypto rhetoric and cabinet appointments.
The Launch of Memecoins and Market Volatility
The recent launch of memecoins associated with Trump, such as $TRUMP and $MELANIA, exemplifies the volatility that can arise from his influence in the crypto space. These coins saw dramatic price fluctuations shortly after their introduction; for instance, $TRUMP's market capitalization soared to $14 billion before experiencing a significant crash. This volatility raises concerns about market manipulation and the sustainability of such speculative assets.
Factors contributing to this volatility include:
Market Saturation. The cryptocurrency market is highly competitive, with thousands of coins vying for attention. New entrants can dilute demand for existing coins, leading to price declines.
Lack of Utility. Many memecoins lack inherent utility or clear use cases, making them susceptible to speculative trading rather than long-term investment.
Regulatory Uncertainty. The evolving regulatory landscape can create unpredictability in the market. Trump's administration has indicated support for crypto-friendly policies; however, regulatory frameworks remain unclear.
The United States of TRUMPAMERICA
Trump's presidency coincides with heightened economic uncertainty due to various pro-inflationary factors, including US-centric tariff policies, trade wars and geopolitical tensions.
Despite initial optimism following Trump's election victory, there are concerns about whether his administration can deliver on its promises regarding cryptocurrency regulation and support. While some investors have benefited from short-term price surges attributed to Trump's influence, questions remain about the long-term sustainability of these gains.
Regulatory Developments and Future Implications
The establishment of a crypto task force under Trump's administration aims to create a comprehensive regulatory framework for digital assets. While this initiative is viewed positively by many in the crypto community, it remains uncertain how effectively it will address existing challenges within the market.
Technical Challenge
The main technical graph for CRYPTOCAP:TOTAL Crypto Cap indicates on Bearish trend in development, since "Double Top" technical figure has occurred a day before Mr. Trump entered the room.
The minor RSI (14) chart indicates also that Bullish optimism is getting sluggish so far.
Conclusion
Donald Trump's influence on cryptocurrency markets is multifaceted and continues to evolve. The recent volatility associated with memecoins underscores the speculative nature of digital assets while highlighting the broader impact of political fart on investor sentiment.

CLV pump and dump time???I timed it quite welll before. I hope it works again.
Currently I have shifted mostof my funds into stocks that will PUMP when they are named as part of the new industrial revolution.
That is where the 100x lays. crypto have the 30% pumps but that will dry up soon.
NOT FINANCIAL ADVICE!!

Bitcoin Returns to All-Time HighsThe cryptocurrency has managed to sustain a gain of over 4% in the last two trading sessions, as the market remains confident that Trump’s new administration will play a key role in the future of U.S. regulation. For now, the price is slowly approaching the all-time high resistance zone at 106K.
Neutral Bias
Bitcoin continues to trade within a strong lateral range, with resistance at 106K and support at 91K. The recent bullish momentum has once again brought the price to the resistance zone of the channel. If buying pressure remains steady, the current neutral formation could be challenged, potentially leading to a more significant upward move.
ADX Indicator
One factor that may not fully align with the recent buying spike is the ADX line’s movement. Currently, the ADX line is oscillating below the neutral 20 level, suggesting that recent upward movements lack a clear trend direction. This could lead to short-term bearish corrections, creating resistance at the current price level.
Key Levels
106K: The closest resistance level, positioned at the all-time high zone recorded by Bitcoin in recent weeks. If the price successfully breaks above this level, it would end the current lateral range and potentially trigger a stronger bullish rally in the short term.
99K: The nearest support level, aligning with the midpoint of the current range, the 50-period moving average, and the upper boundary of the Ichimoku cloud. This indicates that 99K serves as an important support barrier against bearish movements in the short term. If the price falls below this level in the coming sessions, it could confirm a bearish bias, undermining current market confidence and extending the lateral range.
91K: The final support level, positioned at the lower boundary of the lateral channel and acting as the last barrier before a potential trend reversal. If the price reaches this level, it could trigger strong bearish pressure in the BTC market.
By Julian Pineda, CFA - Market Analyst

Bitcoin's Rollercoaster Surging Past $101K or Plummeting to $70KIf Bitcoin breaks $101,700, it could aim for $117,000. If it falls below $100,000, it might correct down to $70,000-$80,000.
If this analysis helped you and your trading please like, share and boost that would be much appreciated
Kris/Mindbloome Exchange
Trade Smarter Live Better

Did Chinese AI Company Deepseek Cause Bitcoin (BTC) Price Crash?
The cryptocurrency market is known for its volatility, with prices often experiencing sharp swings in short periods.1 Recently, Bitcoin (BTC), the leading cryptocurrency, experienced a notable price drop, sparking discussions and speculation about the potential causes.2 Among the various theories circulating, one has gained particular attention: the suggestion that the price crash was triggered by the emergence of a Chinese AI company called Deepseek.3
Deepseek: A New Player in the AI Arena
Deepseek is a relatively new player in the artificial intelligence (AI) field, but it has quickly garnered attention for its advancements in AI technology.4 The company has been developing cutting-edge AI models, particularly in the realm of large language models (LLMs), which are designed to understand and generate human language.5
Deepseek's emergence has raised concerns among some investors and analysts, who fear that the company's advancements could disrupt the existing AI landscape, potentially challenging the dominance of U.S.-based tech companies.6 These concerns have seemingly spilled over into the cryptocurrency market, with some suggesting a link between Deepseek's rise and Bitcoin's recent price decline.7
The Alleged Connection: Market Sentiment and Uncertainty
The primary argument linking Deepseek to the Bitcoin price crash revolves around market sentiment and uncertainty.8 The theory suggests that the emergence of a strong competitor in the AI space, particularly one from China, has created a sense of unease among investors.9 This unease has led to a risk-off sentiment, prompting investors to sell off their holdings in various assets, including cryptocurrencies like Bitcoin.10
The reasoning behind this theory is that investors may be concerned about the potential implications of Deepseek's advancements. Some may fear that the company's technology could lead to job displacement in certain sectors, while others may worry about the geopolitical implications of China gaining a stronger foothold in the AI industry. These concerns, it is argued, have contributed to a negative market sentiment, which has ultimately impacted Bitcoin's price.11
Analyzing the Claim: Correlation vs. Causation
While the theory linking Deepseek to the Bitcoin price crash is intriguing, it's crucial to approach it with a critical eye. It's important to distinguish between correlation and causation. Just because two events occur around the same time does not necessarily mean that one caused the other.
In this case, it's possible that both Deepseek's emergence and the Bitcoin price crash are coincidental. There could be other factors at play that contributed to the price decline, such as:
• Profit-taking: After a period of price appreciation, some investors may have decided to take profits, leading to a sell-off and a subsequent price drop.
• Market manipulation: The cryptocurrency market is still relatively unregulated, making it susceptible to manipulation.12 Large sell orders or coordinated "pump and dump" schemes could have contributed to the price decline.
• Broader economic factors: Global economic conditions, such as inflation or interest rate hikes, can also impact investor sentiment and lead to sell-offs in various asset classes, including cryptocurrencies.
The Role of Media and Speculation
It's also important to consider the role of media and speculation in amplifying the alleged connection between Deepseek and the Bitcoin price crash. News articles and social media discussions may have contributed to the spread of this theory, even if there is limited evidence to support it.
In the fast-paced world of cryptocurrency, rumors and speculation can quickly influence market sentiment. It's crucial to be discerning about the information consumed and to avoid jumping to conclusions based on limited evidence.
Conclusion: A Complex Picture with No Definitive Answer
The question of whether Deepseek caused the Bitcoin price crash is a complex one with no definitive answer. While the theory linking the two events is intriguing, it's essential to consider other factors that could have contributed to the price decline.
It's possible that Deepseek's emergence played a role in shaping market sentiment, but it's unlikely to be the sole cause of the price crash. The cryptocurrency market is influenced by a multitude of factors, and it's crucial to consider the broader context when analyzing price movements.
As the AI industry continues to evolve and the cryptocurrency market matures, it's likely that we will see more instances of speculation and theories linking seemingly disparate events. It's important to approach such claims with a critical mindset, to distinguish between correlation and causation, and to consider the broader context before drawing conclusions.

BTC/USD "Bitcoin vs US Dollar" Crypto Market Heist Plan🌟Hi! Hola! Ola! Bonjour! Hallo!🌟
Dear Money Makers & Robbers, 🤑 💰
Based on 🔥Thief Trading style technical and fundamental analysis🔥, here is our master plan to heist the BTC/USD "Bitcoin vs US Dollar" Crypto market. Please adhere to the strategy I've outlined in the chart, which emphasizes long & Short entry. 👀 So Be wealthy and safe trade 💪🏆🎉
Entry 📈 : You can enter a Bull or Bear trade at any point after the breakout or reversal.
Buy entry should break and retest the neutral level (102,000)
Sell Entry Pullback at the neutral level (100,000)
Stop Loss 🛑: Using the 4H period, the recent / nearest Pullbacks.
Goal 🎯: Bullish Robbers TP 11500 (or) Escape Before the Target
Bearish Robbers TP 84500 (or) Escape Before the Target
Warning⚠️ : Our heist strategy is incompatible with Fundamental Analysis news 📰 🗞️. We'll wreck our plan by smashing the Stop Loss 🚫🚏. Avoid entering the market right after the news release.
Fundamental Outlook 📰🗞️
The BTC/USD is expected to move in a bullish direction, with the price potentially resuming its uptrend after a period of turmoil in late December and early January. The strong bullish trend and slight short-term decrease suggest that traders may consider trading only long positions.
To take a trade, consider the following:
Analyze the market trend: Look at the overall trend of the BTC/USD pair and identify any potential support or resistance levels.
Monitor market news and events: Keep an eye on any news or events that could impact the price of Bitcoin, such as changes in regulations or adoption rates.
Use technical indicators: Utilize technical indicators like moving averages, RSI, and Bollinger Bands to help identify potential trading opportunities.
Set a trading plan: Develop a clear trading plan, including entry and exit points, stop-loss levels, and position sizing.
The fundamental analysis of Bitcoin is aimed at determining where the price of the asset is headed, with models like the stock-to-flow model predicting prices based on the rate of new bitcoins being added to the network relative to the existing supply. Additionally, macroeconomic events like increasing monetary bases of fiat currencies can lead to inflation, which may drive up the demand for Bitcoin as an inflationary hedge.
Here's a fundamental analysis for BTC/USD, along with market sentiment percentages:
Overall Trend: The BTC/USD pair is expected to move in a bullish direction
Bullish Sentiment: 65%
Bearish Sentiment: 30%
Neutral Sentiment: 5%
Market News and Events: The upcoming events, such as the Bitcoin halving and the increasing adoption of cryptocurrencies, are expected to drive the price of Bitcoin up.
Bullish Sentiment: 70%
Bearish Sentiment: 25%
Neutral Sentiment: 5%
Technical Indicators: The technical indicators, such as the moving averages and RSI, are indicating a bullish trend.
Bullish Sentiment: 60%
Bearish Sentiment: 35%
Neutral Sentiment: 5%
Fundamental Analysis: The fundamental analysis of Bitcoin, including the stock-to-flow model, is predicting a bullish trend.
Bullish Sentiment: 75%
Bearish Sentiment: 20%
Neutral Sentiment: 5%
Macro-economic Events: The increasing monetary bases of fiat currencies and the potential for inflation are expected to drive up the demand for Bitcoin as an inflationary hedge.
Bullish Sentiment: 80%
Bearish Sentiment: 15%
Neutral Sentiment: 5%
Overall, it's essential to stay informed about market trends, news, and events, and to use a combination of technical and fundamental analysis to make informed trading decisions
Please note that this is a general analysis and not personalized investment advice. It's essential to consider your own risk tolerance and market analysis before making any investment decisions.
Take advantage of the target and get away 🎯 Swing Traders Please reserve the half amount of money and use trailing SL
Keep in mind that these factors can change rapidly, and it's essential to stay up-to-date with market developments and adjust your analysis accordingly.
💖Supporting our robbery plan will enable us to effortlessly make and steal money 💰💵 Tell your friends, Colleagues and family to follow, like, and share. Boost the strength of our robbery team. Every day in this market make money with ease by using the Thief Trading Style.🏆💪🤝❤️🎉🚀
I'll see you soon with another heist plan, so stay tuned 🫂

Bitcoin and the US PresidentsDemocrats and Obama:
177,202,485.71%
GOP and trump 1.0:
5,192.94%
Let the plebs and paid influencers talk their way, but facts will be facts, always.
Why he wants to deregulate crypto now, we might only speculate. But Ross William Ulbricht is free, pardoned by Trump.
If the trust in cryptocurrencies is compromised, expect a deep ABC correction. ;)
It is not a political post, nor is intended to be interpreted like one. It is just market observing one.
Be safe. Protect Your money.
Cheers

JUST IN: Bitcoin at $107,000Bitcoin, the flagship cryptocurrency, recently broke past the significant $107,000 psychological resistance level before retracing to $106,000. Despite this pullback, several technical and fundamental indicators suggest a bullish trajectory for the digital asset in the near term.
Technical Analysis
A key technical indicator supporting the bullish outlook is the imminent formation of a golden cross pattern on Bitcoin’s chart. This occurs when the 50-day moving average (MA) crosses above the 200-day MA, a classic signal of bullish momentum and a potential sustained uptrend.
Historically, golden cross patterns have often preceded major price rallies in Bitcoin. For instance:
- In 2020, the formation of a golden cross preceded Bitcoin’s surge from $10,000 to its then all-time high of $64,000.
Currently, Bitcoin’s Relative Strength Index (RSI) sits at 58, which is within neutral territory but trending upward. This indicates that there is room for further bullish momentum without the asset being overbought.
Market Performance
As of this writing, Bitcoin is up 2% on the day, trading at $106,000. The price action suggests strong buying interest at the current levels, even as the market absorbs profit-taking near the $107,000 mark. Key support levels to watch include $104,500, while resistance remains at $107,000 and beyond.
Beyond technical signals, several fundamental factors are bolstering Bitcoin’s bullish outlook:
1. Institutional Interest: Recent data highlights a surge in institutional inflows into Bitcoin-focused investment products. This renewed interest comes amid increasing macroeconomic uncertainty and Bitcoin’s reputation as digital gold.
2. Supply Dynamics: Bitcoin’s halving event, expected in mid-2025, is already influencing market sentiment. Historically, halvings have significantly reduced the rate of new Bitcoin entering circulation, often leading to price increases as demand outpaces supply.
3. Global Adoption: Countries and corporations continue to embrace Bitcoin as a legitimate asset. Recent announcements of Bitcoin integration into payment systems and growing adoption as a store of value further validate its utility and potential.
Conclusion
With the golden cross pattern on the verge of confirmation, Bitcoin’s technical setup suggests that a strong bullish run could be imminent. Coupled with favorable fundamentals, including increasing institutional participation and global adoption, Bitcoin appears well-positioned to continue its upward momentum.
Traders and investors should keep an eye on the $107,000 resistance level, as a decisive break above it could pave the way for Bitcoin to target $110,000 and beyond. However, as always, caution is advised, as market volatility remains a key characteristic of the cryptocurrency space.

$HYPE HyperLiquid to the moonHYPE with that kind of chart pattern,
we will see GETTEX:HYPE reaching $50 soon?


Bitcoin's Path to $253,953 in 2025 – A Technical PerspectiveIdea Description:
In this analysis, I aim to present why I believe Bitcoin (BTC) could reach $253,953 in 2025. This price target is derived from a combination of historical trends and advanced technical analysis.
1️⃣ Key Resistance: The Historical Trendline
The trendline formed by the peaks of 2017 and 2021 acts as a robust resistance level. Historically, these trendlines have played a pivotal role in determining Bitcoin's price action during bull cycles.
2️⃣ Convergence with SpiderLines
The SpiderLines, established in 2019, perfectly align with the aforementioned trendline, creating a critical confluence zone. This dual-layered resistance suggests that $253,953 will be a significant psychological and technical barrier.
3️⃣ Supporting Market Cycles
Analyzing past cycles, we see that Bitcoin often revisits key trendlines in subsequent bull runs. The historical context suggests that 2025 will align with the next cycle peak, reinforcing this price prediction.
This idea highlights the importance of respecting historical levels and recognizing key confluences in market analysis. What are your thoughts on this projection? Could BTC challenge this resistance and push higher? Let’s discuss!

BTC Rockets Past $100K: Bulls Eye $105K Next!BTC/USD Technical Analysis
Price Action:
BTC is currently trading at $102,295, demonstrating strong momentum after breaking above the key $100k resistance level.
Technical Indicators:
RSI: At 72.10, indicating overbought conditions, but there is still potential for further gains in a bullish market.
Key Levels:
Support: $97,000-$98,000 zone (recent consolidation base).
Resistance: Immediate resistance at $102,500, with a longer-term target at $105,000.
Pattern:
Clean breakout from the equilibrium zone, supported by strong volume, confirming bullish momentum.
Confidence Rating:
8/10 for continued upside, as the breakout shows strength and is supported by market conditions.
Recommendation:
For existing positions: Hold longs with tight stop-losses below $100k to manage risk.
For new entries: Not an ideal entry point due to overbought RSI. Wait for a potential pullback to $100k for better risk-to-reward opportunities.
Summary: BTC continues to show bullish strength, but caution is warranted at current levels due to overbought conditions. Maintaining stops and awaiting pullbacks will help mitigate risk while positioning for further upside.

BITCOIN UPDATES FOR ENTRIESWere still on a Bullrun, but we might see an clear of LONGS here!. if the premiums clear. wait for pullback.
This idea would manipulates the LONGS. or the price could go back to 78k? before we go higher.
This is only my view for now. I'm still bullish on MARKETSCOM:BITCOIN , this is not a financial advice, do your own research base on the sentiments right now.
The long-term still on 128k? probably yes, but at what timeframe.
follow for more. I will be posting daily updates on other pairs.
Come and check this out.
Daily reminder you need to rest on weekends. the market is just making liquidity.
Lock in boys.
keep stackingsss satttssss.. I believe on this coin. As we can see the US markets especially the ETFS, could drive the price high before our eyes.

Just an idea on Bitcoin and the cyclesFirst of all, Bitcoin is a programmable asset. Then there are cycles, not just with the markets, but with humans as well.
There is always a chaos within the structures. Just like the atoms in our bodies. They move chaotic in space, but within the boundaries of a our cells. The order is just a well organized chaos.
The First Bitcoin Super cycle is close to it's ending. The Second (mass adoption) Super cycle is knocking at the door. It is up to humanity to decide now, not "the the leaders or the riches".
Cheers.
It is not intended as a trading advice, nor it is.
Just a research on markets I do.
P.S. All the channels are equal in height on log...

Bitcoins Next Move will be HUGE!The markets have pulled back to pre-election areas, will Bitcoin meet the same fate?!
CRYPTOCAP:BTC - Bitcoin
- Bearish Expanding Triangle
- Red H5 Indicator
- Volume shelf with Volume GAP
- Right at the bottom of the box: Either a huge bounce or a huge breakdown
Not financial advice

"Bitcoin Price Prediction: $30K TargetThis analysis uses historical Bitcoin price patterns during previous bull and bear cycles to predict future market movements. The chart reveals a recurring pattern of sharp corrections following parabolic rises, suggesting that Bitcoin is likely heading toward a $30K price point in its current bearish phase. By aligning current trends with past cycles, this prediction provides a roadmap for investors to navigate potential market downturns and prepare for upcoming opportunities.

