₿ BTC: Upside Potential Remains IntactBTC posted modest gains over the weekend, but more upside is expected in our primary scenario. We continue to track a corrective advance in green wave B, with the potential to extend into the upper blue Target Zone between $117,553 and $130,891. From that top, wave C should initiate a downward move into the lower blue zone between $62,395 and $51,323—completing orange wave a. Subsequently, we anticipate a bounce in wave b, followed by another decline in wave c, which should conclude the larger correction of blue wave (ii). There is still a 30% chance that blue wave alt.(i) could make a new high, extending beyond the Target Zone and delaying the broader corrective sequence.
📈 Over 190 precise analyses, clear entry points, and defined Target Zones - that's what we do.
Bitcoinprediction

Market Overview
WHAT HAPPENED?
Last week, after fluctuating in a sideways range, bitcoin began to decline. Only $300 wasn’t enough to reach the level of $100,000 — there was a strong absorption of market sales, and a rebound occurred.
WHAT WILL HAPPEN: OR NOT?
We tested the $104,500–$105,800 zone (accumulated volumes). There is no abnormal activity or strong sales within it, which increases the likelihood of continued upward movement to the next sell zone. After that, the current volumes may go long, forming a new support zone in the range of $105,800–$104,500.
This week, we can consider a long retest of the support of $104,500–$105,800 with confirmation of the buyers' reaction. However, low volumes in the upward wave keep the risk of a sharp resumption of sales. In this case, the key entry level will shift to the psychological mark of $ 100,000.
Supply Zone:
$107,000–$109,800 (accumulated volumes)
Demand Zones:
$101,600–$100,000 (previous push-volume zone + current buyer defense)
$98,000–$97,200 (local support)
$93,000 level
$91,500–$90,000 (strong buy-side imbalance)
IMPORTANT DATES
Macroeconomic developments this week:
• Wednesday, June 11, 12:30 (UTC) — publication of the basic US consumer price index for May, as well as in comparison with May 2024;
• Thursday, June 12, 06:00 (UTC) — UK GDP for April is published;
• Thursday, June 12, 12:30 (UTC) — publication of the number of initial applications for unemployment benefits and the US producer price index for May;
• Friday, June 13, 06:00 (UTC) — German consumer price index for May is published.
*This post is not a financial recommendation. Make decisions based on your own experience.
#analytics

Bitcoin: Weekly Bullish Continuation🟠 The weekly divergence between the March 2024 and January 2025 peaks has driven the recent 3-month decline.
🔴 BTC is expected to make a weekly move higher, creating another divergence in the way.
🔵 BTC held above the 2024 peak range 73K without overlap, while the Stock RSI has completed a full reset, reinforcing the bullish momentum.
🟢 Outlook: Over the next 6 months, Bitcoin CRYPTO:BTCUSD is expected to rally into new ATH, with a potential target around 127K by October 2025.

#BTC/USD Close Fight but bulls win! $117K Still in sight!CRYPTOCAP:BTC Weekly Update:
BTC closed the week up by just 0.08%, leaving behind a long wick and a tiny body, forming a Dragonfly Doji, one of the strongest candlestick patterns, signalling a fierce battle between bulls and bears.
✅ This time, the bulls won by a small margin, but a win is a win.
✅ BTC successfully held its key support.
✅ The CC is green, which is a positive sign.
The price action remains choppy, but the trend is still pushing upward from here.
Invalidation:- Weekly Close below $100k
What do you think?
Do let me know in the comments section. And please hit the like button.
Thank you
#PEACE

BITCOIN Support & Resistance Levels🚀 Here are some key zones I've identified on the H4/H1 timeframe.
These zones are based on real-time data analysis performed by a custom software I personally developed.
The tool is designed to scan the market continuously and highlight potential areas of interest based on price action behavior and volume dynamics.
Your feedback is welcome!

Will BTCUSD see $90,000 ever again? Phoenix FX mid term analysisBTCUSD 4-Hour Outlook: The Week Ahead
🔴 Key Resistance Zones
First Resistance
$107 000–$108 500
Recent swing highs where price stalled before the last leg down. Clearing and closing above $105 000 on the 4H would open the door toward this zone.
Final Resistance
$111 000–$113 000 (If broken expect a run to $115,000)
The all-time-high area. Heavy sell-side liquidity lives here and past price action shows repeated FVG fills and wicks into this region.
🔵 Critical Support & Buy Zones
Discount Buy Zone:
$92 000–$89 000 (50% at $89 150)
A deeper weekly FVG and longer-term trend support. The ultimate “buy the dip” area if the premium zone gives way.
Premium Buy Zone:
$100 000 – $99 000 (50% at $99 450)
A 4H Fair Value Gap that aligns with our higher-timeframe trend support. The recent bounce here signals strength—and a possible launchpad back into resistance.
📊 Weekly Price Action Scenarios
Bullish Theory:
If BTC can close cleanly above $105 000 on the 4H, look for a run into $107 000–$108 500 (First Resistance). A follow-through push could then target $111 000–$113 000 (Final Resistance) by week’s end with a potential further move to $115 000 where the 8 year trend will be tested again.
Bearish Theory:
Failure to reclaim $105 000, or a clear rejection in the $107 000–$108 500 zone, could usher in a retest of the Premium Buy Zone (~$100 000). A break below $99 000 would shift focus toward the Discount Buy Zone around $92 000–$89 000.
💡 Trade Ideas for the Week
Potential Long Ideas
Entry: 4H candle close above $105 000
Targets: First take-profit at $108 500; stretch target $112 000–$113 000
Stop-Loss: Below $103 000
Zone Re-Entry Long
Entry: Bullish 4H candle close in $100 000–$99 000
Targets: $107 000 then $112 000
Stop-Loss: Below $97 500
Potential Short Ideas
Entry: Bearish price action (e.g., engulfing candle or wick rejection) in $107 000–$108 500
Targets: $100 000→$92 000
Stop-Loss: Above $109 000
Just a Heads-Up:
This is my take on the charts—not gospel, not financial advice, and definitely not a crystal ball 🔮.
Trading is part skill, part patience, and part “what just happened?” 😅
We all see things a little differently, and that’s the beauty of it.
So if you’ve got a hot take, wild theory, or just want to drop some chart wisdom—hit the comments!
Let’s grow, learn, and laugh through the madness together. 🚀📈
Each one, teach one.
— Phoenix FX Team 🔥🦅

Bitcoin to 120k or 150k next?The last setup on BITSTAMP:BTCUSD played out exactly as predicted. ()
As of today, June 8, 2025, Bitcoin is trading around $105,000 - $106,000 USD.
And it's been retesting the zone for quite a long time and it's time it broke out! It's less likely to reverse now (Still a possibility tho).
Predictions for Bitcoin's future price is wide, as many analysts are quite bullish:
Year-End 2025: Some experts are eyeing $150,000 USD and more by the end of 2025, citing factors like global liquidity expansion and continued institutional interest.
Do you think it's a possibility?

BITCOIN REVERSAL INCOMING !!!! BUT WHEN????Currently we have seen a great move from 75k to new ATH 112k BUT now whole bullish momentum seems to be fading.
If we see charts, we clearly see ranges and recently Bitcoin has swept range high & reclaimed back into range, which indicates lose momentum. We may see BTC tapping 90K even 80'sK for next bullish move.
For all to maintain it's bullish momentum, Bitcoin have to stay above 74.5k and needs to break and hold above 109.5K.
Breaking below 74.5k would push BTC as low as 60-55k
STAY CAUTIOUS !!!!

Bitcoin Prediction - WARNING - Short Set-up Looming? We are spectating something serious on Bitcoin looming right now! Confirmations explained in the video!

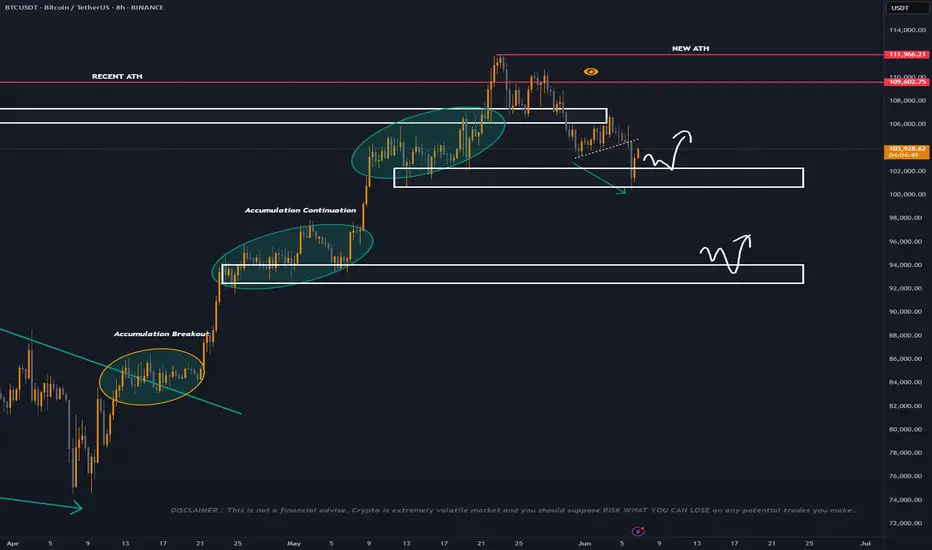
BTC/USDT Analysis – Breakout from Sideways Range
Hello everyone! This is the trader-analyst from CryptoRobotics with your daily market update.
As expected, Bitcoin dropped to the local low yesterday. At the time, there was no sign of buyer support, and the price moved down to the next support level.
Just around $300 short of a round-number level, a strong absorption of market sell orders occurred, and we saw a rebound.
At the moment, the price has reached the range of accumulated volumes within the sideways channel — $104,500–$105,800 — which is currently positioned short. Therefore, the priority scenario is another wave of decline toward the $101,600–$100,000 zone.
If there is no selling reaction in that area, we’ll then expect Bitcoin to move to the next supply zone.
Supply Zones:
$104,500–$105,800 (accumulated volumes)
$107,000–$109,800 (accumulated volumes)
Demand Zones:
$101,600–$100,000 (previous push-volume zone + current buyer defense)
$98,000–$97,200 (local support)
$93,000 level
$91,500–$90,000 (strong buy-side imbalance)
This publication is not financial advice.

₿ BTC: Delay Tactics in Wave B Bitcoin dropped hard yesterday, throwing a wrench into the expected climb toward the top of green wave B. This bounce was supposed to stretch into the upper blue Target Zone between $117,553 and $130,891, which we flagged as a smart area to take partial profits or layer in short hedges. That zone still stands—BTC just isn’t ready to hit it yet. The current pullback suggests we’ll see more sideways-to-lower price action before green wave B wraps up. Once it does, green wave C should drag Bitcoin into the lower blue Target Zone between $62,395 and $51,323. That’s where we’re looking for orange wave a to complete. After that, a countertrend rally in wave b could pop up—before wave c wraps the entire corrective cycle and finishes blue wave (ii). We’re also watching an alt.(i) breakout scenario (30% probability). In that case, BTC would blow through the $130,891 level early, bypassing the expected dip and reaching new highs faster than projected.
📈 Over 190 precise analyses, clear entry points, and defined Target Zones - that's what we do.

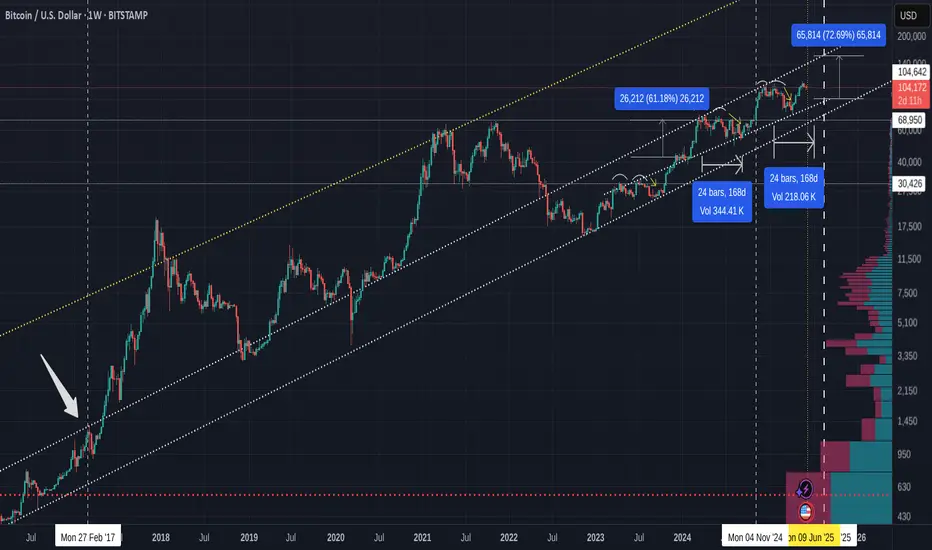
Did you know current line of rejection was 1st used in Feb 2017
The chart says it all
This is a chart I have used here iften but never zoomed out.
That line has rejected us 3 times now this cycle.
It was just once in 2017 but once Crossed, tested and held, it is a mighty line of support.
This maybe why the Bears do not want us to cross it......
But I have little doubt that Bitcoin has the ability to cross it....
There aew many reasons why we have not done so, Technical and Macro and I really am beginning to think that we will have a lazy Summer, ranging across, maybe reaching another small ATH before we really go for it in late Q3 / Q4
BUT, I could be wrong.
Just my opibion
Bitcoin Update
Currently bitcoin is on our local support ranging at 100.8k - 102.2k area, Looks our bulls are defending those local supports panda fam but the movement for me is a obvious normal correction 👀
As you can see its a decent reaction bounce between local support + A good volume from buyers base also basic indicator divergence. 🚀
Patiently waiting for next following days if we will print a structure the indicates a next higher high above local support which is possibly first indication for first confirmation reversal for possible next impulse up. 🐂
Crypto market is like a game you will wait to finish the loading screen then the battle begin ! 🔥
Quick BITCOIN update using old Fractal chart - a small red June
Bitcoin appears to be taking a rest when it is strictly not required.
We are heading towards the 2nd dashed arrow, which as I pointed out months ago is a very possible and more realistic path for Bitcoin to take this cycle.
We have left the 2013 - 2017 Fractal and yet are likely to follow the idea of moving higher to a new ATH from this level off the Fractal.
PA entered that circle I drew back in Feb and is still in it right now, as we can see in the chart below
We can also see how PA has bounced off the 50 SMA on this daily chart.
This does NOT guarantee a continued move higher but it may offer some levels of support.
Should this fail, we do have various levels of support down to around 94K
I will refer back to a previous post and mention that to some extents, I am expecting a RED June. This does not need to be a Big candle, just 1 usd less than the open price wil create that.
104648 was the open price, so, we can easily stay above 100K and create that red candle.
Why do we want a red candle..?
Because, to put it simply, statistically, we have a better chance of continued monthly Green candles after a red june this time
I will attach the chart below so you can read about this in more detail.
This may or may not be good for ALTS>.... but I do not have many now.....just my preference

Was that end of bull run? BTC Price action + signal!Hello everyone! i want share my idea + signal at bitcoin.
I'll make simple technical analysis, yesterday bitcoin test 106500 LVL but i think sellers are still strong and they will brake that support zone and then we have 101000-100000 support zone where we can see real buyers if we are still in bull trend. in my opinion bear trend will start soon.
Why bitcoin made new high? with technical it tested 1 week FVG and it worked well but what happened exactly?
Despite the high, profit-taking is evident. On-chain data shows $4.02B in volume from 1–5y holders (highest since February), suggesting old hands are selling into strength. ETF inflows slowed this week, and the Fear & Greed Index at 74 (“Greed”) signals potential overheating. If $100K fails, a deeper correction to $90K–$87K could confirm a short-term bear trend.
Institutional Adoption: Highlighted $40B+ ETF inflows and corporate buying (e.g., MicroStrategy), as these are major drivers of the $111,880 high on May 22, 2025.
Regulatory Tailwinds: Noted Trump’s re-election and SEC speculation, which markets priced in as bullish.
Halving & Scarcity: Linked the April 2024 halving to reduced supply, supported by on-chain data showing low exchange inflows.
Macro Factors: Tied Fed rate cuts and BTC’s “digital gold” narrative to the rally, as these are widely discussed in 2024–2025.
Added on-chain evidence ($4.02B volume from older holders) to support your view of profit-taking and seller strength.
Noted slowing ETF inflows and high Fear & Greed Index (74) to justify a potential correction, aligning with your bearish outlook.
Suggested $100K as a critical level to watch, with a break below signaling a deeper drop to $90K–$87K, giving traders a clear risk framework.
This is not long term, short signal but for few days it will be good, we have FOMC soon and it will show us real bitcoin price direction.
Open short at 1075000
Stop loss at 109000
Take profit at 101000
Always make your own research!!!!
for collaboration text me Private!!!

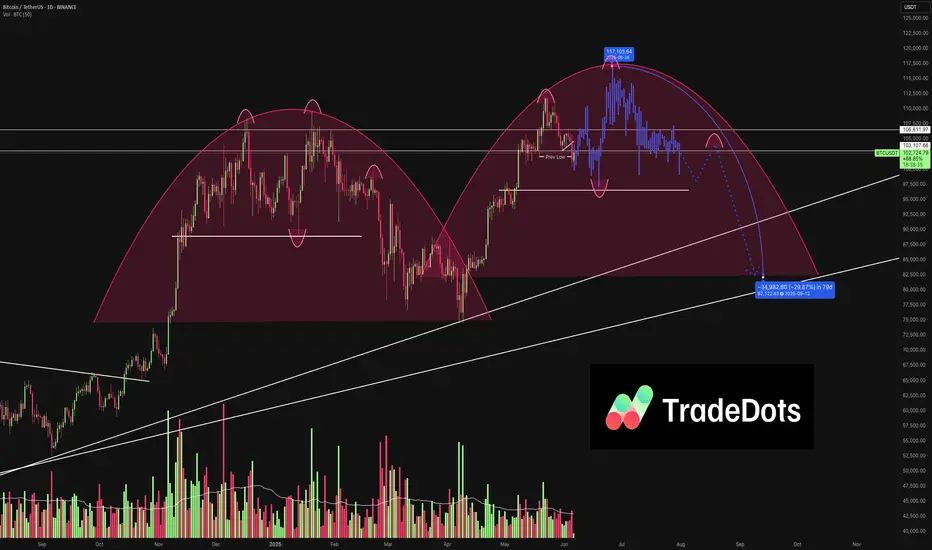
Is Bitcoin Repeating Its 2021 Price Action? | TRADEDOTSWe’ve observed that Bitcoin CME:BTC1! appears to be repeating a previous wave pattern. If it follows its historical price action yet again, here’s what we might expect:
2021 Comparison
Back in 2021, Bitcoin formed two large rounded wave structures where the second wave exceeded the first, forming two consecutive all-time highs followed by a huge drawdown. This year’s price action looks very similar to the beginning of the second 2021 waves. If it continues to unfold in the same way, we anticipate a new all-time high before the end of this year, followed by a notable pullback into early next year.
Key Support at $96,000
As long as BTC holds above $96,000, the bullish trend remains intact. This level has shown great demand and volume support, reinforcing its role as the floor for the short-term uptrend.
Upside Potential to $117,000
If buyers continue to support the market above $96,000, BTC could reach the $117,000 region, setting another all-time high. This expectation follows the earlier wave pattern seen earlier this year and completes a close parallel to the 2021 bull run.
Deeper Pullback Expected
After a potential new high, a larger correction is likely. Drawing on previous pullback price action, a 30% dip toward $82,000 could align with a higher-time-frame trendline and significant support area—mirroring the wave structure from 2021.
Final Thoughts
BTC remains structurally bullish above $96,000
A pullback to the $82,000 region could present a key buying opportunity if it occurs.
TOTAL Crypto Market. Games with the 800-Pound Gorilla. Series IIOver the 4 months since Donald Trump’s inauguration in January 2025, his administration’s policies have had a complex and in many ways negative impact on cryptocurrency markets, despite the overall pro-crypto agenda.
Short-Term Market Volatility Due to Tariff Policy
One of the most significant negative impacts has been caused by Trump’s aggressive tariff policy. The announcement and subsequent implementation of new tariffs sent shock waves through global financial markets, including cryptocurrencies.
The immediate effect has been increased volatility, with Bitcoin down a third from its highs, Ethereum and many other major coins also falling by more than half, and crypto futures seeing liquidations of over $450 million in a single day.
This turbulence was not isolated — experts noted that broader “risk aversion,” in which investors flee volatile assets for safer havens like gold, led to sharp declines in both the stock and crypto markets.
Uncertainty around tariffs — particularly reciprocal tariffs affecting up to 25 countries — created short-term headwinds for cryptocurrencies. As institutional and foreign investors pulled billions out of U.S. stocks, the resulting market volatility spilled over to cryptocurrency, which remains closely tied to tech indexes like the NASDAQ. This risk aversion delayed potential rallies and led to a volatile, unpredictable trading environment.
Regulatory Rollbacks and Market Integrity Concerns
The Trump administration has aggressively rolled back regulatory oversight in an attempt to create a more crypto-friendly environment. Key steps include disbanding the Justice Department’s National Cryptocurrency Enforcement Team (NCET), appointing pro-crypto officials to regulatory bodies, and directing agencies to streamline or repeal existing crypto regulations. While these actions have reduced the compliance burden on crypto businesses and spurred innovation, they have also raised serious concerns about the integrity of the market.
Critics argue that loosening oversight increases the risks of money laundering, fraud, and illegal transactions, which could undermine investor protections and the overall reputation of U.S. crypto markets.
Consumer advocacy groups warn that rapid deregulation could encourage abuse and undermine trust, especially since the Trump administration has also banned the development of a U.S. central bank digital currency (CBDC), setting the U.S. apart from other major economies pursuing digital currency initiatives.
Conflicts of Interest and Ethical Controversies
Another negative impact has been the perception — if not the reality — of conflicts of interest and ethical dilemmas. The Trump family’s direct involvement in crypto projects, including the launch of a stablecoin and investments in mining, has fueled suspicions of market manipulation and blurred the lines between personal and presidential interests.
Such controversies have further undermined investor confidence and contributed to a sense of unpredictability in regulatory and market outcomes.
Summary Table: Key Negative Impacts
Policy/Action =>> Negative impact on crypto markets
Rising Tariffs and Trade Uncertainty =>> Increased volatility, risk aversion, falling prices.
Regulatory Rollbacks/NCET Dissolution =>> Weakened oversight, higher risk of fraud and abuse.
CBDC Development Ban =>> US Lagging Global Digital Currency Innovation
Trump Family’s Direct Involvement in Crypto =>> Alleged Conflicts of Interest, Market Manipulation Concerns.
Technical Challenge
The technical picture in the main crypto market cap chart CRYPTOCAP:TOTAL points to the end of the recovery period, reaching a key resistance near the $3.5 trillion mark.
Conclusion
While the Trump administration has promoted a more liberal environment for crypto innovation, the last four months have seen significant negative effects: increased market volatility due to tariff policy, increased risk due to deregulation, and growing concerns about conflicts of interest.
These factors have combined to create an atmosphere of uncertainty and skepticism, which is undermining the stability and trust in the US crypto markets in the short term.
--
Best wishes,
@PandorraResearch Team 😎

BTC: Facing Resistance?Bitcoin recently encountered renewed selling pressure, stalling the anticipated continuation of green wave B. Under the primary scenario, this corrective upward movement should still extend into the upper blue Target Zone between $117,553 and $130,891, where the price is expected to reverse and initiate green wave C. That move should complete with a low in the lower blue Target Zone between $62,395 and $51,323, thereby finalizing orange wave a. Following a corrective advance in wave b, the larger wave (ii) should reach its conclusion. There remains a 30% probability for the alternative scenario, in which BTC pushes above the upper blue Target Zone, establishing a new high in blue wave alt.(i)— which would delay the expected pullback.
📈 Over 190 precise analyses, clear entry points, and defined Target Zones - that's what we do.

BTC/USDT Analysis – Continued Rotation
Hello everyone! This is a daily market analysis from a CryptoRobotics trader-analyst.
Yesterday, after testing the local resistance at $105,400, Bitcoin shifted to a downward movement — but not for long. Selling pressure was very weak, and the initiative was quickly taken over by buyers. However, after a second test of that same level, selling resumed again, indicating that sellers currently hold the upper hand.
Main expectation: a test of the local low at $103,000, from where a return into the sideways range and a potential retest of the upper sell zone is likely.
Sell Zone:
$107,000–$109,800 (accumulated volume)
Buy Zones:
Around $100,000 (aggressive buying volumes)
$98,000–$97,200 (local support)
$93,000 level
$91,500–$90,000 (strong buying imbalance)
This publication is not financial advice.

BITCOIN end of cycle at $111K? Unlikely.1) The bitcoin cycle linked to the Spring 2024 halving ends at the end of 2025
The bitcoin price reached 11,900 US dollars on Thursday May 22, and many investors are wondering whether the bullish cycle linked to the Spring 2024 halving is already over. In terms of bitcoin's time cycle, the answer is negative, as all past cycles have ended at the end of the year following halving, i.e. at the end of 2025 in the case of our current cycle.
2) In terms of chart analysis of the financial markets, the underlying trend remains bullish above support at 93000/97000 US dollars.
Since the bull market's starting point at the US$15,000 level, the same pattern has been repeating itself, alternating between impulses, sideways phases and bullish breakouts. As long as the market holds above support at $93/97K, this bullish pattern is not invalidated.
3) If M2 global liquidity continues to act as a leading indicator, then bitcoin's price should make a new record this summer
Since the beginning of April, Bitcoin has been on a marked uptrend. This progression, which we have followed step by step, raises a key question: can this momentum be maintained throughout the spring, and even into the summer, in the absence of explicit signals of monetary stimulus from the major central banks? Such a hypothesis seems plausible, provided that a key - and often underestimated - driver continues to act: the unprecedented increase in global liquidity, as measured by the M2 monetary aggregate.
This new peak in global M2 money supply is more than just macroeconomic data. It represents a genuine source of liquidity for risky assets. This aggregate includes sight deposits, liquid savings accounts and immediately available funds - all resources that can be mobilized rapidly on the markets.
Global M2 is the sum of data from the three main economic zones: the United States, China and Europe. And each of them is actively participating in this monetary expansion:
In China, M2 is at an all-time high, reflecting the accommodating stance of the Beijing authorities.
In Europe, the aggregate rose sharply under the effect of the first rate cuts initiated by the ECB.
In the United States, despite the Fed's still restrictive stance, M2 is growing strongly and is now close to its highest levels. The evidence is therefore crystal clear: the major economies are injecting liquidity in a coordinated fashion, which is mechanically supporting the valuation of financial assets, with Bitcoin at the forefront.
Consequently, if this positive linear correlation continues, and if support at $93/97K is preserved, then the likelihood of a new record high for Bitcoin this summer is attractive.
What about altcoins? This will be the subject of one of our next publications, so don't hesitate to follow our account on TradingView.
DISCLAIMER:
This content is intended for individuals who are familiar with financial markets and instruments and is for information purposes only. The presented idea (including market commentary, market data and observations) is not a work product of any research department of Swissquote or its affiliates. This material is intended to highlight market action and does not constitute investment, legal or tax advice. If you are a retail investor or lack experience in trading complex financial products, it is advisable to seek professional advice from licensed advisor before making any financial decisions.
This content is not intended to manipulate the market or encourage any specific financial behavior.
Swissquote makes no representation or warranty as to the quality, completeness, accuracy, comprehensiveness or non-infringement of such content. The views expressed are those of the consultant and are provided for educational purposes only. Any information provided relating to a product or market should not be construed as recommending an investment strategy or transaction. Past performance is not a guarantee of future results.
Swissquote and its employees and representatives shall in no event be held liable for any damages or losses arising directly or indirectly from decisions made on the basis of this content.
The use of any third-party brands or trademarks is for information only and does not imply endorsement by Swissquote, or that the trademark owner has authorised Swissquote to promote its products or services.
Swissquote is the marketing brand for the activities of Swissquote Bank Ltd (Switzerland) regulated by FINMA, Swissquote Capital Markets Limited regulated by CySEC (Cyprus), Swissquote Bank Europe SA (Luxembourg) regulated by the CSSF, Swissquote Ltd (UK) regulated by the FCA, Swissquote Financial Services (Malta) Ltd regulated by the Malta Financial Services Authority, Swissquote MEA Ltd. (UAE) regulated by the Dubai Financial Services Authority, Swissquote Pte Ltd (Singapore) regulated by the Monetary Authority of Singapore, Swissquote Asia Limited (Hong Kong) licensed by the Hong Kong Securities and Futures Commission (SFC) and Swissquote South Africa (Pty) Ltd supervised by the FSCA.
Products and services of Swissquote are only intended for those permitted to receive them under local law.
All investments carry a degree of risk. The risk of loss in trading or holding financial instruments can be substantial. The value of financial instruments, including but not limited to stocks, bonds, cryptocurrencies, and other assets, can fluctuate both upwards and downwards. There is a significant risk of financial loss when buying, selling, holding, staking, or investing in these instruments. SQBE makes no recommendations regarding any specific investment, transaction, or the use of any particular investment strategy.
CFDs are complex instruments and come with a high risk of losing money rapidly due to leverage. The vast majority of retail client accounts suffer capital losses when trading in CFDs. You should consider whether you understand how CFDs work and whether you can afford to take the high risk of losing your money.
Digital Assets are unregulated in most countries and consumer protection rules may not apply. As highly volatile speculative investments, Digital Assets are not suitable for investors without a high-risk tolerance. Make sure you understand each Digital Asset before you trade.
Cryptocurrencies are not considered legal tender in some jurisdictions and are subject to regulatory uncertainties.
The use of Internet-based systems can involve high risks, including, but not limited to, fraud, cyber-attacks, network and communication failures, as well as identity theft and phishing attacks related to crypto-assets.

Bitcoin’s Rally Fades Below Resistances — Bearish Wave Setup!Bitcoin ( BINANCE:BTCUSDT ) started to fall as I expected in the previous idea , but failed to break the Heavy Resistance zone($110,000-$105,820) .
Bitcoin is trading near the Resistance zone($107,520-$105,940) , Cumulative Short Liquidation Leverage($106,720-$105,948) , and the Resistance lines .
From the perspective of Elliott Wave theory , Bitcoin appears to have completed a main wave 4 near the Resistance lines. The structure of the main wave 4 was a Double Three Correction(WXY) . One of the signs of the completion of the main wave 4 could be the Evening Star Candlestick Pattern .
I expect Bitcoin to decline to at least Cumulative Long Liquidation Leverage($103,666-$102,800) AFTER breaking the Support line , and the next target is the Support zone($102,000-$107,120) .
Note: Rising tensions between Russia and Ukraine could help drive down Bitcoin.
Note: If Bitcoin touches $107,600, we can expect more pumps.
Please respect each other's ideas and express them politely if you agree or disagree.
Bitcoin Analyze (BTCUSDT), 1-hour time frame.
Be sure to follow the updated ideas.
Do not forget to put a Stop loss for your positions (For every position you want to open).
Please follow your strategy and updates; this is just my Idea, and I will gladly see your ideas in this post.
Please do not forget the ✅' like '✅ button 🙏😊 & Share it with your friends; thanks, and Trade safe.

BTC/USDT Analysis: Rotation Continues
Hello everyone! This is the daily analysis from a trader-analyst at CryptoRobotics.
Yesterday, Bitcoin continued rotating within the newly formed range, showing a slight upward bias.
Today, however, the direction has shifted, and the price has started moving toward the lower boundary of the range. At the moment, price anomalies have appeared around the $105,400 level. If we see a reaction during a test of this level, an intraday short could be considered.
Selling zones:
$105,400 (local absorption of sell pressure),
$107,000–$109,800 (accumulated volumes)
Buying zones:
~$100,000 (initiating volumes),
$98,000–$97,200 (local support),
$93,000 level,
$91,500–$90,000 (strong buying imbalance)
This publication is not financial advice.

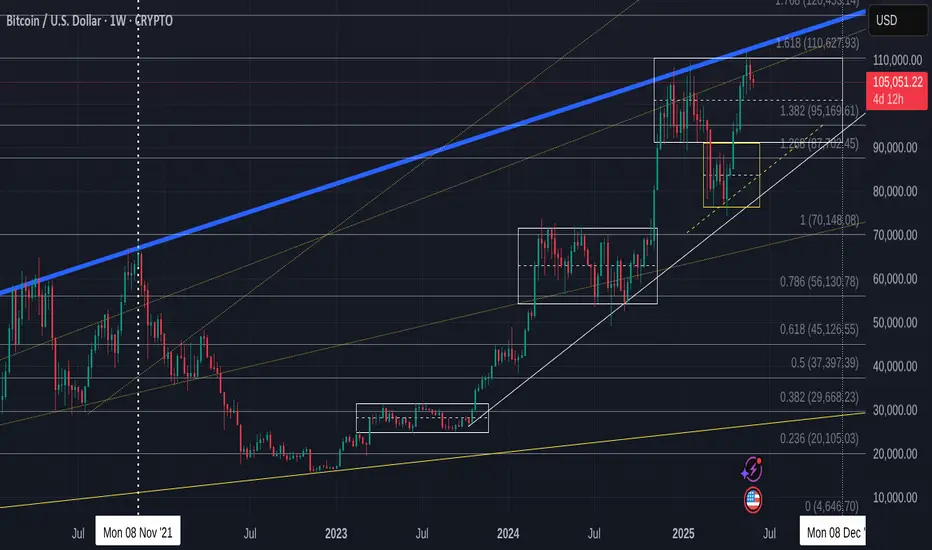
Bitcoin-is that it for now ? Lazy summer, take off in September?
Not posted this chart for a while but we may find it has become Very relevant to what to expect for the next few months
First thing to note is that PA is once again in TOP of range box and ALSO got rejected off the Long Term Blue line that has rejected BTC PA ATH since 2017. This also coincidened with the 1.618 Fib Extension.
Rejection here was highly likely and given how PA had pushed up, it is not surprising to see PA at least taking a breath.
For me, even though we do have the ability to push higher, I am not to sure we will just yet.
The weekly MACD could offer some credence to this idea
The Arrow points to an area that could turn out to be similar to what we are doing now.
The MACD has begun curling over after a prolonged push higher. While There was strength left, PA took a breath and regrouped.
The Chart below shows this period and how BTC PA reacted...and is circled
This was in Dec 2023 to Jan 2024.
PA had just had a sustained push higher and needed a break.and following a 7 week range, PA moved up another 67%
7 weeks from now brings us to near August.
There are charts that point towards a move in August / September
Here is another chart that offers some confluence to this idea.
The Dotted line is a line of support that PA has used as support numerous times this cycle and currently, is almost bang on the 50 SMA. Assuming that PA goes back down to that and bounces again, a 67% rise takes us back up to the Top of Range
Should we drop that far, to the 50 SMA again, we are in the 92K - 95K zone, scaring a LOT of people, wrecking Leverged players and putting Fear everywhere.
PERFECT FOR BUYING
This area also happens to be the 1.382 Fib extension on the main chart, the next Major line of support below us currently.
Should we fall through that, we reach the Bottom of Range and the intersection with the 50 SMA in.......August
So, we have to wait and see. We can push higher now but to do so would require breaking through that long term Blue line of resistance. I am not sure we can do that just yet.
Also, Should we post a RED June candle, Even a small one, the ideas in the Monthly candle post I recently posted also back up the idea of a lazy summer...... and a move higher around Mid to late August
Stay safe