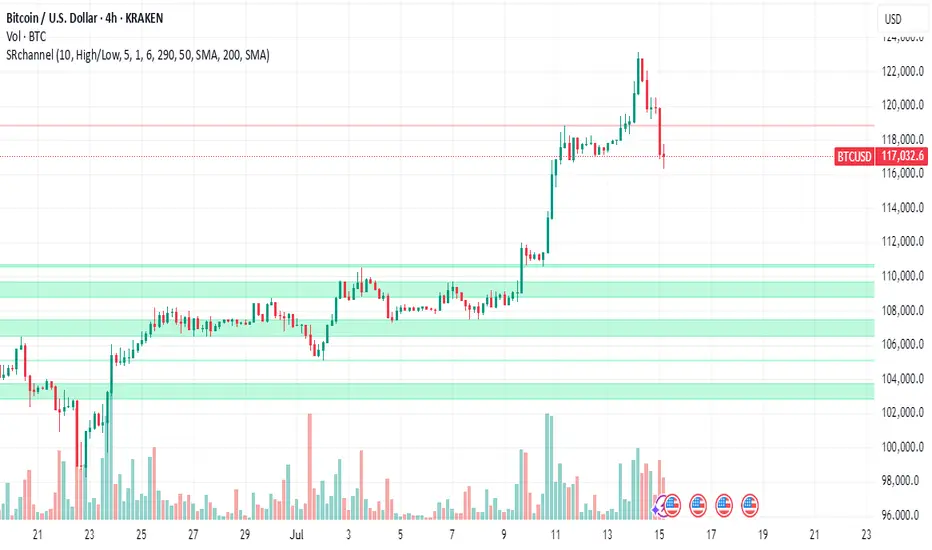
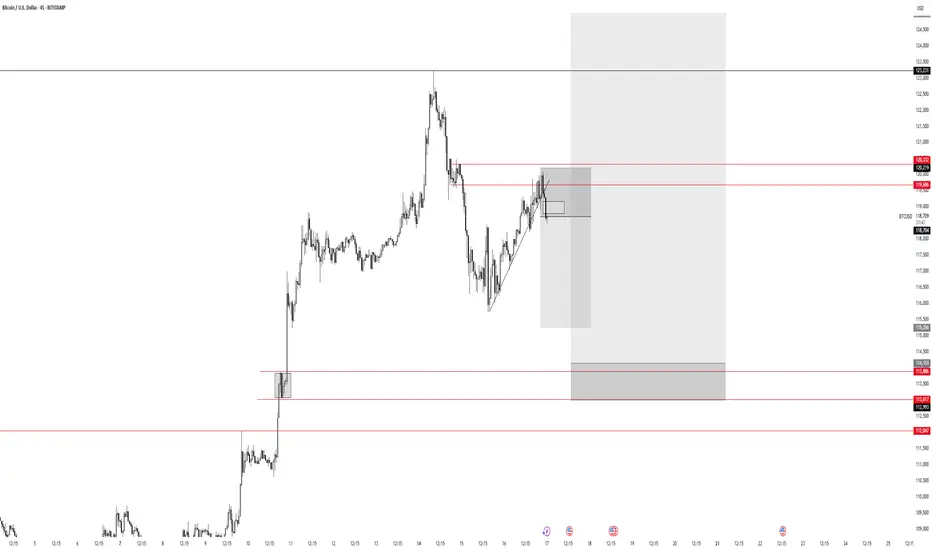
BTC 4H Structure Break – Long Bias with Conditions🚀 BTC (Bitcoin) has clearly broken bullish market structure on the 4-hour timeframe.
📈 My bias is to ride the momentum and look for a pullback to enter long.
✅ I follow a specific entry criteria — price must pull back into the imbalance, find support, and then form a bullish break of structure on a 15m chart to trigger an entry.
❌ If that setup doesn't play out, we simply abandon the idea.
⚠️ This is not financial advice.
Bitcoinprediction

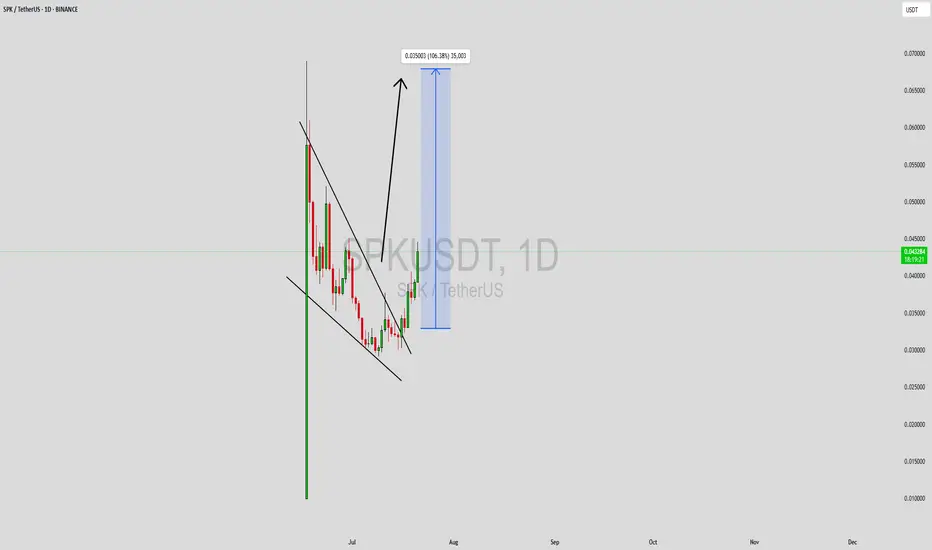
SPKUSDT Forming Falling WedgeSPKUSDT is currently forming a well-defined falling wedge pattern on the chart, a setup often associated with strong bullish reversals. This pattern suggests that the ongoing downward momentum is losing strength, and buyers may soon take control. The tightening price range within the wedge, combined with good volume activity, adds conviction to the breakout potential. Historically, such formations signal the end of a corrective phase and the beginning of an impulsive bullish wave, positioning SPK for a sharp upside move.
The technicals are aligning for a breakout with an expected gain of 90% to 100% or more. The confluence of strong support zones, oversold indicators, and increased trading volume points to growing investor confidence. Once SPK breaks above the wedge resistance with confirmation, it can trigger a significant rally, fueled by momentum traders and long-term investors entering the market. These conditions often attract attention across the crypto community, making SPK a high-potential short-term trade.
Market sentiment around SPK is also strengthening, with more traders discussing the project and its underlying fundamentals. As volume increases and the technical breakout setup matures, SPK could become one of the more explosive movers in the altcoin space. The falling wedge pattern’s reliability, combined with rising investor interest, makes this chart highly attractive for swing traders and breakout hunters alike.
✅ Show your support by hitting the like button and
✅ Leaving a comment below! (What is You opinion about this Coin)
Your feedback and engagement keep me inspired to share more insightful market analysis with you!
Bitcoin Technical Setup: Support Holds, Eyes on $118,600Bitcoin ( BINANCE:BTCUSDT ) moved as I expected in the previous ideas and finally completed the CME Gap($117,255-$116,675) in the last hours of the week. ( First Idea _ Second Idea )
Before starting today's analysis, it is important to note that trading volume is generally low on Saturday and Sunday , and we may not see a big move and Bitcoin will move in the range of $121,000 to $115,000 ( in the best case scenario and if no special news comes ).
Bitcoin is currently trading near the Support zone($116,900-$115,730) , Cumulative Long Liquidation Leverage($116,881-$115,468) , Potential Reversal Zone(PRZ) , and Support lines .
According to Elliott Wave theory , Bitcoin had a temporary pump after the " GENIUS stablecoin bill clears House and heads to Trump's desk " news, but then started to fall again, confirming the end of the Zigzag Correction(ABC/5-3-5) . Now we have to wait for the next 5 down waves or the corrective waves will be complicated .
I expect Bitcoin to rebound from the existing supports and rise to at least $118,600 . The second target could be the Resistance lines .
Do you think Bitcoin will fill the CME Gap($115,060-$114,947) in this price drop?
Cumulative Short Liquidation Leverage: $121,519-$119,941
Do you think Bitcoin can create a new ATH again?
Note: Stop Loss(SL)= $114,700
Please respect each other's ideas and express them politely if you agree or disagree.
Bitcoin Analyze (BTCUSDT), 15-minute time frame.
Be sure to follow the updated ideas.
Do not forget to put a Stop loss for your positions (For every position you want to open).
Please follow your strategy and updates; this is just my Idea, and I will gladly see your ideas in this post.
Please do not forget the ✅' like '✅ button 🙏😊 & Share it with your friends; thanks, and Trade safe.

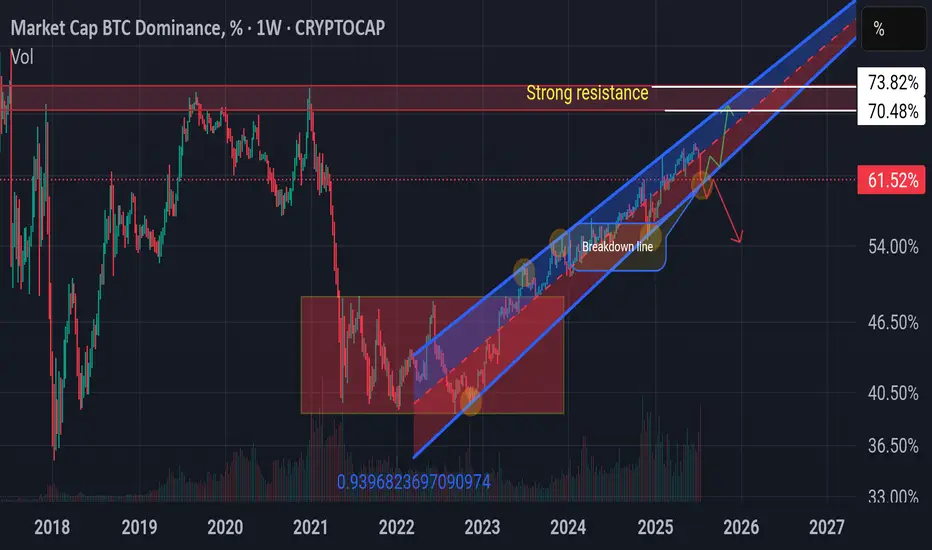
BTC Dominance Rebound???🧭 Market Outlook
BTC Dominance (BTC.D) remains in an uptrend channel → investors still favoring CRYPTOCAP:BTC over alts.
📉 From Jun 28 to Jul 18, BTC.D dropped -7%, fueling a solid rally in ETH & alts.
⚠️ BTC.D may bounce back if it fails to break the key support (breakdown line/golden circle). Next resistance zone: 70.48%–73.82%. If this plays out → alts may lag during BTC pumps & dump harder on corrections.
🌊 Altseason only if BTC.D breaks down decisively.
But not all alts will fly. Be selective — don’t go all-in on a single coin. 🧠
Bitcoin Liquidity updateCRYPTOCAP:BTC
📄 Update on liquidity movement and key liquidity cluster points
◀️ Summary of the first movement: A sale occurred at 121826 and a break happened at 117612, after which liquidity was collected between 116 - 115
◀️ After collecting liquidity, we mentioned that breaking 117612 would allow testing 119723, and that is what happened
⭕️ Now, a selling range has formed between 120813 - 121826, which is clear on the price chart and the way it bounced down
🟣 The current movement is confined between 118398 - 117612
📄 Regarding trading ideas:
⭕️ The thought here is to buy between 11600 - 114813 if a break occurs at 117612 and trading starts below it
⭕️ The second idea, in case this break does not happen, is to wait for confirmation of trading above 118398, and in this case, it's preferable to wait until Monday

Bitcoin 2013 Fractal chart UPDATE = Nailed the PA target
Been posting this chart for the last few years and drew that Circle that PA hit, back in Feb..Way befppre PA arrived there.
I also drew that dashed Arrow line at the same time ad, as we can see frm the Daily chart beow, PA is bang on that line.
Why is it importnat that you know this ?
Because those Circles and Dashed lines are transposed from teh 2017 - 2021 fractal !
We do seem to have moved from one Fractal to another.
This has yet to be fully confirmed and the July Candle Close will certainly help identify this if we get a large green candle.
So, for now, we wait.
I will post more details about this later but fir now, if we follow this line, we can expect a cycle ATH of around 270K - 322K in Q4 2025
And then the BIG question is "What is next ?" because, as I have pointed out n another posts, we are also leaving a long term cycle (2009 - 2025 ) line of resistance....that we just broke free of...but need to remain above.
Judy is CRUCIAL

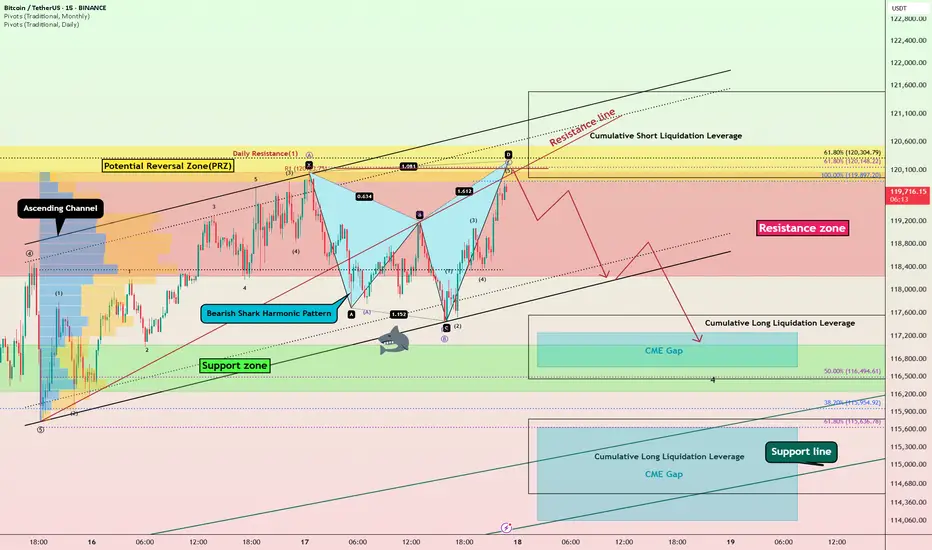
Bitcoin Bearish Shark Detected – CME Gap Below $115K in Sight?Today's analysis is on the 15-minute timeframe , following the previous analysis I shared with you on the 1-hour timeframe .
Bitcoin ( BINANCE:BTCUSDT ) is currently trading in the Resistance zone($120,100-$118,240) near the Potential Reversal Zone(PRZ) and Cumulative Short Liquidation Leverage($121,490-$119,965) .
From a technical perspective , it looks like Bitcoin is completing the Bearish Shark Harmonic Pattern on the 15-minute timeframe .
From an Elliott wave theory perspective, it looks like Bitcoin is completing the microwave 5 of wave C of the Zigzag Correction(ABC/5-3-5) .
I expect Bitcoin to start falling from the top of the ascending channel and at least decline to the lower line of the descending channel, and if the ascending channel breaks this time, we should wait for the CME Gap($117,255-$116,675)/CME Gap($115,060-$114,947) to fill.
Cumulative Long Liquidation Leverage: $117,556-$116,465
Cumulative Long Liquidation Leverage: $115,773-$114,513
Do you think Bitcoin can create a new ATH again?
Note: Stop Loss(SL)= $121,620
Please respect each other's ideas and express them politely if you agree or disagree.
Bitcoin Analyze (BTCUSDT), 15-minute time frame.
Be sure to follow the updated ideas.
Do not forget to put a Stop loss for your positions (For every position you want to open).
Please follow your strategy and updates; this is just my Idea, and I will gladly see your ideas in this post.
Please do not forget the ✅' like '✅ button 🙏😊 & Share it with your friends; thanks, and Trade safe.
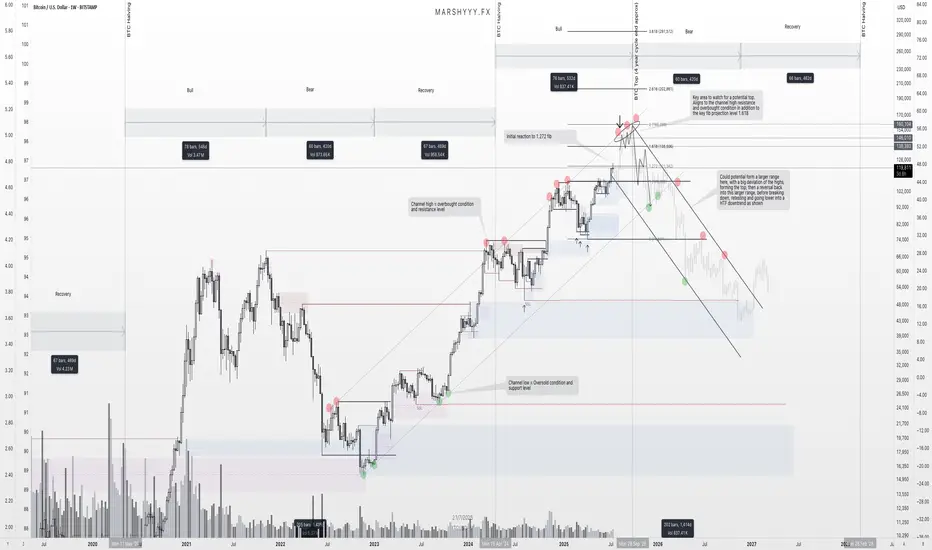
BTC – Final Push Before the Top? Here's What I’m WatchingBeen getting a lot of questions recently about where I think BTC tops this cycle, so I figured it’s time to lay out what I’m seeing on the higher timeframes and what could be coming next.
First off, I want to stress this again — USDT.D will be the key chart for spotting the top. It’s been one of the most accurate indicators across the board for understanding tops and bottoms. But it’s even more powerful when used alongside broader structure and confluence, which is what I’m doing here.
Looking at BTC’s high timeframe structure, I’ve been tracking this ascending trend channel since 2023 — and we’ve remained within its bounds beautifully. Every leg up has been met with a reaction near the channel highs, while each major correction has tapped into the lower channel support or just below midline before continuing the trend.
Right now, price is pushing back up toward that upper channel resistance, and if it behaves like it has previously, I’d expect it to act as a major magnet again. That aligns with a projected range of $140,000 to $160,000, depending how deep the wick runs or how extended this move gets from the channel midline.
On top of that, fib extensions from the previous high to low give us another layer of confidence. We’ve already seen a reaction at the 1.272 level, which paused price temporarily. The next big fib? The 1.618 — which sits right around $138k — adding confluence with the top of this HTF trend channel.
What makes this even more interesting is that this move is aligning near-perfectly with the 4-year cycle structure, which suggests a potential cycle top around September 2025. That’s roughly two months away, and it fits the pattern of previous cycles where BTC tops approximately 18–20 months post-halving.
As we approach this zone, I’ll be watching for the usual signs: slowing momentum, bearish divergence, volume anomalies, and rejection candles into resistance. But I won’t just be relying on the BTC chart alone. I’ll be stacking confluences from other key indicators too — USDT.D, BTC.D, macro risk indicators, and stablecoin flows — to confirm if this is truly the top or if there’s one more leg left in the tank.
Once the top does form, whether it's $138k or $160k or somewhere in between, I think we move into the distribution phase that begins the next macro downtrend. The next few years will be about preservation and accumulation again, and I’m already eyeing zones like $49k and below as potential long-term HTF demand levels when that time comes.
For now, we’re in what I believe is the final bullish leg of this cycle. I’m positioned, prepared, and watching closely for signs of exhaustion as we move into this zone of confluence.
Let the market do its thing — just make sure you’ve got a plan for when the music stops.
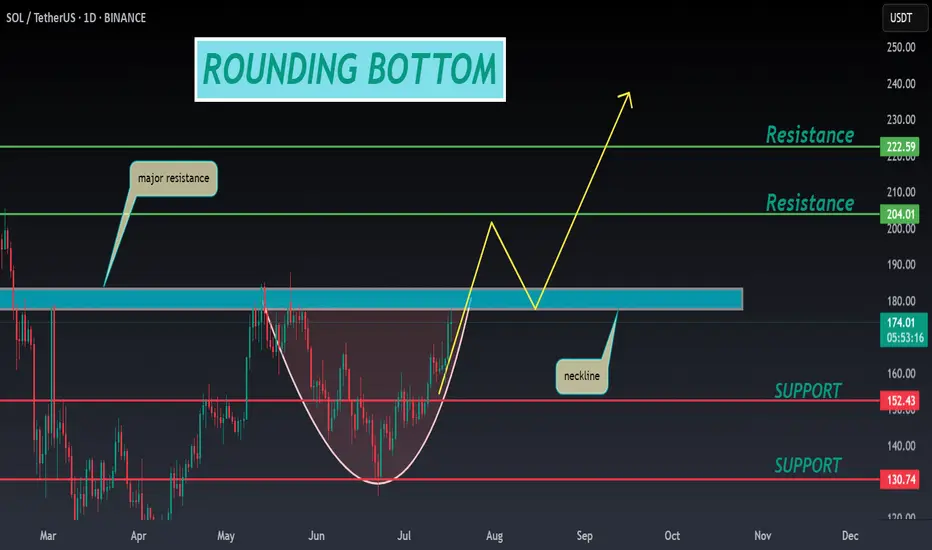
SOL ANALYSIS🔮 #SOL Analysis 💰💰
📊 #SOL is making perfect and huge rounding bottom pattern in daily time frame, indicating a potential bullish move. If #SOL retests little bit and breakout the pattern with high volume then we will get a bullish move📈
🔖 Current Price: $173.75
⏳ Target Price: $204.00
⁉️ What to do?
- We have marked crucial levels in the chart . We can trade according to the chart and make some profits. 🚀💸
#SOL #Cryptocurrency #Pump #DYOR
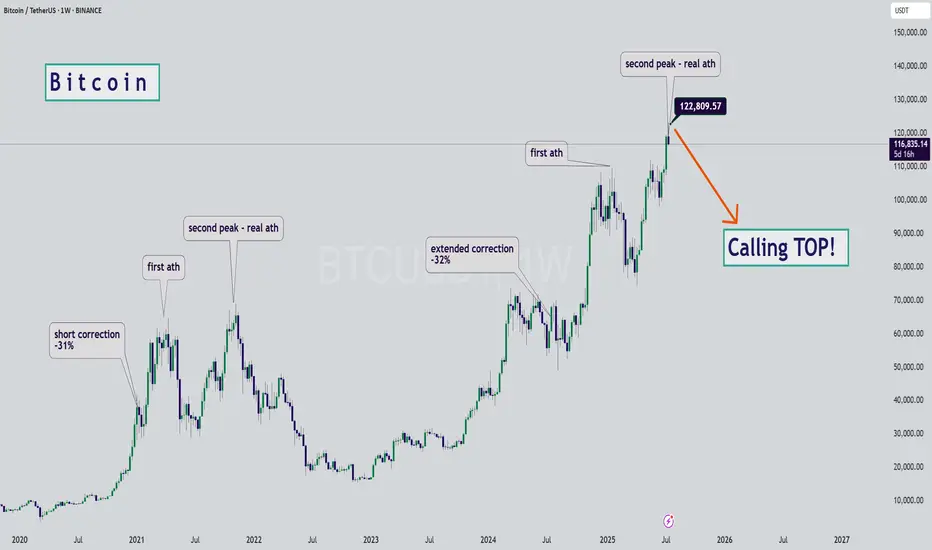
BTC - Calling the Start of the Bearish SeasonHello Watchers ☕
This was my previous Bitcoin update where I had a target of $116K, and also then closed all open positions at $122K:
I'm calling the top here mainly because of the way the chart looks, it really is classic Wyckoff if you look at the duration of the current bullish cycle, which has lasted a whole 973 Days with a 564% increase. What goes up, must come down!
Just for interest sake, the previous bullish cycle ran for 600 days with a 700% increase.
BTC - Last Resistance Before New HighsPrice is back at the same zone that rejected it months ago — but this time with momentum and a clean trendline behind it. Stoch RSI is stretched, signaling a possible short-term cooldown… or a breakout into uncharted territory.
Keep your eye on that 126K liquidity magnet 👀
#Bitcoin #BTCUSD #CryptoTrading #ChartAnalysis #TechnicalAnalysis #BreakoutTrading #TrendlineSupport #QuantTradingPro #TradingView

BITCOIN PREDICTION: INSIDER DATA THAT WILL HIT YOU HARD(warning)I am sharing with you my personal insider data of what I know about Bitcoin right now!

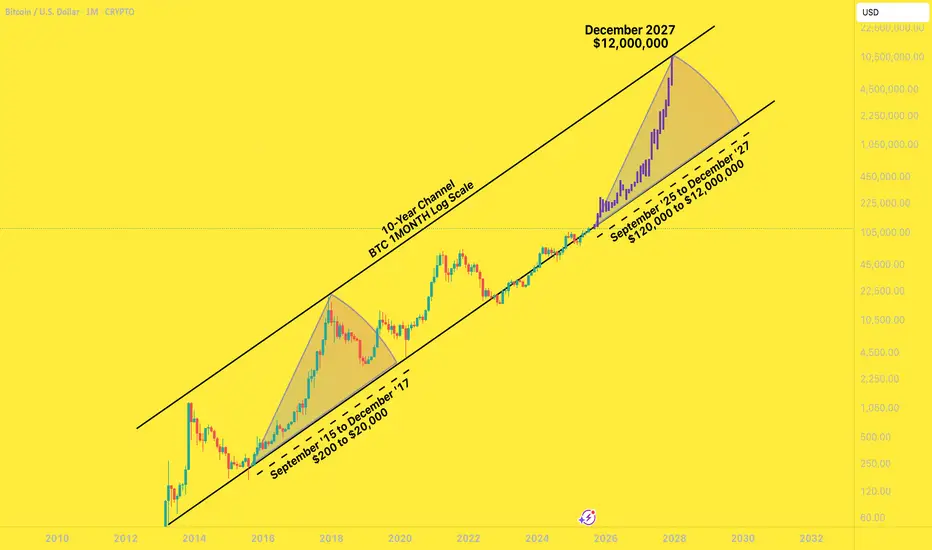
BTC to $12,000,000 December '27I had a years-old bookmarked chart from @MillionaireEconomics that I wanted to update and pick a random, extremely bullish candle pattern from the last time BTC came off the bottom channel to slap on it.
Riddle me this:
Why shouldn't Bitcoin go to $12,000,000 by December 2027?
Saylor continues to lead the way for global companies to scramble to build their own BTC warchests. These early adopters are having investor money dumped into them by the truckload.
Countries are stacking BTC
The BTC ETFs are a smash hit
Trump is all for making his own multi-billy family bitty stack
Mid-curvers will sell far too early, for far too little.
In the next two years, you'll be bombarded with countless, seemingly good reasons to sell your Bitcoins for hundreds of thousands of dollars - and then millions of dollars.
A shocking number of people will be far too early to sell. They will wake up in a cold sweat, night after night, haunted by their "could-have-been" stack, the number that updates in their head ten times a day, going up by six or seven figures a day .
... until they FOMO right back in at $11,999,999.
BTC FORECASTExpected push to the downside(below 114,400 region)
Breakout above current marked high.
Expected ATH(125,000) as target.
Best Regards,
Gideon Stephen (GS)
#bitcoin #crypto
Bitcoin -> The bullrun is not over!📣Bitcoin ( CRYPTO:BTCUSD ) is still totally bullish:
🔎Analysis summary:
A couple of months ago Bitcoin broke above the previous all time high. This was basically just the expected creation of new highs, perfectly following the underlying cycles. With respect to the long term rising channel formation, this bullrun on Bitcoin is just starting.
📝Levels to watch:
$100.000
🙏🏻#LONGTERMVISION
Philip - Swing Trader

Altcoin Season Has Officially Begun!We're now seeing top altcoins like ETH, BONK, and ONDO outpacing Bitcoin with impressive gains.
Ethereum (ETH) has just broken above $3,100
BONK is surging back toward its winter highs
Portfolios are growing daily — even without active trading
The momentum is building fast, and the next few weeks could be highly rewarding for altcoin holders. Buckle up — Altcoin Season is here.

Bitcoin Prediction that will blow your mind (warning for bulls) I am showing you that BTC made new ATH only in the USD pair and not in other pairs like EUR, and why, and what you can anticipate and what to watch out for from #Bitcoin next.

Bitcoin - V-shape recovery down towards the 4h FVG at $111.000?The move began with a strong rally that peaked near the $123,000 level. After hitting that high, Bitcoin quickly reversed and sold off aggressively, forming a classic V-shaped pattern. This type of formation typically indicates a strong shift in momentum, where bullish control is quickly overtaken by sellers, leading to swift downward movement.
4H bearish FVG
Shortly after the initial drop, Bitcoin made a retest of the bearish 4H FVG (Fair Value Gap) around the $119,000 to $120,500 zone. This fair value gap was created during the sharp move down and represented an area of inefficiency in price. The chart shows that price moved back into this zone and was “perfectly retested,” getting rejected almost immediately. This rejection confirmed that sellers are respecting this imbalance, turning it into a short-term resistance level.
Market structure
As the price failed to reclaim the fair value gap and continued lower, it broke the market structure at around $117,000. This break suggests that the previous higher low was taken out, signaling a bearish shift in the intermediate trend. The market structure break often acts as confirmation that buyers are losing control and lower prices are likely.
CME gap
Adding to the downside pressure is the CME gap, labeled as the "BTC CME GAP" on the chart. This gap spans from roughly $114,000 to $116,300 and was formed over the weekend when the CME (Chicago Mercantile Exchange) was closed. Historically, Bitcoin has shown a tendency to "fill" these gaps by revisiting the price levels within them. The current price action has already started to dip into this region, which could suggest further downside to complete the gap fill.
Bullish 4H FVG with support
Finally, the chart hints at the potential drop to the lowest 4H FVG and previous resistance, located just above $111,000. This fair value gap aligns closely with a prior resistance level from earlier in the month, making it a logical magnet for price if selling pressure persists. It represents a confluence zone where buyers may look to step in again, especially if the CME gap is filled and the market is searching for support.
Conclusion
In summary, Bitcoin is showing bearish technical signs following a V-shape top and a strong rejection from the 4H FVG at $120,000. The break of market structure and ongoing fill of the CME gap suggest that further downside toward the $111,000 level is a strong possibility. Traders should watch closely for price reaction in that lower fair value gap zone, as it could serve as a critical area for a potential bounce.
Disclosure: I am part of Trade Nation's Influencer program and receive a monthly fee for using their TradingView charts in my analysis.
Thanks for your support. If you enjoyed this analysis, make sure to follow me so you don't miss the next one. And if you found it helpful, feel free to drop a like and leave a comment, I’d love to hear your thoughts!

Global M2 Money Supply (70/84/90 Day offset) and $150k BTCI'm using Global M2 slightlty different than most here, and showing it behaves differently during different periods of the cycle.
Many people say M2 leads Bitcoin by 10-12 weeks (70 - 84 Days) and I've seen periods where it does... But in this phase of the bull-run 90 days is working best.
We can see the dip in M2 around now coinciding with the drop in Bitcoin prices.
Of course, these are not directly correlated and can't be relied upon as predictive.
But it's following pretty close, and overall looks great for further upside!
I'll follow up with a video on this if anybody is interested.

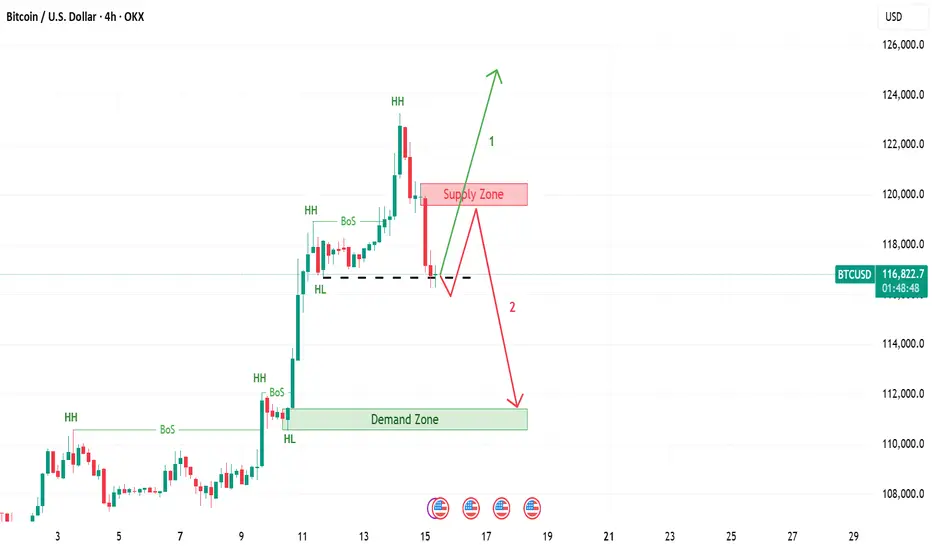
Bitcoin | 2 Scenarios If the 4 hour candle closes below last HL, then expect price return to supply zone and then go down till demand zone. If not, expect continuation of the upward trend, when 4 hour candle breaks last HH.
Which scenario you expect?
Bitcoin Eyes $200K: Why a Correction Could Come FirstAs Bitcoin continues its remarkable run, optimism is high that we could see BTC break the $200,000 mark this year. The momentum is there, with bullish sentiment across the crypto and traditional finance spaces. Yet, it’s important to acknowledge a potential short-term correction ahead before new highs are reached.
Why a Correction May Happen Soon
Several factors point to a volatile period in the weeks ahead:
Upcoming Tariffs: On August 1st, the new round of tariffs announced by President Trump is set to take effect. Trade disputes historically introduce uncertainty into global markets and can sap risk appetite, even in alternative assets like crypto.
Federal Reserve Policy: The Federal Reserve has not yet begun lowering interest rates. High rates continue to pressure both equity and crypto markets by making cash relatively more attractive and increasing the cost of leverage.
Geopolitical Tensions: Ongoing instability in the Middle East adds another layer of unpredictability. Geopolitical flare-ups often lead to market volatility as investors act defensively.
The Takeaway
While Bitcoin is on track to reach unprecedented levels this year, investors should remain mindful of the broader market context. Short-term corrections are part of any healthy bull run and can be driven by macroeconomic and geopolitical events. Staying informed and maintaining a disciplined approach will be crucial for navigating what promises to be an exciting—and eventful—rest of the year.
Not Investment Advice!
#crypto #bitcoin #short #correction #dump #uncertainty #volatility #war #news #bearish

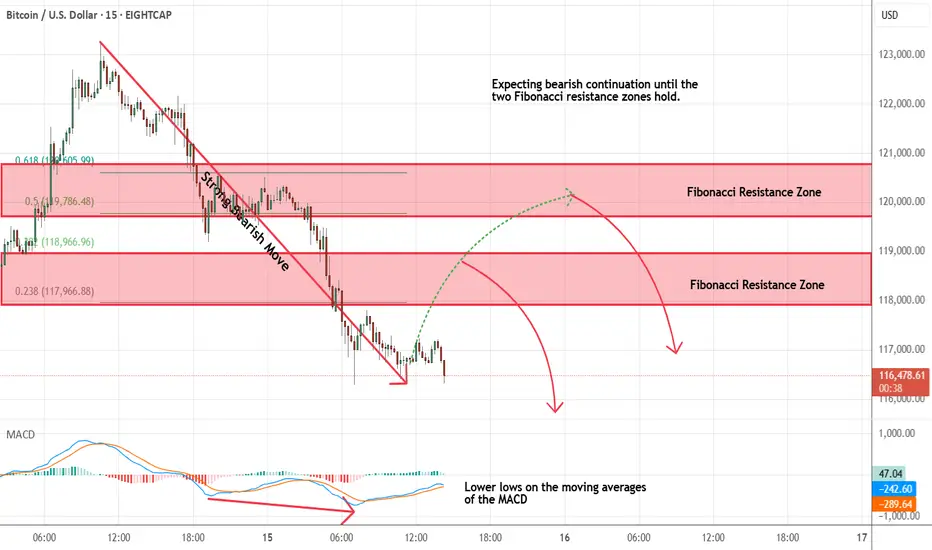
Bitcoin - Looking To Sell Pullbacks In The Short TermM15 - Strong bearish move.
Lower lows on the moving averages of the MACD.
No opposite signs.
Currently it looks like a pullback is happening.
Expecting bearish continuation until the two Fibonacci resistance zones hold.
If you enjoy this idea, don’t forget to LIKE 👍, FOLLOW ✅, SHARE 🙌, and COMMENT ✍! Drop your thoughts and charts below to keep the discussion going. Your support helps keep this content free and reach more people! 🚀
--------------------------------------------------------------------------------------------------------------------
Bitcoin Hits New Highs: Is The Institutional Money Here To Stay?Bitcoin Hits New Highs, Gains Stability and Scale in Its Institutional Era: Will It Last?
From a volatile and often misunderstood outsider, Bitcoin has embarked on a remarkable transformation, evolving into what many now see as a foundational financial layer. This new era is not fueled by the fleeting whims of retail hype, but by the calculated, long-term strategies of professional capital. The steady influx of institutional investors is profoundly reshaping Bitcoin's character, taming its notorious volatility and broadening its accessibility to everyday individuals. This seismic shift begs the question: is this newfound stability and scale a permanent feature of the financial landscape, or a transient phase in Bitcoin's tumultuous history?
The Dawn of a New Epoch: The Institutional Stampede
For years, the narrative surrounding Bitcoin was one of a grassroots monetary experiment, a digital curiosity championed by cypherpunks and early internet adopters. Wall Street remained a skeptical spectator, wary of the asset's wild price swings, its lack of regulatory clarity, and its disruptive potential. However, Bitcoin's unyielding resilience and its core value proposition of a decentralized, finite digital asset gradually wore down this institutional resistance. The floodgates did not just creak open; they were blown apart with the regulatory approval of spot Bitcoin Exchange-Traded Funds (ETFs). This landmark decision marked a clear and decisive tipping point, a formal invitation for mainstream finance to embrace the world's first cryptocurrency.
This regulatory green light has had a profound and cascading impact. It has, in a single stroke, legitimized Bitcoin in the eyes of the most conservative financial establishments. More importantly, it has provided a familiar, regulated, and highly accessible entry point for a vast and previously untapped ocean of capital. Exposure to Bitcoin is no longer confined to specialized crypto-native platforms, which often carried a steep learning curve and perceived security risks. Now, it can be seamlessly integrated into the traditional investment portfolios that millions of people rely on, managed through their existing brokerages, pension funds, and even insurance products. This growing wave of institutional adoption is not merely inflating Bitcoin's price; it is fundamentally anchoring it more firmly within the global economy, weaving it into the very fabric of the system it was once designed to challenge.
The numbers illustrating this shift are staggering. In a remarkably short period, spot Bitcoin ETFs have amassed well over $138 billion in assets. This figure is not static; it represents a dynamic and growing pool of capital, reflecting sustained institutional interest. Registered Investment Advisors (RIAs), who manage the wealth of millions of Americans, along with sophisticated hedge funds and forward-thinking pension funds, represent a growing share of this investment. These are not speculative day traders but entities with long-term horizons and rigorous due diligence processes. Their participation signals a deep conviction in Bitcoin's future.
This institutional embrace extends far beyond the realm of ETFs. Major corporations have continued their aggressive accumulation of Bitcoin, viewing it as a treasury reserve asset superior to cash. This trend of corporate and institutional adoption is a key driver of Bitcoin's maturation, lending it a newfound sense of legitimacy and stability that was unimaginable just a few years ago. The current market cycle is thus being defined not by the frenetic energy of individual retail investors, but by the methodical and powerful currents of professional capital.
Taming the Beast: Volatility in the Institutional Age
One of the most significant and welcome consequences of this institutional influx has been the taming of Bitcoin's infamous volatility. For most of its history, Bitcoin's price chart resembled a dramatic mountain range, with breathtaking peaks and terrifying valleys. This volatility was its defining characteristic and its biggest barrier to mainstream acceptance. Institutional capital, however, operates on a different wavelength. With its longer time horizons and more systematic, data-driven approach, it behaves differently from the often emotionally-driven retail market.
While individual investors are more prone to panic-selling during sharp price dips or piling in during euphoric rallies, large institutions are more likely to employ disciplined strategies like dollar-cost averaging. They see price corrections not as a reason to panic, but as a buying opportunity. This behavior provides a stabilizing force, creating a floor during downturns and tempering the irrational exuberance of market tops.
This shift in market dynamics is evident in the flow of funds into the new financial products. These investment vehicles have frequently seen strong net inflows during price corrections, with major asset managers absorbing billions in capital even as retail sentiment soured. This institutional buying pressure acts as a powerful buffer, moderating the extreme price swings that have historically characterized the Bitcoin market.
While Bitcoin's volatility remains higher than that of traditional assets like gold or global equities, its trajectory is one of marked and consistent decline. This decline is a natural consequence of its growing market capitalization. As the total value of the network expands, the relative impact of new capital inflows or outflows is diminished, leading to smoother price action.
Interestingly, Bitcoin's volatility has at times converged with, and even fallen below, that of some mega-cap technology stocks, which themselves can exhibit significant price swings. This convergence is making traditional investors take a closer look, as the risk-reward profile of Bitcoin becomes more palatable and understandable. Historically, investors have been well-compensated for taking on Bitcoin's volatility, with its risk-adjusted returns often outperforming major stock indices over multi-year periods.
From Digital Gold to a Financial Base Layer: An Evolving Narrative
For much of its existence, Bitcoin has been championed as "digital gold." This narrative is powerful and intuitive. Like gold, it has a finite, predictable supply. It is decentralized, meaning no single entity can control it or create more of it at will. And it is censorship-resistant, offering a store of value outside the traditional financial system. This narrative has been a potent driver of adoption, particularly among those seeking a hedge against inflation, currency debasement, and geopolitical uncertainty.
However, the increasing stability brought about by institutional investment is fostering a new and complementary narrative: Bitcoin as a potential medium of exchange and, more broadly, as a foundational settlement layer for the global financial system. Lower volatility is a crucial prerequisite for any asset to function effectively as a currency. When prices are relatively stable, merchants and consumers can transact with confidence, knowing the value of their money will not drastically change overnight.
The development of Layer 2 solutions, most notably the Lightning Network, is a critical piece of this puzzle. These protocols are built on top of the Bitcoin blockchain and are designed to enable faster, cheaper, and more scalable transactions. They address the primary technical hurdles that have hindered Bitcoin's use for everyday payments, such as coffee or groceries. As this technological infrastructure continues to mature and gain adoption, Bitcoin's utility beyond a simple store of value is poised to expand significantly.
Furthermore, Bitcoin's historically low correlation with traditional assets like stocks and bonds makes it an exceptionally valuable tool for portfolio diversification. In a world where asset classes are becoming increasingly interconnected, Bitcoin offers a unique return stream. Adding even a small allocation of Bitcoin to a traditional 60/40 portfolio can potentially enhance returns over the long term without a commensurate increase in overall risk. This diversification benefit is a key part of the thesis for many institutional investors.
Navigating the Market's Pulse: Price, Psychology, and Predictions
As Bitcoin navigates this new institutional era, the question on every investor's mind is: where does the price go from here? The recent surge to new all-time highs above the $123,000 mark has been met with a mix of bullish enthusiasm and cautious optimism. After reaching this peak, the market saw a natural retreat, with bulls pausing for a breath and prices consolidating. The price action has been dynamic, with a fresh increase starting above the $120,000 zone before finding temporary resistance and trading near the $118,500 level. This kind of price discovery, including breaks below short-term bullish trend lines, is characteristic of a market absorbing new information and establishing a new support base.
Technical analysis suggests that the current rally may have further to run. Having decisively broken through key psychological and technical resistance zones, some analysts see a clear path toward $135,000 or even $140,000 in the medium term. The price trading well above key long-term moving averages confirms that the underlying momentum remains strongly bullish.
However, a closer look at market sentiment and on-chain data reveals a more nuanced and perhaps even more bullish picture. Despite the record-breaking prices, the market has yet to enter the state of "extreme greed or euphoria" that has characterized the absolute peaks of previous bull cycles. Key metrics that track the profitability of long-term holders remain below the "euphoria" zone, suggesting that the smart money is not yet rushing to take profits. This could indicate that the current rally, while impressive, is still in its early or middle phases, with more room to grow before reaching a cyclical top. A delay in the full-blown bull market euphoria could ultimately push Bitcoin higher than many expect.
Of course, the market is not a one-way street. The spike to $123,000 was followed by an increase in Bitcoin flowing into exchanges, a potential sign of short-term profit-taking and a cooling-off period. Even large, strategic players may take profits during rallies. The news of Bhutan's sovereign wealth fund strategically unloading a portion of its holdings is a prime example. While these sales can introduce short-term selling pressure, they are also a healthy part of a functioning market. The fact that inflows, even at the peak, were just a fraction of those seen in earlier parts of the year suggests that the selling pressure is not yet overwhelming.
The Sustainability of the Institutional Era: A Critical Analysis
The institutionalization of Bitcoin is undoubtedly a paradigm shift, but its long-term sustainability is not a foregone conclusion. While the current trend is one of increasing adoption and stability, there are several factors that could challenge this new status quo and must be considered by any serious investor.
One potential risk is the concentration of Bitcoin in the hands of a few large institutions. While this brings stability in the short term, it also introduces a potential point of centralization in a decentralized system. If a handful of major asset managers were to simultaneously decide to sell their holdings—perhaps due to a change in their own internal risk models or a major macroeconomic shock—it could trigger a significant market downturn. Such a move would likely be exacerbated by retail investors following the lead of these financial giants.
Regulatory risk also remains a significant and unpredictable concern. While the approval of spot Bitcoin ETFs in the United States was a major step forward, the global regulatory landscape is a complex and evolving patchwork. Any future crackdowns, unfavorable tax treatments, or restrictive regulations in major jurisdictions could dampen institutional enthusiasm and hinder further adoption. The path to full regulatory clarity is likely to be long and fraught with challenges.
Furthermore, the narrative of Bitcoin as an inflation hedge has yet to be definitively proven across all possible economic conditions. While it has performed well during recent periods of high inflation and monetary expansion, its correlation with risk assets means it can also be sensitive to economic downturns and tightening financial conditions. A prolonged period of global recession or stagflation could test its resilience as a store of value in new and unexpected ways.
Conclusion: A Maturing Asset in an Evolving World
Bitcoin has come an immeasurably long way from its obscure beginnings as a niche digital currency for a small community of technologists. The influx of institutional capital has ushered in a new era of stability, accessibility, and legitimacy. The launch and wild success of spot Bitcoin ETFs has been the primary catalyst, providing a regulated and familiar on-ramp for a vast pool of professional money that is reshaping the asset's very DNA.
This institutional embrace is about far more than just price appreciation; it is fundamentally changing the character of Bitcoin. Its volatility, while still present, is on a clear downward trend, making it a more viable contender as both a global store of value and a neutral settlement network. The long-held dream of Bitcoin as a foundational layer of a new, more transparent financial system is slowly but surely taking shape.
However, the road ahead is not without its challenges. The risks of institutional concentration, regulatory uncertainty, and macroeconomic headwinds are real and should not be underestimated. The sustainability of this new era will depend on a delicate interplay of market forces, regulatory developments, and continued technological innovation on its network.
What is clear is that Bitcoin has earned its place on the world's financial stage. It is no longer an outsider looking in, but a maturing asset that is being progressively integrated into the global economic fabric. Whether this institutional era will be a lasting one remains the defining question of our time. But one thing is certain: Bitcoin's journey is far from over, and its evolution will continue to be one of the most compelling and consequential stories in the world of finance for years to come.