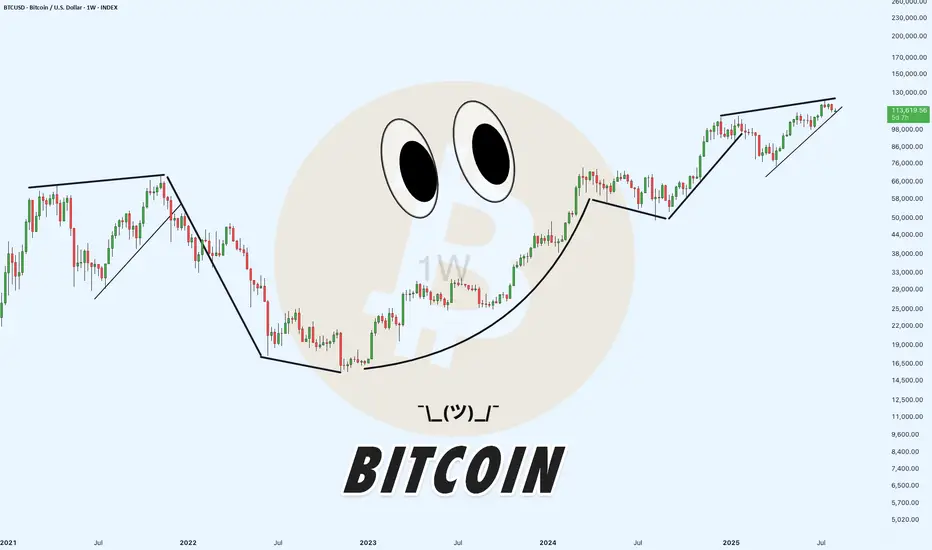
BTC - Key insight you must pay Attention to!📊 This is a weekly Bitcoin chart with a key insight you should pay close attention to:
In a bullish trend, you’ll always notice higher highs being formed. Once price breaks the previous high, it's typically a strong confirmation of bullish continuation, as shown by the BOS (Break of Structure) levels marked in blue on the chart.
🔻 The BOS level must not be broken to the downside — if that happens, it signals a trend reversal from bullish to bearish, just like what occurred at the red zone I highlighted.
✅ Currently, Bitcoin has broken its previous high to the upside, which indicates the bullish trend is continuing.
🎯 Next target: $150K.
⚠️ However, if BTC pulls back for a retest and fails to bounce quickly, it will be considered a strong sell signal. That would likely lead to a correction back down toward the $80K zone.
Best regards:
Ceciliones🎯
Bitcoinprice

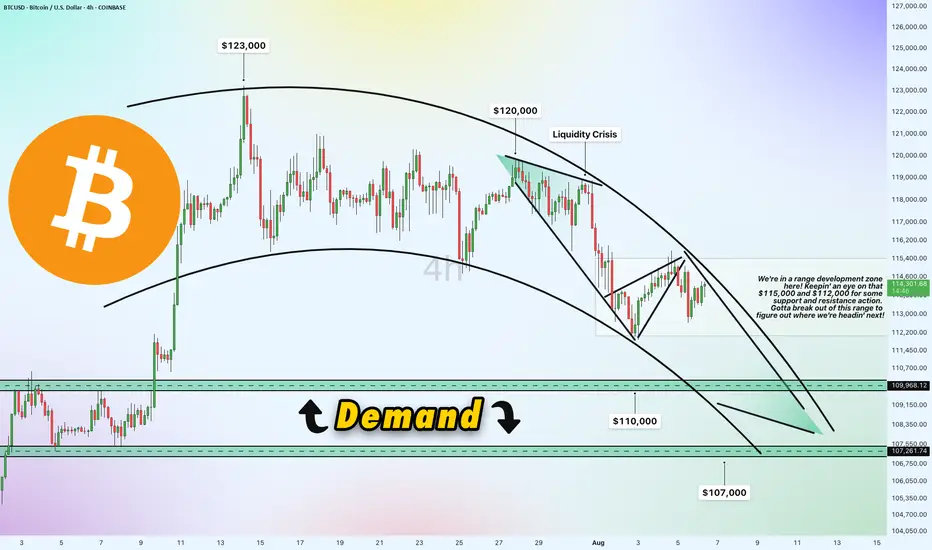
Bitcoin 4h Chart Update [Tight Range / Breakout Opportunities]Breakout Opportunities
We're in a range development zone here! The chart shows Bitcoin (BTC/USD) trading within a tight range, with key levels at $115,000 and $112,000 acting as critical support and resistance zones. The price recently peaked near $123,000 but has since pulled back, forming a liquidity crisis zone around $120,000 where selling pressure kicked in. A breakout above $115,000 could signal a move toward $120,000 or higher, while a drop below $112,000 might push it toward the demand zone. Gotta break out of this range to figure out where we're headin' next!
Demand Zone
$110,000 & $107,000
Price slipped down from $120,000 due to a lack of buying liquidity, potentially it will land into a demand zone between $110,000 and $107,000. This area could act as a strong support level where buyers might step in. If the price holds here, it could bounce back toward the $112,000-$115,000 range. However, a failure to hold this zone might see it test lower support around $107,000 or even $105,000.
Direction and Possible Ranges
Upward Potential: If Bitcoin breaks above $115,000 with strong volume, the next targets could be $120,000 (liquidity crisis zone) and potentially $123,000, aligning with recent highs. A sustained move above $120,000 might open the door to $125,000 or beyond.
Downward Risk: Should the price fail to hold above $112,000 and break below, it could slide into the demand zone ($110,000-$107,000). Further weakness might push it toward $105,000, a psychological and technical support level.
Current Trend: The chart shows a descending trendline from the $123,000 peak, suggesting bearish pressure unless a decisive breakout occurs. The 4-hour timeframe indicates indecision, with the range-bound action hinting at a potential volatile move once direction is confirmed.
Keep an eye on these levels for the next big move!
BITCOIN PREDICTION: THIS Breaks - and BTC WILL CRASH TO HERE!!!!Yello Paradisers! I’m sharing my Bitcoin prediction with you. We’re using technical analysis on TradingView, specifically Elliott Wave theory.
On the ultra-high time frame, we noticed a Shooting star candlestick pattern. We’re analyzing the channel where the zigzag formation is occurring.
We’re also looking at bearish divergence on the ultra-high time frame chart and the zigzag on the high time frame chart. There’s a bullish divergence visible there. The Fibonacci level at $108,000 is also noteworthy, as is the volume, which shows that bears are still in control on the medium timeframe. We’re also analyzing the head and shoulders target plus bearish divergence on the low time frame. On the low time frame, we’re looking at the impulse of the flat C, which is an expanded flat and is currently creating its fourth wave.
Remember, don’t trade without confirmations. Wait for them before creating a trade. Be disciplined, patient, and emotionally controlled. Only trade the highest probability setups with the greatest risk to reward ratio. This will ensure that you become a long-term profitable professional trader.
Don't be a gambler. Don't try to get rich quick. Make sure that your trading is professionally based on proper strategies and trade tactics.

BITCOIN PREDICTION: a SECRET PATTERN is FORMING (watch out)!!!Yello paradisers! In this Bitcoin prediction, I'm updating you about the crash we predicted earlier in previous videos. I'm showing you on a high timeframe chart the ABC corrective mode wave; we are now forming the C wave. The C wave subdivides itself into five smaller waves because it's a motive mode wave. We are taking a look at the volume. We understand that bears are still in power, so we are waiting for some nice volume from bulls. We are spectating a bullish divergence on the MACD indicator. On RSI, there is exaggerated bullish divergence, and in stochastic RSI, we are in an oversold area.
Then, we are shifting our focus to a medium timeframe. We are zooming into the fourth wave, where we are making our sub-waves right now. On the medium timeframe, we are also spectating bearish divergence. We are waiting for the second booby that will basically increase the probabilities of absorption.
As we have seen previously, that helped us to predict that Bitcoin will be crashing. We are also taking a look at our head and shoulders target, which is at $109,000.
Then we are shifting our focus to a lower timeframe, where we are seeing the secret pattern, triple three. Right now, we are creating a sub-wave XX, which is forming itself as a possible zigzag. Paradisers, make sure that you are trading professionally, focus on long-term growth, and avoid get-rich-quick schemes. Any shortage in trading usually ends up sooner or later in bankruptcy.
Remember, don’t trade without confirmations. Wait for them before creating a trade. Be disciplined, patient, and emotionally controlled. Only trade the highest probability setups with the greatest risk to reward ratio. This will ensure that you become a long-term profitable professional trader.
Don't be a gambler. Don't try to get rich quick. Make sure that your trading is professionally based on proper strategies and trade tactics.

Bitcoin Ready for Takeoff - $150K Target Ahead! MARKETSCOM:BITCOIN is showing impressive strength after successfully retesting its May high and bouncing back with conviction. This level, along with the 50 EMA, is currently acting as a strong support zone. Holding above this area signals that buyers are in control, and this zone now serves as a major support for the ongoing bullish trend.
At the moment, CRYPTOCAP:BTC is facing minor resistance in the $115K–$116K range. A decisive breakout above this level is likely to trigger strong momentum, opening the doors for a new all-time high. Once this resistance is cleared, our previous projection of $150K comes into play as the next major target.
For now, it’s crucial for MARKETSCOM:BITCOIN to hold the current support zone to maintain the bullish structure. As always, traders should manage risk effectively and place stop-losses to protect their capital in case of unexpected volatility.
Follow Our Tradingview Account for More Technical Analysis Updates, | Like, Share and Comment Your thoughts

"Bitcoin’s Big Heist – Are You In or Out?"🚨 BTC/USDT HEIST MISSION – SWIPE THE BULL RUN BEFORE THE BEARS WAKE UP 💰💣
🌟Hi! Hola! Ola! Bonjour! Hallo! Marhaba!🌟
Money Makers & Robbers, assemble! 🤑💰✈️💸
Here’s your decoded BTC/USDT “Bitcoin vs Tether” Crypto Market Heist Plan, fully loaded with Thief Trading Style 🔥 TA + FA combo. We’re prepping for a bullish breakout loot – eyes on the vault, ignore the noise.
🎯 PLAN OF ATTACK:
🎯 ENTRY (BUY ZONE):
💥 “The vault’s open—time to sweep!”
DCA/Layer your buy limit orders near the 15–30 min swing lows/highs for sniper pullback entries.
Use multi-entry method to stack positions (layering / DCA) as per your ammo (capital 💵).
🛑 STOP LOSS:
Set SL at the nearest swing low wick (4H TF) — around 115000.00, adjust based on your risk/load.
SL = insurance. Not optional.
🏁 TARGET:
Lock sights on 125000.00
🎉 Or… vanish with profits before the bear cops arrive.
🔎 MARKET BACKDROP & ANALYSIS:
📈 BTC/USDT currently signals bullish vibes on the swing/day horizon — fueled by:
Macro Fuel & Fundamentals
Sentiment Radar
COT Reports
On-Chain Pulse
Intermarket Clues
🚀 Connect the dots. The smart money's already prepping a breakout move.
🧲 Scalpers Note:
Stick to the long side only. No shorting the beast — unless you’re made of diamonds.
Secure your bag with trailing SLs.
⚠️ NEWS TRIGGER ZONE – TRADE WITH TACT:
📢 Upcoming high-volatility news events can spike charts.
Avoid new entries during releases and guard open trades with trailing SLs.
Protect the loot. Always.
💖 SUPPORT THE HEIST GANG: BOOST IT!
Smash that ❤️ to boost our thief squad’s momentum!
Every click powers this underground mission – making money with style, one pip at a time. 🎯💣💵
🚀 See you in the next heist drop.
Until then – Stay stealthy. Stay profitable. Stay legendary. 🐱👤💸🏆

Bitcoin testing 116k zoneIf we are successful in breaking above the 116k zone resistance. Bitcoin will pump hard to 120k and 123k next. As the high time frame trend continues to stay uptrend. Let's see if bitcoin breaks it now or has some other plans.
Stay tuned!

Critical Decision Time For Bitcoin - Trendline Must HoldHere we see BTC testing the trendline support on the 4H time frame, regular scale. The log scale version appears to have already been broken to the downside. The 50 period MA is now coming in as resistance. Bulls need to make a push here, otherwise a 100K retest is likely to happen in August.

BITCOIN BUY SCALPBitcoin will be now head to the up side and correct itself a bit as it’s been selling buy now we can expect a short dip to buy

Bitcoins has slipped back under Long Term resistance. CAUTION
It is VERY clear to see and some just do not want to see it
That Blue Arc, Arrowed, is an Arc that has rejected EVERY ATH since Bitcoin began rising from its early Low.
And also understand, that arc is not just a random line, It is Calculated and is part of a Fibonacci Spiral.
ANYWAY, as we can see on the chart. PA is heading to a Squeeze with this Arc and a rising line of support below.
This line of support has NEVER failed since PA crossed over it.
So we have a n arc of Resistance that has Never been broken.
We have a line of support that has Never been Broken.
One of these two line Has to break.
The Apex of this Squeeze us Dec this year and, as we all know, PA always react before the Apex.
So, How accurate is the placement of this Arc ?
Lets see the Daily chart
Here we can see that PA has for most of this year, been trying to break over and, in July, succeeded, only to fall back below a week ago.
To many extents this played along Very well with the monthly Candle Colour patterns I been posting.
But the fact remains, we are once again BELOW a HUGE powerful line of resistance that we MUST break above and stay above.
We do have many lines of Support below, Local and some, longer term.
We can close on the 4 hour just to see where we are in a more local time frame.
Here, we can see that 105K is a very possible line of support initially that we need to watch and see what happens. Hopefully, we range above this level and let RSI cool off.
The RSI is always a great gauge to watch here and the daily offers some hope of remaining in this current PA range
It must be said that RSI could still drop lower, though we have room to rise before PA becomes OverBought on the Daily.
But the weekly shows us a longer term CAUTION flag.
While we have not been OverBought on the weekly for a long time, we ARE up high, leaving the potential for a Drop.
But with the Daily in good shape, this could be postponed. In this cycle, previous times we got overbought, PA ranged while RSI dropped.
This could repeatover and over........But PA needs to rise OVER that line of resistance and turn it into Support.
This is NOT a choice//it is a MUST HAPPEN if Bitcoin is to continue its rise higher.
The current Price line of this Blue Arc is around 116K.
What we realy need to understand about this Arc is that once we pass December 2025, that arc begins to DROP.
And if PA is below it still, PA will get dragged down with it, into an ever decreasing price model.
So, there we have it
Simple as that.

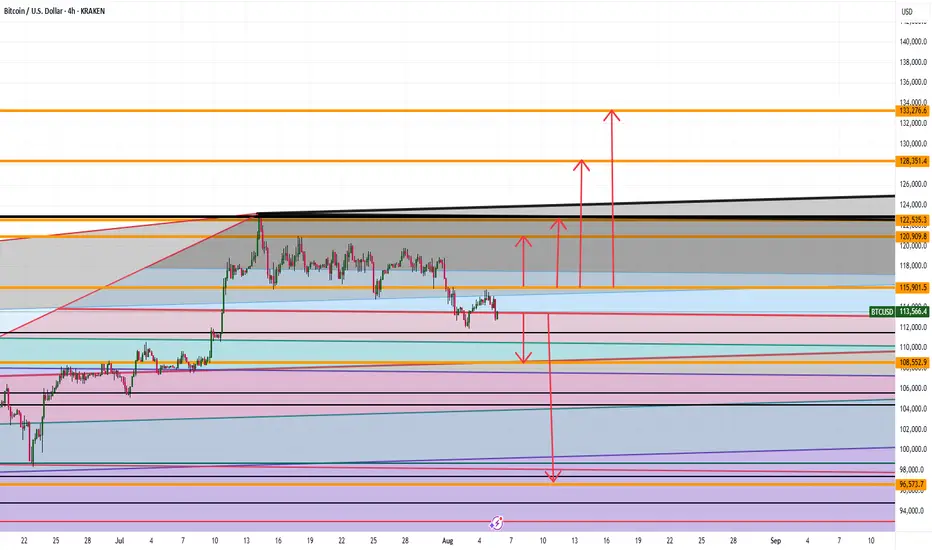
BTC Full Analysis WHERE ARE WE HEADING ???Good afternoon
SO currently with BTC we see the following:
Bullish:
If we can stay and hold above 115,900 then 120K, 122K, 128K and 133K makes sense
BEARISH:
If we close and hold under 113K levels then we can see 108, and 96K levels being hit
What do you think ? Comment Below
Trade Smarter Live Better
Kris
Robert Kiyosaki said WHAT about BTC?According to Cointelegraph Robert Kiyosaki welcomes a BTC dip below $90K... We talked about it before even BTC broke ATH (check related publications), what do you think?
#crypto #cryptomarket #bitcoin #btc #trading #analysis

Bitcoin near to its PeakDon't repeat your past mistakes . May be last 70/100% move pending before big crash .

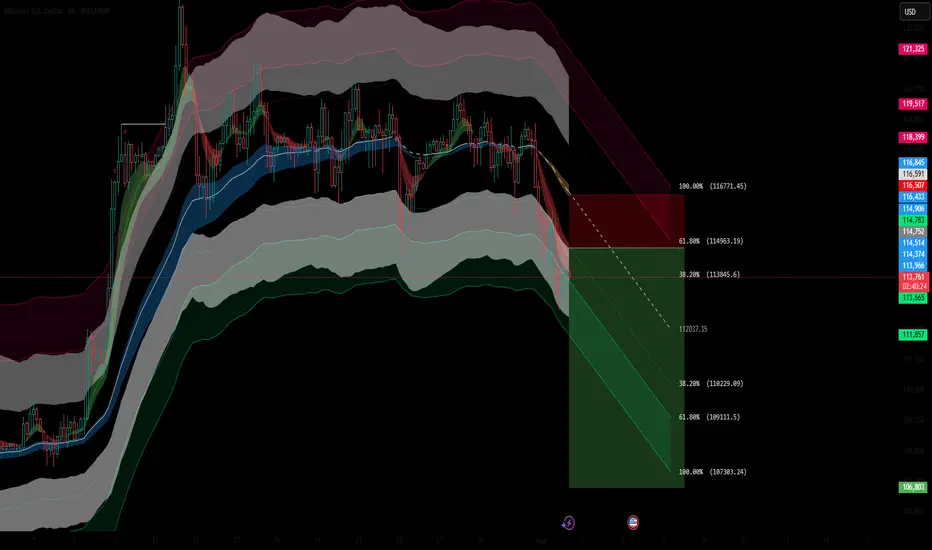
BTCUSD Short Setup – 4H Bitcoin has broken below a key dynamic support zone, and current price action signals a potential continuation to the downside. This short entry is supported by multiple technical confluences:
🔻 Bearish Confluences:
Fibonacci Retracement Rejection: Price rejected the 61.8% Fib retracement zone near $114,978, confirming a potential local top.
Trend Structure: Clear lower high, lower low structure forming on 4H – momentum favors sellers.
EMA Cloud Pressure: Price is decisively below the multi-band EMA cloud, showing sustained bearish pressure and trend bias.
Volume Profile Gap: Price is entering a low-volume node between $113.8k and $112k, increasing likelihood of a sharp move down.
Bearish Candlestick Pattern: A strong bearish engulfing candle formed after the retracement – a classic reversal confirmation.
🎯 Fibonacci-Based Targets:
TP1 – $11205 (38.2%): Initial demand zone and minor support.
TP2 – $11024 (61.8%): Mid-extension level, aligns with prior consolidation.
TP3 – $10731 (100%): Full measured move target if the downtrend accelerates.
SL: Placed just above the recent swing high at $11678, protecting against false breakouts.
Bitcoin - The cycles are playing out!⚔️Bitcoin ( CRYPTO:BTCUSD ) just repeats another cycle:
🔎Analysis summary:
Following all of the previous all time high breakouts, Bitcoin will now further extend the rally. After some simple calculation, we can see that Bitcoin will rally another +50% in order to reach the overall price target. However there will be volatility along the way so make sure to remain calm.
📝Levels to watch:
$200.000
SwingTraderPhil
SwingTrading.Simplified. | Investing.Simplified. | #LONGTERMVISION

BITCOIN CRASH PREDICTED! HERE’S WHAT HAPPENS NEXT! (scary)Yello Paradisers, Bitcoin crashed exactly as we predicted in the previous videos that it will happen with the highest probability.
In this video I am explaining to you what's gonna happen next.
Head and shoulders, neckline, is be breaking to the downside, we need a clear confirmation of a reclaim Our channel on high timeframe is getting breakout to the downside and confirmation was that a reclaim was already successful.
In this video I'm sharing with you Elliott Way theory on low timeframe and what needs to be done for confirmation perspective in order for us to continue to go to the downside or have a reversal to the upside.
Don't be a gambler. Don't try to get rich quick. Make sure that your trading is professionally based on proper strategies and trade tactics.

Bitcoin Traps Bulls and Bears – Real Move Next?Bitcoin is trading in a descending channel on the 4H chart, with two recent fakeouts — one above resistance and one below support — trapping traders on both sides. After reclaiming support, BTC is pushing toward the upper boundary with rising volume, hinting at strong demand. A breakout above $119K could drive a rally toward $125K–$135K.
Cheers
Hexa
BINANCE:BTCUSDT BITSTAMP:BTCUSD

Bitcoin Free Value Gaps UPDATE - near filled next level down
As mentioned previously, these are traditionaly used to find Entries into a market and so far, this has been the case again.
We have dipped to 112K so far and as yu can see, we can go to 103K with ease, should this be allowed by the Bulls.
I will say, the SOPR (Spent Output Profit Loss ) chart has offered a Bull wanting caution flag..
And yet, on the lower time frames, it has just also posted a Good Bull entry point.
This indicates Excellent entry points, Buying opportunities
Yes, PA may drop lower yet, but not massive ones.
It is an excellent example of ow to "Scale in"
Do not use all your money in one trade. Use 20%, wait, see where thelmarket goes. Buy again when ready.
This way, once your lowest Buy price goes into profit, it also starts to cancel out he losses on the other, higher priced Buys....and by the time all your recent buys are in profit, you are exponentially getting better profits.
For me, I am waiting to see if we arrive at the 110K zone before starting this, once the current FVG is filled.
Have a noce sunday

Bitcoin Still has Room to Run - Here's One Reason WhyWhen we zoom out and look at Bitcoin on a logarithmic scale, a clear pattern emerges.
In this chart, I’ve marked each cycle top with a vertical blue line. These peaks are almost perfectly spaced — roughly four years apart, aligning with Bitcoin’s halving cycles. From 2013 to 2017 to 2021, and now projecting into the next expected top near late 2025 or early 2026, this cyclical rhythm has held remarkably steady.
But it’s not just time — it’s structure.
Overlayed on the chart is a standard deviation framework, with the center line acting as a mean reversion anchor. Every major cycle has seen Bitcoin reach the second standard deviation above the mean before topping out.
Where are we now?
Still below the halfway mark.
As of today, Bitcoin hasn’t even reached the +1 standard deviation level. Historically, price accelerates toward the upper bounds of this channel as the cycle matures — and we haven’t seen that blow-off phase yet.
In other words:
Bitcoin still has room to grow.
We’re not late — we’re mid-cycle.
Let the headlines panic. The structure is calm.
And the structure says: higher.

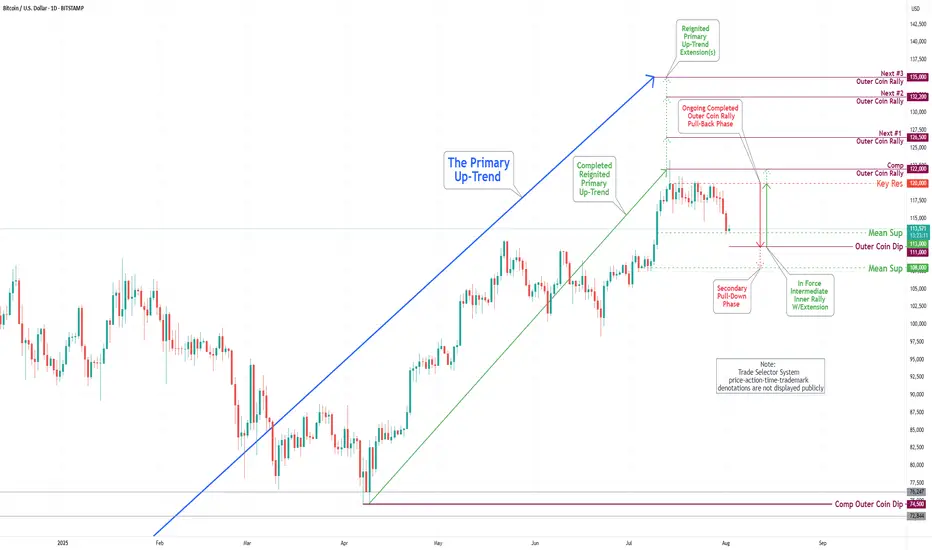
Bitcoin(BTC/USD) Daily Chart Analysis For Week of August 1, 2025Technical Analysis and Outlook:
In this week's trading session, the Bitcoin market experienced a notable pullback. The primary reason for this movement was the Key Resistance level, which led to a decline that reached our Mean Support level of 113000. This anticipated pullback is prompting the completion of the Outer Coin Dip target of 111000, with a strong likelihood of moving towards the Mean Support level of 108000.
Bitcoin Free Value Gaps getting filled - 109 K target >
If you look back at the last time I posted a chart with Free Value Gaps ( FVG ) you will see an orange bar where PA currently sits...The reason it is no longer there is because it ogt "Filled"
It is much the sameidea as CME Gaps. Thay also get filled very often/
So, we can see 2 more FVG before 107K line and so, in the current market state and with the knowledge that in August, Markets often Dip, we may well see PA retreat to the Gap at 109K
What a superb buying oppertunity
End of post as I am enjoying an evening in the south of France, with wine and Fun..
What it stopping you ?

BITCOIN PREDICTION: NOBODY IS WATCHING THIS PATTERN !!!(warning)Yello Paradisers, I'm updating you about the current Bitcoin situation, which is extremely dangerous for crypto noobs that will get rekt again very soon!
It's going to be a big move soon. I'm telling you on a high timeframe chart we are doing multi-time frame analysis and on a high timeframe chart I'm updating you about the RSI indicator, the bearish divergence, the moving average reclaim, and the channel reclaim that we are having right now.
We are observing a shooting star candlestick pattern, which is a reversal sign, and I'm telling you what confirmations I'm waiting for to make sure that I can say with the highest probability that we are going to the downside. On a medium timeframe, I'm showing you two patterns: one is a head and shoulders pattern, then a contracting triangle, and on a low time frame, I'm sharing with you the ending diagonal because on a high time frame chart, we are either creating ABC or impulse, and I'm telling you what the probabilities are for the zigzag, which is a corrective mode wave, or the impulse, which is a motive mode wave.
I'm sharing with you what's going to happen next with the highest probability. Please make sure that you are trading with a proper trading strategy and tactics, and that's the only way you can be long-term profitable.
Don't be a gambler. Don't try to get rich quick. Make sure that your trading is professionally based on proper strategies and trade tactics.
