This 3 Step System Will Show You The Trending StockThis is a powerful chart for you to watch.
Because its following the Rocket booster
strategy.
The Rocket booster Strategy has 3 Steps;
1-The price has to be above the 50 EMA
2-The price has to be above the 200 EMA
3-The price should gap up or trend up.
In order for us to know whether the price
will trend up we are using the ADX indicator.
We make sure that the Blue line
Is rising between the Green line
and the Red line .
This confirms the last step of the rocket booster
strategy.Also remember that the NASDAQ is up-trending.
Rocket boost this content to learn more.
Disclaimer;Trading is risky please use a simulation account
for trading before you trade with real money.
Also learn risk management and profit taking strategies.
Bitcoinprice

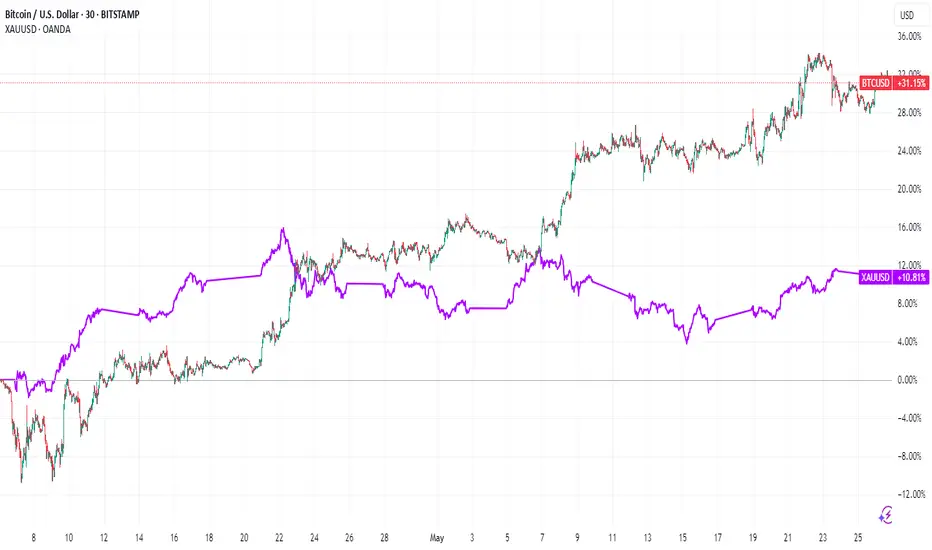
Bitcoin vs. Gold: Central Banks Pick Gold (Here's Why)
The debate over the ultimate store of value has been reignited in the digital age. For centuries, gold, the immutable yellow metal, has been the bedrock of wealth preservation, the trusted haven in times of turmoil, and a core component of central bank reserves. In the last decade, a new contender has emerged: Bitcoin, the pioneering cryptocurrency, often touted as "digital gold." Yet, as the dust settles on initial exuberance and institutional scrutiny intensifies, a clear preference is emerging from the world's most conservative financial institutions. Central banks, the guardians of national wealth and financial stability, are overwhelmingly demonstrating their continued faith in gold, signaling that when it comes to the ultimate safe reserve, tradition and tangibility still trump technological novelty.
The evidence for this preference is not merely anecdotal; it's etched in the consistent and accelerating trend of global gold accumulation by these institutions. In recent years, central banks have been on a gold buying spree, a phenomenon driven by a confluence of potent global factors. The shifting geopolitical landscape, characterized by increased tensions, trade disputes, and a move towards a more multipolar world, has spurred a desire for assets that are not tied to any single nation's political or economic fortunes. Policies emanating from major economic powers, including periods of heightened trade protectionism and shifting global alliances, have historically fanned uncertainty, prompting a flight to assets perceived as universally valuable and politically neutral – a role gold has fulfilled for millennia.
Furthermore, concerns over the long-term value of major fiat currencies, particularly the U.S. dollar which has long dominated global reserves, are playing a significant role. Persistent fiscal deficits, expanding sovereign debt levels, and unprecedented monetary stimulus measures in various countries have led to an undercurrent of apprehension about potential currency devaluation. In such an environment, central banks are actively seeking to diversify their holdings and hedge against the erosion of purchasing power. Gold, with its intrinsic value and finite supply, offers a compelling alternative to holding ever-increasing amounts of fiat currency, whose value can be diluted by policy decisions. This strategic de-dollarization, or at least a diversification away from dollar-centric reserves, sees gold as a primary beneficiary. It is a tangible asset that sits outside the traditional financial system, offering a layer of insulation from the counterparty risks inherent in holding other nations' currencies or debt.
In stark contrast to this institutional embrace of gold stands Bitcoin. While proponents champion its decentralized nature, its mathematically enforced scarcity, and its potential as an inflation hedge, its inherent characteristics currently make it a challenging proposition for central bank reserves. The most glaring issue is its extreme volatility. Bitcoin's price history is a rollercoaster of meteoric rises and precipitous falls. For an individual retail investor, this volatility might be a tolerable, even attractive, risk in pursuit of outsized returns. However, for a central bank, whose primary mandate includes capital preservation and maintaining financial stability, such wild price swings are anathema. Reserve assets must be relatively stable, liquid, and dependable. Bitcoin, in its current state, struggles to meet these criteria consistently. A significant allocation to Bitcoin could expose a nation's reserves to sudden and substantial losses, undermining public trust and potentially destabilizing its financial position.
This volatility poses a tangible risk, not just theoretically, but as observed in the experiences of investors globally, including those in the U.S. While some have reaped fortunes, many others have faced considerable losses due to ill-timed investments or the market's unpredictable nature. Institutional investors, including those in the U.S., while showing increasing interest in Bitcoin as a speculative asset class or a small part of a diversified portfolio, still largely treat it with caution. The kind of deep, unwavering institutional trust that gold commands – built over centuries of proven performance as a store of value and a crisis hedge – has yet to be earned by Bitcoin. Gold’s market is deep, liquid, and well-understood, with established clearing and settlement mechanisms. Bitcoin's market infrastructure, while maturing, is still relatively nascent and fragmented compared to the centuries-old gold market.
Beyond volatility, other factors hinder Bitcoin's adoption as a mainstream reserve asset for central banks. Regulatory uncertainty remains a significant hurdle. The global regulatory landscape for cryptocurrencies is a patchwork of differing approaches, with some nations embracing innovation while others impose strict controls or outright bans. For central banks, which operate within stringent legal and regulatory frameworks, this lack of global consensus and clarity is a major deterrent. The operational risks associated with custody and security of digital assets at a sovereign scale are also non-trivial. While blockchain technology is inherently secure, managing private keys for billions of dollars' worth of Bitcoin requires sophisticated and untested protocols for institutions of this nature.
Furthermore, the narrative of Bitcoin as "digital gold" sometimes overlooks fundamental differences. Gold is a physical commodity with diverse industrial and cultural uses, providing a baseline of demand beyond its monetary role. It is universally recognized and accepted, transcending technological barriers. Bitcoin’s value is derived primarily from its network effects, its code, and investor belief in its future utility and adoption. While powerful, these are different underpinnings than the tangible reality of physical gold bullion held in a central bank's vault.
The actions of central banks speak volumes. While a handful of smaller nations or entities might experiment with Bitcoin, the overwhelming majority of major central banks, those that collectively manage the bulk of global reserves, have either remained silent on Bitcoin or have issued cautious warnings, all while steadily increasing their physical gold holdings. This isn't to say that Bitcoin has no future role or value. It may well continue to evolve as a speculative asset, a niche store of value for some, or a technology platform for new financial applications. However, the idea that it is poised to usurp gold's position in the vaults of central banks appears premature, if not fundamentally misguided, given its current attributes.
In conclusion, the debate between Bitcoin and gold as the preferred store of value and reserve asset has a clear, if perhaps unexciting, winner in the eyes of the world's central banks. Faced with geopolitical instability, the specter of dollar devaluation, and the enduring need for reliable safe-haven assets, these institutions are doubling down on gold. Its long history, proven stability, tangibility, and lack of counterparty risk resonate deeply with their conservative mandates. Bitcoin's volatility, regulatory ambiguity, and operational complexities, while potentially surmountable in the distant future, currently render it unsuitable for the core reserve holdings of nations. While U.S. investors and others may grapple with Bitcoin's risk-reward profile, central banks have largely made their choice, and that choice, for now and the foreseeable future, remains firmly with the ancient, trusted allure of gold.
Short term BITCOIN 4 hour Chart and possible moves
As I rite this, we see PA pushing up under a line of local resistance, and being rejected.
Support is not far below on the old ATH line ( blue Dash) and below that we have the rising trned line at around 107K
So we have support all around but we are heading in to the unknown with this Fib circle that is just ahead of us.
As yet, I do not know what to expect.
Previous 618 Fib circles have rejected PA to some degree and so I will expect at least a dip in Price.
But as the MACD is nicely cooled off and rising Bullish just above Neutral, we certainly have the ability to piush through
So, We enter the unknown today but with Bullish intent and the ability to cope but we do need Caution.

BITCOIN new week open Green - Will we get 8 weeks Green in a row
These are all WEEKLY chart
7 weeks in a row closed Green.
At Time of writing, Bitcoin is around 109800 usd
So Very Bullish and every possibility that this week will also close Green though we are getting near a point of resistance.
If we zoom into the same chart, we can see more detail
We are above the 2.618 Fib extension and we could return to the 103K zone to test this as support. We may need to do this as it has only ever been resistance previously.
We are also very close to a 618 Fib circle.( Blue )
We do not know if this is an area of strong resistance yet but PA is now in the area that we may react to it.
As a result of this Fib circle, we need to be prepared for the possibility of reentering that rising channel,
We may not do that ,The reasons being that PA still has enough strength.
The MACD - or Moving Average Convergence Divergence, is a technical analysis tool used in trading to identify momentum and trend direction.
The 2 vertical lines on the left are the 2021 ATH points, to give a comparison.
In this cycle we have had 2 previous peaks and then the cooling off period from OverBought.
The Cooling off were the periods were BTC PA ranged..
We are currently rising Bullish, with room to move higher but we should be aware that we are in the area that rejected the 2nd ATH in 2021. The daily is in a very similar position but getting choppy.
The RSI - Relative Strength Index, a technical indicator used to understand the momentum of a price trend . The RSI helps signal when to buy and sell in a trending market by identifying overbought or oversold conditions in a security.
Again, the Vertical lines on the left show you the 2021 ATH points as reference.
See how RSI peaks before BTC PA Peaks.
We have not been fully OverBought since March 2024. RSI is rising Bullish with Room to move higher, though, again, note how it is in an area were rejection has occurred previously.
The Mayer Multiple is a ratio used in trading that compares the current market price of an asset, such as Bitcoin, to its 200-day moving average (SMA) price.
This indicator is particularly useful for swing traders to find zones of extreme overbuys and
It is generally considered a bullish indicator when the price is above the long-term moving average ( Yellow ) and bearish when the price is below it, although significant deviations from the moving average can indicate overvaluation or undervaluation.
Again, take note of the vertical lines and were this Mayer Multiple was.
Again, the tendency is that when this Drops, BTC PA has Ranged to cool off and when it crosses above its Average, it leads to a High on the push higher.
And once again, remembering what has been said above, we need to wait to see if this crosses its average or get rejected by it.
But as you can see, the Average is more often used as support amd mpt resistance.
So, in conclusion, I remain Bullish but with a note of Caution till we get a push higher conformed.
We could see a pull back and , if that happens, this maybe the last sensible buying Zone for Bitcoin this time round. The Risk is increasing as more and more coins enter into good profit margins. People may get tempted to sell.
On a longer term , this month has confirmed a very bullish intent and we have one week to go before month end. I will expand on this on 2nd June
This week. we wait and see how Bitcoin will react.
Be Kind to others. The world Needs LOVE

BTC- New Impulse Soon You Can See read captionbitcoin (BTC) – Bullish Outlook
Price action breaking above key resistance, signaling potential trend continuation
Strong volume supports the move, confirming buyer strength
Higher highs and higher lows forming—classic bullish market structure
RSI and MACD both showing bullish divergence
Next target zone: TSXV:XX ,XXX – watch for consolidation or breakout
Overall sentiment shifting positive with macro tailwinds

₿ Bitcoin Weekly Chart – Is Wave 5 Now in Motion?Bitcoin has found strong support and looks to be powering higher again. Based on Elliott Wave structure, we may now be entering the final leg of this major impulsive wave sequence—Wave 5.
✅ Support Held at a Classic Level
Wave 4 recently pulled back to the 38.2% Fibonacci retracement level of Wave 3—an area that often serves as key support in bullish Elliott Wave trends.
This bounce suggests buying interest remains strong at this level.
📈 Next Target: Wave 5 Projection
If the current structure holds, Wave 5 could aim for the 61.8% Fibonacci extension of Wave 1 + Wave 3, which points to a potential target around $132,669.
This level lines up with the upper boundary of the ascending channel, offering a confluence of resistance.
⚠️ One Caution: The Wave 3 Structure
While the count remains valid, Wave 3 lacks ideal symmetry, and may not exhibit the “right look” that Elliott Wave theory often prefers.
This introduces a slightly lower confidence level, but not enough to invalidate the primary bullish scenario.
🧠 For Beginners:
Elliott Waves are patterns of market behavior. A full trend typically moves in five waves, with Wave 5 often being the final push before a larger correction. Fibonacci levels help us project where waves may end based on the size of prior moves.
📌 Summary:
Wave 4 found strong support at 38.2%.
Wave 5 may now be in progress, targeting $132,669.
Keep an eye on price action near the top of the channel to gauge momentum and potential exhaustion.
If Bitcoin can maintain its trajectory, we may soon test the highs projected by this wave count.

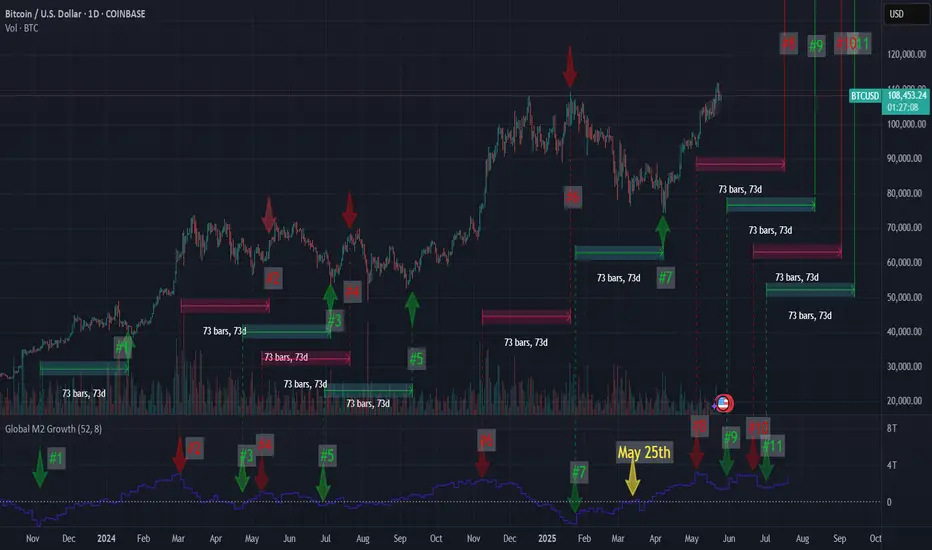
73 days looks to be spot on73 Day Lag to the Global M2 Money Supply looks to be spot on for the last year. If it is, this is good news with the M2 still climbing.
If I am right, we will have a dip within 24 hours of May 28th, only to get another pump to the upside withing 24 hours of June 2nd.
(I tried inputting all this data to Grok in order for him to give me some price targets. They were close to where I think the price will be but using the M2 for price targets still needs some work.)
Bitcoin Weekly SetupShitty market gives shitty options.
Could be a Sweep, a fake Sweep, a similar triple top, an overextended weekly move which needs to cool down a bit.
Funding rates are slowing down/neutral.
Open Interest pretty neutral.
A word from Trump/Powell can save or kill the whole story.

Quick BITCOIN Fractal update, Not on Fractal but still good
BITCOIN still in that target circle, first posted in Feb 2025, and I expect to remain here till early June.
This daily chart shows us where exactly we sit in the circle.
There are a number of reasons why we may remain here a little longer but one thing to always look at is the MACD.
The Weekly is still rising Bullish with room to move higher
The Daily is choppy and currently just fallen below its Signal line
We need to watch this area as between the MACD and its Histogram, we could see a Strong Bearish Divergence
The shorter term 4 hour shows how support in approaching
The habit has been for MACD to bounce off Neutral line but if we look at that Histogram, we can see the volatility there and so this could point to a weaker reaction in the near future.
In conclusion, the potential for a drop lower exists but the lower time frame MACD can also show us that some support is available maybe
Lines of support for BTC PA suggest a Low of around 105K should curent support fail.
Bitcoin Dominance (BTC.D) is currently rising again while the others are dropping.
If BTC PA Drops while this is rising, ALTS will Bleed heavy
Continued Range is the likely option till we reach June and then, Mid June, 18th, we have the FED Rate decision.
This could trigger renewed reaction.
We have reentered a zone of upmost CAUTION till we get some stronger momentum signals

BTC USD Price Action End of May 2025Sunday 25th May 2025
Well what a month for BTC.
Dominance has remained strong remaining above 64% month to date.
The DXY has been losing strength which has been helping BTC's case.
Record BTC ETF inflows going into BTC recently.
Trump making deals in the Middle East.
BTC is still in s trong stance and it is looking like it is coiling up for the top. Whether that is a grind up through the Northern Summer, or a choppy North Summer and then spike up into September October and a double top forming before the decline into the bear, who knows.
But overall it is bullish.
It is risk on, as Gold also cools off with sideways action, not so much a major pull back as yet.
US Stocks are looking strong also in a bullish stance on the indices.
Strictly with BTC we have officially hit a new All Time High of $111,965 with some exchanges breaking the $112k USD mark.
Will all this bullish action, we are looking for a pull back of some sort. A cool off soon would be very healthy for the market.
The cycle timing is indicating a 60 day low occuring in or around Friday 6th June 2025, plus or minus few days.
We could see a shallow dip to the low $100k's / high $90k's.
We have FOMO level of $98,501 at the 50% Fib.
OTE long zone sweet spot between $95,370 (61.8%) and $90,913 (78.6%).
And the back the truck up level at $88,367 (88.2%).
The bodies of the yellow candles are price zones may need to be filled, so would make good retracement entry points.
Also to support the pullback / cool off, VZO/PZO is in overbought territory.
Bear divergences in the double ribbon, Fisher, Squeeze Momentum and Commodity Channel Index.
The Bollinger Bands are Squeezing which is a sign of coming volatility or consolidation (not shown).
We are on a TD7, so two more days to perfect the TD9 count and another possible 1 to 4 days of upside, so we could still see positive price action up until Saturday 31st May to close out the month.
The a dip and grind up the the next 60 day cycle top which may occur in or around the 21st July give or take a few.
In the news, ETF's see 4.5 x growth as there has been $2.75 Billion USD in inflows in the past week.
Let's see how the week and month closes out for a better picture.
Happy Trading Crypto Pirates.
Peace out.
F.Govt. F.Police.
Snake Plissken signing out.

BTC Futures : My first attempt with a target price of 0Hello friends; I think not believing in Bitcoin is as natural as believing in Bitcoin.
I can't express my opinion here with moving averages and/or RSI levels.
The Beyond Technical Analysis might make sense for this trade.
If we are wrong, what is important here is our position and risk management. We do not open a transaction to say "I told you so".
I cannot explain this with any technical analysis method, blockchain data, etc.
Technically; everything that will be built based on this is the same as building a sand castle.
I don't think Bitcoin has an equivalent.
If we consider serious inflation rates, it is obvious that people will have much bigger and more vital priorities than buying Bitcoin or other cryptocurrencies. I am not even talking about electricity costs.
I definitely don't think it can be in the same class as Gold.
This trade alone offers us a very good risk/reward ratio.
I chose the contract covering the next period ending on May 30th, not the continuous CME contract, in order to save time.
A good place for a first try.
I will definitely try something similar.
I don't think I will have any views other than the short side in the future.
For years I have been asked, "If you don't believe us, why don't you open a short position?" I will try to achieve this.
So there's also an experimental side to this.
HIGHLIGHTS
We are closing our position before the contract switch date of May 30, 2025, without looking at the price. If necessary, we will try again in the next contract.
The value of 113690 is our stop value. We end our trade at this value.
We choose the smallest value as the position size.
If you expect something to be 0,
you should choose trading instruments that evaluate your position in currencies rather than in BTC value.
I chose CME because it is suitable for this.
Contracts that are further away are definitely not liquid.
It may be difficult to find buyers even at high values.
Target : 0
Absolutely no margin addition.
Best regards.

BItcoin; Heikin Ashi Trade IdeaCOINBASE:BTCUSD
Picture tells more than 1000 words!
Thank you for checking out!

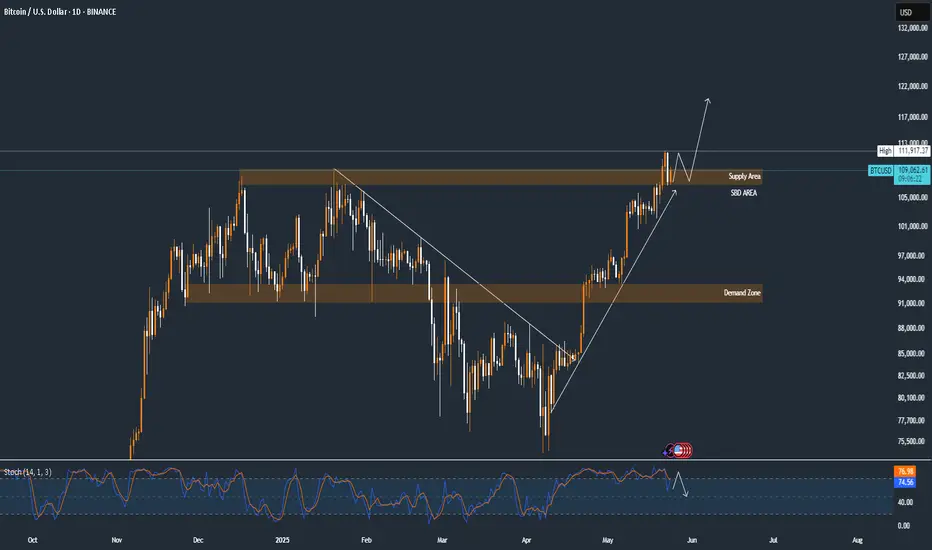
BTCUSD RETEST? CONTINUE BULLISH?BINANCE:BTCUSD Hello Traders, BTCUSD 1D 24/05/2025
Bitcoin has already completed a clean retest of the breakout structure, yet Stochastic remains in the overbought zone (above 75), signaling a potential short-term correction.
Key Observations:
- Price may push further toward the 111,917 resistance zone
- Due to overbought momentum, there’s a possibility for a bounce back toward the SBD (Supply
Become Demand) zone before any continuation
- As long as market sentiment remains bullish, we may see a breakout above 111,917 after the correction
Key Zones:
- Resistance: 111,917
- Demand/SBD Area: Around 102,000
- Major Demand: Below 94,000
Short-term caution ⚠️, long-term structure possible continue bullish 📈
Bitcoin(BTC/USD) Daily Chart Analysis For Week of May 23, 2025Technical Analysis and Outlook:
In the course of this week's trading session, Bitcoin demonstrated significant upward movement, surpassing both Mean Resistance at 105000 and Key Resistance at 106100. This progression also facilitated the surpassing completed Inner Coin Rally at 108,000, and the highly anticipated Outer Coin Rally marked at 110000. As a result, the cryptocurrency experienced a substantial decline, currently aiming toward Mean Support at 105600, with a potential further decline toward an additional Mean Support target at 101500.
It is essential to acknowledge the possibility of an upward momentum emerging from the current level, which may enable a challenge to Key Resistance at 111700. Success in this regard could result in reaching the Inner Coin Rally at $114500 and, subsequently, the Outer Coin Rally at 122000.

Bitcoin - Correction Is Finally Happening!Hello, Skyrexians!
Let's continue trying to guess when BINANCE:BTCUSDT will have a correction. This time it's very likely, but I am not recommend to short this correction because this is the trade against the major trend.
Let's take a look ate 12 hours time frame. Wave 3 is likely to be finished with internal double divergence on Awesome Oscillator. Now it's finally time for the wave 4. 0.38 Fibonacci is the most likely target at $101k. After that wave 5 is expected and it's going to be only higher degree wave 1.
Best regards,
Ivan Skyrexio
___________________________________________________________
Please, boost this article and subscribe our page if you like analysis!

RIP Bitcoin Sell to 45K ?Bitcoin broke the weekly channel last week. I expect a decline to 45K
Stop loss: 97600

BITCOIN, something for the weekend sir ? - Don't expect to much
A qiuck return to the chart I been using most often
Bitcoin 4 hour
MACD turned BEarish
This is likely to drop to neutral at least before turning bullish again
The Daily MACD is still rising Bullish but turning down towards the Red signal line.
Push hhigher For Bitcoin price unliekly this weekend but possible...
As you can see, BTC PA has found support on a olcal rising line and is near the old ATH line.
That old ATH line needs to be reclaimed
Ultimately, PA could drop back to lower trend line around 105K but the Bulls have snapped PA back up from the recent dip, as seen on the long lower wick on the current candle.
Realisticaly, we have not even begun a push higher just yet, not until we get through that Fib circle above AND cool off the indicators I mentioned in the post earlier today
But this does show intent.......
Do Not Panic if the Price drops further, to many extents, it needs to and depending on the Bitcoin Dominance chart, this could lead to further gains in the ALT market.
ENJOY

BTC middle term Structural analysis, as I see it, we may have a brief pull back to the 86-79K area before resuming the bullish trend. I see very small risks to go back to the 73K area, of course, it is always a possibility. Everything depends on the FED's monetary policy.
DISCLAIMER.
Trade with caution. Make your own research and plan. I own several cryptocurrencies, including bitcoin. This is not a financial advice, it represents merely an opinion only.
Good luck!

BITCOIN 5 lines and 3 indicators to watch now we in new ground
I will be presenting a number of charts here and each has a different story to tell right now.
The 5 lines are All valid trend lines.
The Vertical lines are January year markers
The white line at the bottom is th e long term support line from 2013
The Dotted line is a threshold line
The Blue Arc is a line that has rejected EVERY ATH since 2013
The orange line is a marker that, once crossed has Always led to a New cycle ATH
The upper dashed line is the line of rejection of all ATH since 2017
The Weekly Bitcoin PA chart
Here we can clearly see how that Blue Arc has rejected PA previously. We can see how PA has reached a point of intersection and once it crosses that blue Arc, there is a line of rejection just above.
This Blue line needs to be crossed and held as support.
The Daily version of this chart shows ua how we have just crossed that blue Arc.
It also shows us how FRAGILE this is right now. PA is currently testing that Blue line as support
This needs to Hold. If we manage to hold this line and bounce, Stiff resistance is found around 120K
The following charts are showing the following indicators
The 3 indicators used are
RSI - Relative Strength Index. used to measure the speed and change of price movements
TSI - True Strength Index, used to indicate trend direction and overbought/oversold conditions.
ADX - The Average Directional Index (ADX) is used to measure the strength of a trend, not its direction
The 4 hour chart - short term expectations for the weekend
Bitcoin PA the Yellow line at the Top, the indicators are in the order listed above,
First thing to see here is how BTC PA is retesting that Blue Arc - this really needs to hold
RSI (blue) - OVER BOUGHT, It has fallen below its own MA ( average) and could easily drop further today. Looking back along this, we can see how the 4 hour RSI likes to range along the Neutral line, so we may see it drop back to that level today, tomorrow
TSI is also OVER BOUGHT. We can see when TSI is up here, PA ranges while it cools off. But there is room for one little push here if required
ADX ( yellow ) is high showing trend could be getting near exhausted, The orange line is the DI+. This shows positive prince direction, the Red one is DI- and shows that negative price direction is climbing slightly.
In the short term, we need to see PA hold above the Blue line but the likelihood is to possibly back below. There is support below.
The WEEKLY shows us that PA has the ability to continue for a while longer but we are getting near a point where PA needs to recover
Here we can see how the RSI and TSI are both up high, on the edge of OVER BOUGHT but with the ability to rise further.
What is VERY important to take note of here is that ADX.
It is Low, this is indicating that the weekly Trend has lost strength now. It could continue lower.
Remember, ADX DOES NOT SHOW TREND DIRECTION, JUST STRENGTH
So, the thing to see here is that we are in an area where we could see a New Trend begin. This trend could be either Bullish or bearish
On a weekly chart, this change can take a long time to appear in PA
And for the Longer Term, The Monthly Chart gives us hope for a fuhrer push higher for the rest of the year but one little warning bell
WE See Both RSI and TSI up high again, where they have been since 2024. But neither of them are up in OVER BOUGHT as much as they have been in previous cucle Tops.... So we can assume room to move higher.
But what does ring a bell is that ADX again. It is once again, in a place of Change and on this chart, showing that the current trend can start becoming weaker. However, DI+ has plenty of room to move higher
So, in conclusion, we see that BITCOIN has the ability to continue higher but in the short term, we may see a pause and possinle Volatility
Trends are about to change, This could take Weeks and PA can continue higher while a trend weakens.
For me. we are in the last few months of this cycle and at a point of Decision.
PA MUST get over that Blue Arc that has rejected Every ATH since 2013.
If PA fails this, we go back to sub 90K but this is unlikely,
There are numerous projections that see BTC PA in price discovery reaching the 120K before serious resistance.
On this chart, if PA follows pattern and trends, we could see 378K by year end
Getting over that irange line is KEY
Stay safe everyone.

Bitcoin Remains Bulish once again, almostinner cycle 5 waeces impulse looks completed , but bigger cycle not just yet,
Sell from current levels to 103.000
Buy from 103.000 Targetting 117.000 / 123.000
GG

Altcoin Season Brewing?Hi,
The OTHERS/BTC pair represents the collective market capitalization of altcoins relative to Bitcoin. This ratio is a critical indicator of altcoin strength or weakness against Bitcoin. The weekly chart reveals a prolonged bearish phase for altcoins, with Bitcoin dominance persisting. However, recent data suggests potential inflection points worth monitoring.
Key Technical Elements:
- Ascending Channel: The pair is moving within a well-defined macro upward channel. It is currently sitting at the bottom boundary, suggesting a potential reversal point.
- Support Zone: The lower boundary of the channel (purple line) aligns with previous bounce points (2019, 2020, mid-2023), reinforcing its validity.
- RSI Indicator: The RSI has shown bullish divergence with price making lower lows while RSI forms higher lows.
My Opinion:
This chart suggests we are near the bottom for altcoins vs BTC, and the risk/reward is heavily tilted in favor of a bounce, especially going into a potential Q3-Q4 altseason. It’s a classic accumulation zone where smart money tends to position.
And what to do?
- scale into altcoin positions cautiously.
- Use the channel low as a stop-loss zone.
- Look for confirmation over the next 1–2 weeks with bullish candles or increased volume.
Happy Trading,

BTCUSD update May 22nd, 2025I have returned and here is my updated chart. I'm such a perfectionist sometimes when it comes to lines that it takes my hours to get them exactly how I envision. To start off, yes I am bullish on Bitcoin and believe that this cycle hasn't ended yet but I will admit that I think the end of it is closer than the beginning. With that being said, I will not disappear when the bear market starts, I will simply make updates and try to catch the bottom like I did in the past. So far I am going with history and my bottom target is above 66,800 and I expect the floor to fizzle out around 71-73k; if it ends up being higher than that, great! Overall this idea is just an update for my own personal records and my prediction is based on what has happen that last time this pattern was brought to us.
Stay safe out there, happy trading, and as always--Cheers!

EUR USD Entry Setup 1 hour timeframe EUR USD Entry Setup 1 hour timeframe
Trade Setup: Bullish break and retest
Additional Confluence: Fib Retracement Level👌🏻⬆️
