₿itcoin: Pushing Higher—But Watch for a Reversal AheadAfter taking a brief pause over the weekend, Bitcoin resumed its upward momentum early this morning, trading within the blue Target Zone between $117,553 and $130,891. This marks the first time the cryptocurrency giant has traded above the key $120,000 level. Within this zone, and in line with our primary scenario, we continue to anticipate the peak of the corrective wave B rally, followed by a trend reversal to the downside. We expect a significant wave C decline, targeting the lower blue zone between $62,395 and $51,323. As such, prices in the upper blue Target Zone may present an opportunity to take (partial) profits on existing long positions and, where appropriate, to initiate potential short positions as a hedge. These shorts could be protected with a stop 1% above the upper boundary of the zone, given there remains a 35% probability that Bitcoin could break directly above the $130,891 resistance and set a new high as blue wave alt.(i).
📈 Over 190 precise analyses, clear entry points, and defined Target Zones - that's what we do.
Bitcoinprice

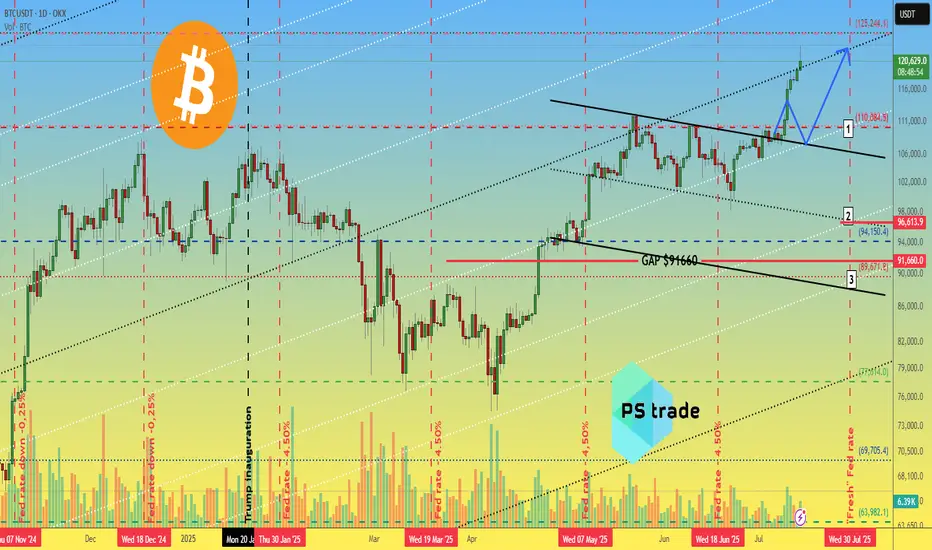
Bitcoin BTC price analysis📈 Two weeks have passed since the previous analysis of the OKX:BTCUSDT chart, and the market has decided to go with the 1️⃣ scenario.
Less than 3% remains to reach $125,000, and the price could easily get there by inertia, but that's a minor detail.
CRYPTOCAP:BTC is updating its ATH, and total liquidations on the crypto market over the past 24 hours are “only” $750 million, of which almost $450 million is accounted for by #Bitcoin.
Weak, very weak... Previously, longs were liquidated for $2+ billion, and it was reported that the actual amount of liquidations was significantly higher due to the fact that the exchanges' data was not fully disclosed. (For the sake of objectivity, at that time, the lion's share of liquidations was accounted for by altcoins, but now this is not the case).
◆ During this time, Trump introduced new tariffs — the market was “on a roll” — it swallowed it and didn't even notice the news.
◆ Tomorrow, July 15, the US CPI will be announced — the forecast is for inflation to rise from 2.4% to 2.6% (although there are rumors that the situation in the US economy is much worse and this may "come to light" tomorrow).
◆ July 16 - PII announcement - these indicators may act as a “cold shower” to bring the market out of its euphoria.
◆ From July 14 to July 18, the US Congress is considering three key crypto laws, including the GENIUS Act. Major players consider this a powerful driver. Perhaps the current growth has already “played out” and priced in expectations for news.
🪐 And this trading week will end on 18.07 with the start of Mercury retrograde, even the US Congress is postponing all important matters, and you still don't believe in it ))
🖐 Long positions are certainly beneficial, appropriate, and in line with the trend at present, but it is advisable to hedge them with stops, because as mentioned above: the price is rising, and there are few liquidations. During the previous decline in the cryptocurrency market, there were significantly more liquidations of long positions, and they may wish to repeat this.
And with the #BTCUSD price correction, there will be a fixation: some will have profits, and some will have losses in stablecoins, which would then be logical to reinvest as capital in altcoins. First in something more voluminous and less risky, and in the last stage, they will pump everything in a row)
But until then, we still need to survive and preserve our deposits.
So, in your opinion: correction to one of the levels:
1️⃣-$110k 2️⃣-$97k 3️⃣-$90k
or
is everything written above complete nonsense, and the market growth has only just begun to “take off”?
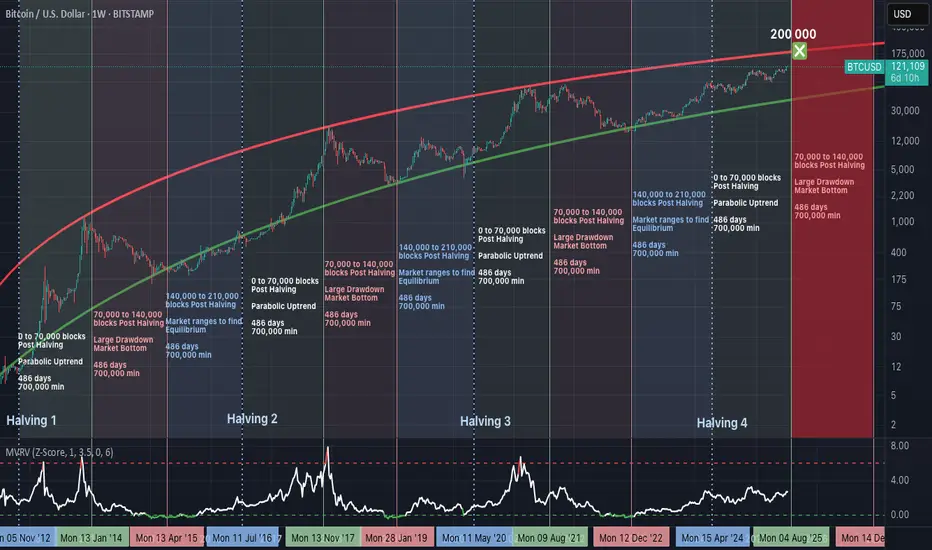
Bitcoin’s 486-Day Halving Blueprint: The $200,000 Blowoff?Summary
Bitcoin’s price consistently follows a 3-phase structure after each halving, with ~486 days per phase. If history repeats, we are nearing the end of the parabolic phase, with a potential peak around $200,000, before entering a structured drawdown.
Halving Cycles: The Real Clock Behind Bitcoin
Bitcoin’s monetary policy is pre-programmed.
A halving occurs approximately every 210,000 blocks (~4 years), and market behaviour after each halving follows this repeating pattern:
Phase 1: Parabolic Rally (0 to 70,000 blocks post-halving).
Phase 2: Major Drawdown (70,000 to 140,000 blocks).
Phase 3: Equilibrium Phase (140,000 to 210,000 blocks).
Each phase lasts approximately 486 days, and this structure has repeated reliably since 2012.
Phase 1: The Parabolic Rally (Current Phase)
We are currently in the growth segment of the cycle:
Price rising rapidly.
Miner profitability at highs.
Hashrate and network security increasing.
MVRV Z-Score steadily climbing, but not yet overextended.
Roughly 700,000 BTC are mined during this period, creating a supply shock as issuance is halved while demand accelerates.
Phase 2: The Drawdown (Expected Next)
Historically begins between block 70,000 to 140,000 post-halving.
Market peaks and begins to correct.
Miner margins compress.
Hashrate may plateau or decline.
Forced selling and miner capitulation drive volatility.
Price retraces significantly from the peak.
This phase resets the market and eliminates unsustainable excess.
Phase 3: The Equilibrium Phase
Occurs between block 140,000 to 210,000 post-halving.
Price enters consolidation.
Realized value and market price converge.
Ideal accumulation period for long-term investors.
Network fundamentals stabilize ahead of the next halving.
This phase is critical in building the base for the next cycle.
MVRV Z-Score: Market Thermometer
The chart includes the MVRV Z-Score, a key metric showing how far price deviates from realized value:
Readings above 6.0 have consistently marked cycle tops.
Readings near or below 0 have marked major bottoms.
Current value is around 2.67 — indicating a rising trend, but not overheated.
This metric reflects market-wide profitability and speculative pressure.
Why $200,000 Is in Sight
The projected resistance curve on the chart suggests that:
$200,000 aligns with the top of the long-term parabolic channel.
It corresponds with the expected end of the parabolic phase (Q1–Q2 2026).
It fits prior extension patterns following each halving.
It is a strong psychological target, likely to trigger heavy profit-taking.
This price level is not arbitrary—it is derived from the same structure that defined previous peaks.
What Comes After
If the historical cycle structure remains intact:
The peak should occur before mid-2026.
A deep correction phase follows, likely into 2027.
True bottoms tend to occur as miner capitulation concludes and difficulty adjusts downward.
This is where conviction and preparation matter most.
Final Thoughts
Bitcoin cycles are not random. They are structured around block height, issuance, and miner economics.
Every cycle since 2012 has followed this 486-day framework, divided across parabola, crash, and reset. This model has outperformed calendar-based predictions and technical narratives.
Disclaimer
This content is for educational and informational purposes only and does not constitute financial, investment, or trading advice. Past performance is not indicative of future results. Always do your own research and consult with a qualified financial advisor before making investment decisions. The author holds no responsibility for any losses incurred as a result of using the information presented herein.
Bitcoin Fractal, increase to $116k Hi Everyone☕👋
BINANCE:BTCUSDT
Been such a long time since I posted. Today I'm looking at BTCUSDT, and I'm looking at the previous all time high cycle and what we were seeing (the pattern aka fractal).
Here's why we're likely going a little higher.
First correction of -32%
Followed by first peak, ATH
Correction, then the second peak and the REAL ath. Which is where we likely are:
Interesting to note that the previous time, the second ath was NOT THAT MUCH HIGHER. This should be considered to manage expectations in terms of how high we can go. Anything above +6% is a bonus.

BITCOIN BREAKS YEARS LONG ASCENDING TRENDLINE RESISTANCEThe recent surge in the price of Bitcoin has led to the break of years long ascending trendline resistance as can be seen on Weekly BTC chart.
The price of BTC can soar higher above this resistance level and can take support from this level to mark a successful breakout.
Breakouts like this does create FOMO among traders but trading such breakouts must be done with caution as the price can still fall under the resistance level.
Best of Luck!!

#BTC/USDT It's not over yet! Eying at 130K +ALTCOIN CHEAT SHEET!The last time I shared this chart was on April 14th, when Bitcoin was trading around $84,000 — right when panic was setting in across the market.
The message back then was simple: don’t panic, it’s just a retest.
And here we are again, revisiting the same sentiment with a new chart!
There are a lot of “double top” charts circulating in the space right now, but let me be clear: it’s not over yet.
Before jumping to conclusions, go through this chart and analysis to understand the full picture.
Bitcoin closed the week at $105,705 — certainly higher than most expected just a few days ago.
This marks the first red weekly candle after seven consecutive green closes, which is normal in the context of a healthy uptrend. We're still midway toward the broader target, so there’s no reason to panic or shift into disbelief.
Yes, we may see further corrections in BTC over the coming days or week, potentially down to $98K, and in a less likely scenario, even $ 92K. But this time, Ethereum is showing signs of strength and is likely to outperform Bitcoin, creating high-quality entry opportunities across the altcoin market. In other words, this phase is not a threat, it's an opportunity. BTC is still destined to hit $130k+ as per charts and other important metrics.
Here’s a typical market structure and reaction flow to help put things in perspective:
1. Bitcoin rallies — Altcoins underperform or get suppressed due to capital rotation into BTC.
2. Bitcoin corrects — Altcoins correct further as fear increases and dominance rises.
3. Bitcoin stabilises — Ethereum begins to gain strength, often leading the altcoin recovery.
4. ETH/BTC ratio increases — Ethereum holds up better while many altcoins continue to lag.
5. Bitcoin breaks ATH — This triggers a gradual recovery in altcoins.
6. BTC dominance peaks — Altcoins start gaining serious momentum.
7. Capital rotates from BTC and ETH into altcoins — Sectors tied to the current narrative (like meme coins this cycle, and Metaverse/NFTs in the last one) begin to lead.
8. Altcoin season begins — Utility and mid-cap tokens follow, often delivering strong returns in the final phase.
This pattern has repeated across cycles. Currently, we appear to be in the transition between Bitcoin stabilising and Ethereum gaining dominance — typically the stage that precedes a strong altcoin rally.
Now is not the time to assume the move is over. Stay objective, monitor capital rotation closely, and prepare for what comes next.
If your views resonate with mine, or if this post adds any value to you, please boost with a like and share your views in the comments.
Thank you
#PEACE

BTC Bullish Setup: Two Long Positions Aligned for ContinuationHello guys!
Bitcoin is currently in a strong uptrend, consolidating after a sharp move up. The chart highlights a textbook bullish continuation pattern (pennant/triangle), suggesting momentum is building for another leg up.
Attention:
This is not an either-or setups. Both long entries are valid and could trigger one after the other, offering layered opportunities for bulls.
1- First Long: Breakout from Bullish Pennant
Price is tightening inside a triangle after a strong impulse move.
A breakout above the resistance around $118K would confirm continuation.
Entry on the breakout targets the upper liquidity zone near $122K.
2- Second Long: Pullback to S&D Zone (around $115K)
If the breakout happens and then retraces, watch for price to revisit the S&D zone at $115,200–$115,800.
This area will act as support and provide a second long opportunity.
target: around $122k

Bitcoin May Continue Rising After Breakout📊 Market Overview:
• Bitcoin recently broke above $118,000, reaching a weekly high of $118,740, fueled by expectations of a Fed rate cut in September and strong ETF inflows into the market
• Katie Stockton from Fairlead Strategies highlights a bullish cup-and-handle pattern, supporting a potential 14% upside toward $134,500
📉 Technical Analysis:
• Key Resistance: $120,000 – $128,500 (based on Fibonacci projection).
• Nearest Support: ~$108,300 – previous resistance turned support, along with ~$107,000 near the 50-day EMA.
• EMA 09: Price is trading above the 9-day EMA, indicating a short-term bullish trend.
• Patterns & Volume:
o A cup-and-handle breakout suggests continued upside potential.
o Rising volume on breakouts reflects strong buying interest.
o MACD is bullish, and RSI is not yet overbought — allowing further room to rise.
📌 Outlook:
Bitcoin may continue to rise in the short term if it holds above the 9-day EMA and avoids a sharp drop below the $108k–110k support zone. A break below this area could trigger a deeper correction toward $100k.

Next top and bottomI exposing more future details. Dont be like the maxis and make sure to take some profits around October. Buy back around Nov 2026 to stack more sats for the long run

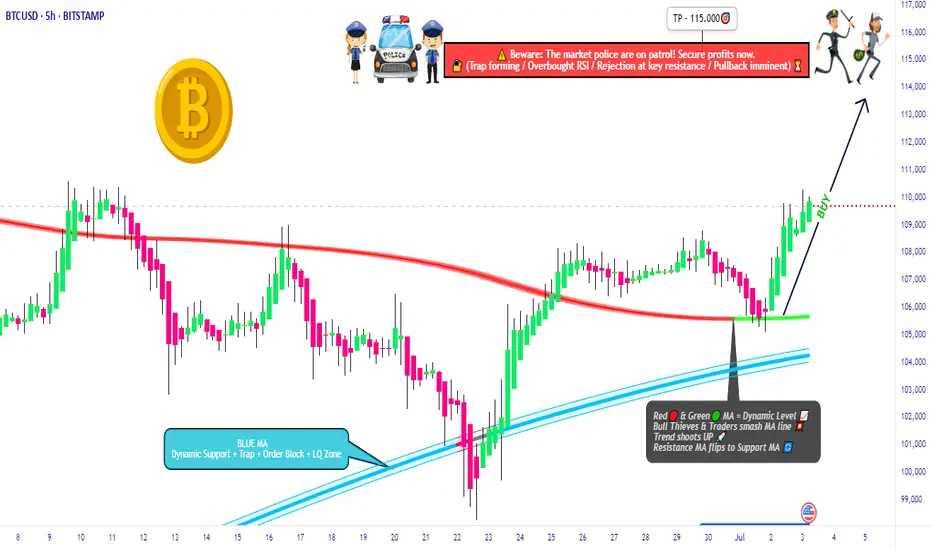
BTC/USD Heist Mode: Buy Low, Escape Rich🔓 BTC/USD Crypto Vault Breach: Thief Strategy for Long Entry Robbery (Swing/Day Setup) 🔓
🌟Hi! Hola! Ola! Bonjour! Hallo! Marhaba!🌟
Dear Money Makers & Robbers, 🤑💰💸✈️
🚨 Welcome to our next Thief Trading-style breakout mission — this time targeting the mighty BTC/USD vault. Using a fusion of technical precision and macro-level insight, we're charting a long entry blueprint for a profitable heist.
🔑 Entry Plan
"The vault is open!" 💥
Buy at current price or set Buy Limit near swing lows (15–30min timeframe pullback entries). We're timing the entry with stealth—precision over panic.
🛑 Stop Loss Setup
SL set near recent swing low (4H TF reference: ~104.000).
Adjust based on position sizing, risk appetite & multi-order tactics.
🎯 Take Profit Target
Targeting 115.000—or exit earlier if price action stalls. Get in, get out. Efficiency is the code.
👀 Scalpers' Notice
Only work the Long side. If your bag’s heavy, strike instantly. If light, ride with swing robbers. Use trailing SLs to protect your bag.
📈 Why We’re Bullish
Market momentum favors the bulls:
Overbought zones acting as lures
Bearish traps ready to flip
Key confluences from sentiment, COT, on-chain & macro analysis
➡️ Full supporting breakdown available 👉👉🔗🔗.
📢 Risk Note – Stay Sharp
Major news events = increased volatility ⚠️
Avoid entries during news. Trail stops to protect running profit. Rob smart.
💖 Boost the Crew
If this blueprint aligns with your mission, hit that Boost button. It fuels the team, and together, we profit like pros. One heist at a time. 💪🎉
🧠 Stay ready—next plan drops soon. Until then, rob safe, rob smart. 🐱👤
ETH / USDC Liquidity Pool RangeEthereum is climbing alongside Bitcoin, but it’s clearly outperforming. In many ways, ETH is the Microsoft of the crypto space—serving as a foundational platform on which countless networks and tokens are built, much like Windows supports a broad software ecosystem. In contrast to Bitcoin’s role as a digital currency, Ethereum functions more like a software operating system.
We broke out of the previous range for strong profits. The new range is tighter, with the lower boundary set just above the current ETH spot price at $2,995.91 and the upper boundary at $3,340.90, as marked by the horizontal yellow lines. On the 3-hour chart, momentum is beginning to turn upward. To enter the liquidity pool within this range, we must be fully allocated in ETH.

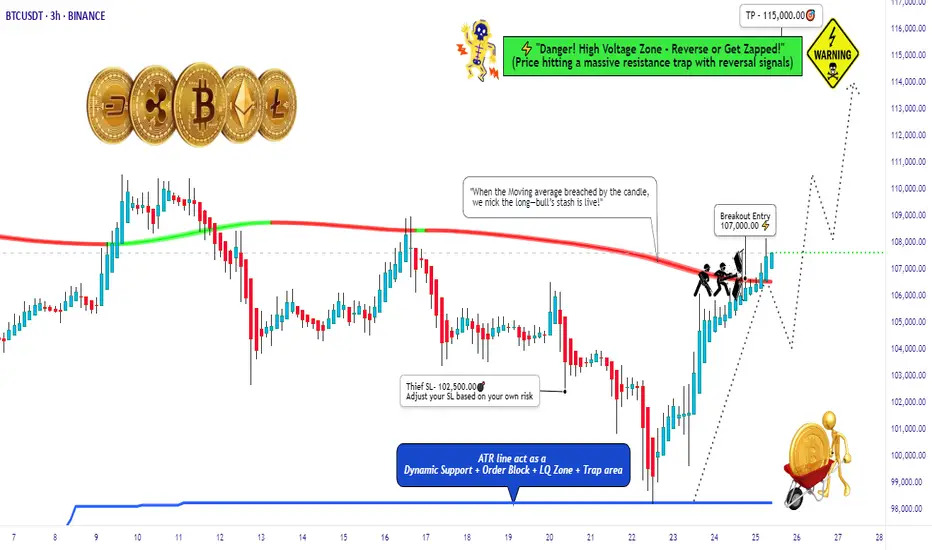
BTC/USD Thief Breakout at $107K – Eyeing $115K!🚨 Thief Entry Setup: BTC/USD Breakout Play 🚨
Overview:
Jump in after the $107 000 breakout—aiming for $115 000 with a tight “Thief SL” at $102 500. Adjust the stop‑loss to match your personal risk tolerance.
🧠 Setup Summary
Pair: BTC/USD
Entry trigger: Breakout above $107 000
Stop‑Loss: “Thief SL” at $102 500 (use your own risk‑based SL)
Target: $115 000
🎯 Why This Setup?
Clear breakout level at $107 000 = fresh momentum
Tight SL cushion (≈‑4.3%) = defined risk
Target ≈ +7.5% potential = strong reward-to-risk (~1.75:1)
📏 Risk Management Tips:
Only risk a small % of your capital—never exceed your comfort zone.
Move your SL to breakeven once mid‑target is hit to lock in profits.
Trailing your stop‑loss could secure bigger gains if BTC surges toward $115 000.
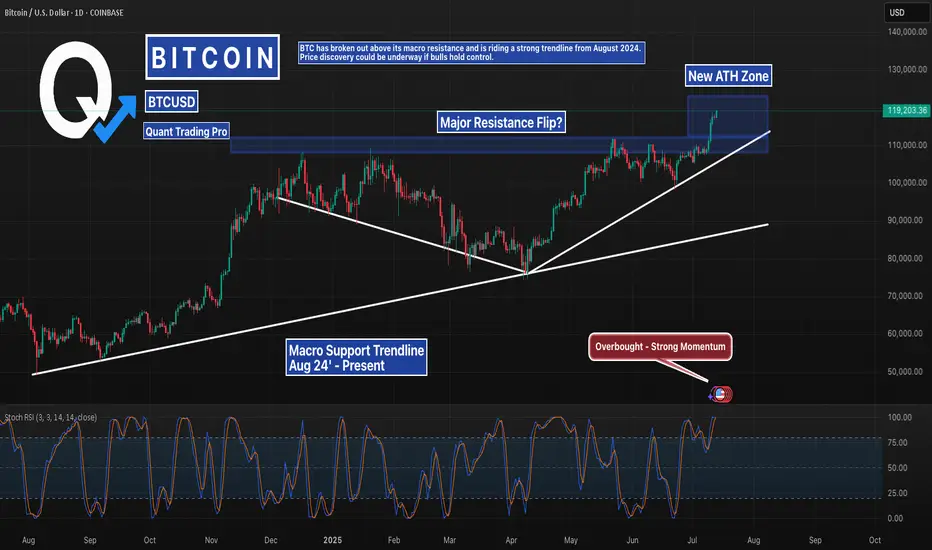
Bitcoin Breakout Confirmed – Eyes on Price DiscoveryBitcoin has officially flipped its macro resistance zone into support, continuing to follow a clean ascending structure from August 2024. With Stoch RSI pushing into overbought and no clear ceiling above, BTC may be entering a price discovery phase.
Stay alert for continuation or potential retest around $111K.
Bitcoin pushes higher, but its not the only game in townBitcoin is up around 26% this year. A strong gain. But it’s not alone. The higher Bitcoin rises, the less the gains become in percentage terms. It's now in a different league, so a $1,000 or $10,000 move its necessarily what it used to be.
Meanwhile, Gold, silver and copper have also pushed higher in 2025. The Nasdaq 100 is up too. All signs point to a weakening US dollar.
When risk assets and commodities rally together, it's a signal. Investors are shifting. Not out of fear, but to diversify away from the dollar. This is a theme that’s building strength.
Gold is up nearly over 25% YTD. Silver even more. Copper, the industrial bellwether, has joined the rally. These aren’t just trades. They’re strategic moves. A hedge against dollar debasement, inflation, and long-term fiscal risks in the US.
The Nasdaq’s rise tells a similar story. Tech stocks benefit when yields fall and the dollar softens. Big tech also has global revenue exposure. A weaker dollar inflates their earnings in foreign currencies.
What ties all this together? Loss of confidence in the dollar as the sole reserve hedge. Too much debt, too much printing. Central banks know it. They’ve been buying gold for years. Now, retail and institutional investors are catching on.
Bitcoin, the digital alternative to gold, gets the headlines. But it’s part of a broader move. The USD remains the world’s most important currency. That’s not changing tomorrow. But its dominance is being questioned in ways we haven’t seen in decades.
This isn’t just a crypto rally. It’s a dollar diversification play. And it’s gaining momentum.
The forecasts provided herein are intended for informational purposes only and should not be construed as guarantees of future performance. This is an example only to enhance a consumer's understanding of the strategy being described above and is not to be taken as Blueberry Markets providing personal advice.

Close to 200k is doable for this cycle!I don't like to bet on targets, I prefer taking profits around October 2025 as I mentioned multiple times. But this idea about topping around 194k is doable according to fib levels. Either way I am going to step out around October no matter the price, even if its bellow 100k.

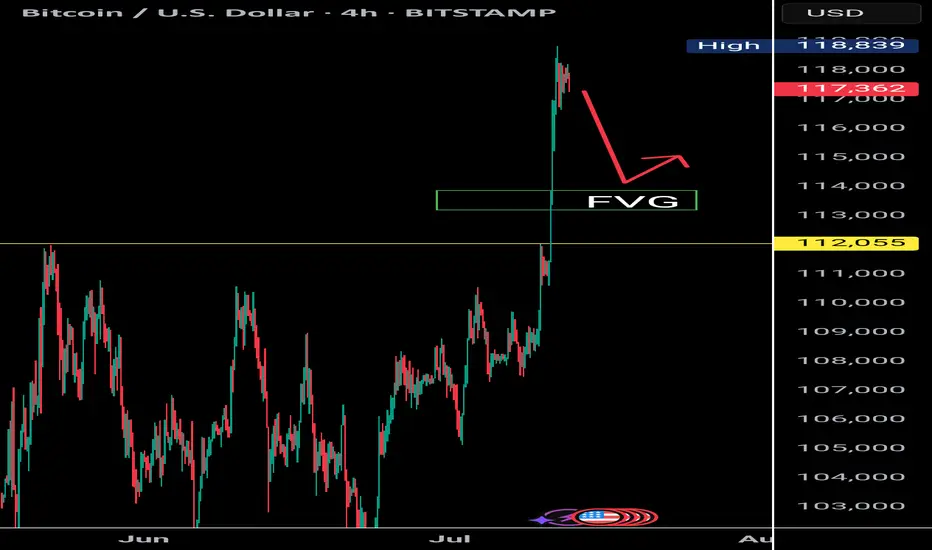
$BTC Rejection at 119K | Eyes on 112K Retest as RSI Cools DownBitcoin faces strong rejection near the $119K resistance zone, showing signs of a cooling market as the RSI exits the overbought territory. Historically, BTC tends to revisit key structural levels after such overheated moves. A favorable re-test zone lies between $114K and $112K, with $112K aligning closely with the previous all-time high — a psychologically significant support area.
Support levels to watch: $112K (favorable retest) and $110K (strong base).
As RSI continues to cool, keep an eye on bullish reactions around these levels for potential entries.
#BTCUSDT(BITCOIN): Two Targets First $130,000 And Then $150,000Bitcoin is poised for significant distribution, with a potential price surge to $130,000, followed by a swing target of $150,000. The current accumulation phase is poised to transition into a substantial bullish move. We anticipate a surge in bullish volume in the coming days or weeks. Our analysis anticipates this transition to be completed by the end of the year or sooner.
It is important to note that this analysis does not guarantee a specific price movement and is provided solely for educational purposes.
We extend our best wishes for your successful trading endeavours. If our analysis has been of assistance, we would appreciate it if you could express your gratitude by liking and commenting.
For further insights, please follow our account.
Team Setupsfx_

Bitcoin(BTC/USD) Daily Chart Analysis For Week of July 11, 2025Technical Analysis and Outlook:
In the last week's trading session, Bitcoin has demonstrated a significant surge, achieving historical prices as anticipated by TSS for an extended period. The cryptocurrency has successfully completed both the Outer Coin Rally 114500 and the Inner Coin Rally 118200. Presently, Bitcoin is poised to celebrate this notable accomplishment with a victory lap, but it may face a potential downward trajectory, targeting the Mean Support level of 112000. This anticipated decline will necessitate the resilience to a retest of Inner Coin Rally 118200. The designated targets for the Outer Coin Rally at this juncture are 122000, 126500, 132200, and 135000.

Prepare for the 2025 Crypto Summer as Bitcoin Shatters RecordBitcoin Experiences Impact of a $12B Short Squeeze: Here is How to Prepare for Imminent Crypto Summer
July 12, 2025 - The digital asset landscape has been irrevocably altered. In a move that will be etched into financial history, Bitcoin has shattered its previous all-time highs, surging with a ferocity that has left bears in utter ruin and bulls in a state of euphoric disbelief. After decisively breaking the formidable $109,000 barrier, the world’s premier cryptocurrency rocketed past $118,000, liquidating an estimated $12 billion in leveraged short positions in a cascade of forced buy-ins that added jet fuel to an already roaring fire.
This is not just another bull run. This is the manifestation of a market that has fundamentally matured. The "Crypto Summer" of 2025, long whispered about in investor circles, has arrived, and it is being majorly fueled by an unprecedented influx of institutional capital and a newly established clear regulatory outlook. While the price charts paint a picture of blistering gains, the underlying story is one of a structural shift in the global financial order.
For those who have watched from the sidelines, the question is no longer if they should pay attention, but how they can possibly prepare for the seismic shifts to come. This article will dissect the anatomy of this historic market event, explore the powerful forces driving this new paradigm, and offer a guide to navigating the thrilling, albeit treacherous, terrain of the 2025 Crypto Summer.
Part 1: The Anatomy of a $12 Billion Cataclysm
To comprehend the sheer violence of Bitcoin's recent ascent, one must first understand the market dynamics that preceded it. A short squeeze is a market phenomenon that occurs when a heavily shorted asset experiences a rapid price increase. This forces traders who bet on a price drop (short sellers) to buy back the asset to cover their positions and cut their losses. This sudden surge in buying demand creates a feedback loop, pushing the price even higher and liquidating more short positions along the way.
In the weeks leading up to the breakout, a palpable sense of bearishness had settled among many derivative traders. They saw the price range between $100,000 and $110,000 as a formidable distribution zone—a ceiling where bulls would run out of steam. Emboldened by this conviction, they began to build massive short positions. It's estimated that prior to Bitcoin’s bullish breakout above $109k, short traders had accumulated around $12B in leveraged positions, with many of these bets entered around the $118k level, anticipating a strong rejection from that point.
The trap was set. But it was the bears, not the bulls, who were about to be caught.
The initial catalyst was the clean break above the $109,000 resistance. This was followed by a swift move above a key bearish trend line that had formed on shorter timeframes, with resistance at $111,000. As the price then confidently reclaimed the $112,500 zone and began trading above the 100-hourly Simple Moving Average, the first wave of liquidations began.
What followed was a textbook short squeeze of epic proportions. As automated margin calls were triggered, computer algorithms began to market-buy Bitcoin at any price to close the losing short positions. This forced buying pressure propelled BTC through $113,000, then $114,000, and $115,000 in what felt like mere moments. The higher the price went, the more short sellers were forced to capitulate. The $12 billion in leveraged positions, once a wall of sell-side pressure, became a colossal wave of buy-side demand. The price action culminated in a spectacular surge past $116,000 and eventually screaming past $118,800, leaving market commentators and traders alike breathless. This event was a brutal lesson in the inherent risks of shorting a structurally bullish asset in a high-leverage environment.
Part 2: A New Paradigm: Institutional Capital and Regulatory Clarity
While the short squeeze provided the explosive catalyst, the true engine of this bull market is fundamentally different from those of the past. The frenzied, retail-driven manias of 2017 and 2021 have been replaced by a more deliberate, capital-heavy, and institutionally-led advance. The "Crypto Summer" of 2025 is built on the bedrock of legitimacy that only Wall Street and a clear regulatory stance could provide.
The ETF Revolution Matures
The launch of spot Bitcoin ETFs in early 2024 was a watershed moment, but 2025 is the year their impact has become undeniably dominant. These regulated financial products have provided a secure and familiar bridge for institutional investors, hedge funds, and even sovereign wealth funds to gain exposure to Bitcoin. The results have been staggering. In a clear sign of a changing of the guard in the world of alternative assets, spot Bitcoin ETFs have captured an astonishing 70% of gold’s inflows in 2025.
This statistic is more than just a headline; it represents the tangible manifestation of the "digital gold" narrative. For years, proponents have argued that Bitcoin's provable scarcity and decentralized nature make it a superior store of value to the yellow metal. Now, the flow of funds from the world's largest asset managers is proving this thesis correct. BlackRock’s IBIT, in particular, has shattered ETF records, becoming one of the fastest-growing funds in history and signaling to the entire financial establishment that Bitcoin is no longer a fringe asset but a core portfolio component.
The Certainty of Regulation
For years, the spectre of regulatory uncertainty has cast a long shadow over the crypto markets, deterring conservative institutional players. A key driver of the 2025 bull market has been the emergence of a clear regulatory outlook in major jurisdictions like the United States and Europe. With comprehensive market structure bills passed, clear guidelines on custody, and a defined tax framework, the biggest obstacle for institutional adoption has been removed.
This regulatory clarity has done more than just open the floodgates for capital; it has legitimized the entire asset class. Institutions operate on long-term horizons and require predictable rules of engagement. With these in place, they are no longer making a speculative bet but a strategic allocation to a new, globally recognized asset class. This influx of what is often called "stickier" capital—long-term investment rather than short-term speculation—is helping to build a more stable market foundation and reduce some of the notorious volatility associated with Bitcoin.
Part 3: Reading the Charts and Chains
The story of this bull run is written not only in the headlines but also in the data. A confluence of technical chart patterns, on-chain analytics, and market sentiment indicators paints a uniquely bullish picture, suggesting that this rally may have much further to run.
Technical Analysis: Echoes of the Past, Pointers to the Future
For seasoned market observers, the BTC price action in 2025 has mirrored the 2017 macro bullish breakout. The fractal nature of Bitcoin's four-year cycles, often centered around its programmatic "halving" events, appears to be playing out once again. The structure of the consolidation below $100,000 and the subsequent explosive breakout bears a striking resemblance to the patterns that preceded the parabolic run to $20,000 in 2017.
On a more granular level, the price has decisively conquered several key technical levels. The break above the bearish trend line at $111,000 was a critical signal that the downtrend pressure had been absorbed. Now, with the price trading firmly above $113,500 and the 100-hourly Simple Moving Average, these former resistance zones are expected to act as strong support levels for any potential pullbacks. The next major hurdle appears to be the $116,800 resistance zone, a level that, if cleared, could open the door to a much larger upward expansion.
Perhaps the most tantalizing model for predicting the cycle top is the Bitcoin "power law" model. This model suggests that Bitcoin's price growth over time follows a predictable exponential path when plotted on a logarithmic scale. Developed by analyst Giovanni Santostasi, the model views Bitcoin's long-term growth not as a random walk but as a structured, measurable trajectory akin to natural growth phenomena. According to analysts applying this model, Bitcoin is currently trading ahead of its long-term power law curve. Historically, this has been a sign that the market is entering the final, euphoric phase of its bull cycle. Based on this model, some analysts believe a Bitcoin Christmas rally to $200K or even $300K is possible, with the parabolic rally potentially lasting until the end of the year.
On-Chain Analysis: A Supply Shock in the Making
On-chain analysis, which involves examining data directly from the blockchain, provides a transparent view of investor behavior. One of the most encouraging signs for this rally is that Bitcoin Supply On Exchanges Remain Low Amid Latest Milestone. When investors move their BTC off exchanges, it is typically to place them in secure, self-custody wallets for long-term holding. This reduces the immediately available supply that can be sold on the market, creating a "supply shock" dynamic where even a small increase in demand can have an outsized impact on price. The current trend indicates that new institutional buyers and long-term believers are accumulating coins and have no intention of selling at current prices.
Further bolstering the bullish case is the metric of profitability. The market has reached a point where Bitcoin has broken records with 100% profitable days and unmatched returns. This means that for a vast majority of its history, buying and holding Bitcoin has been a profitable endeavor, reinforcing its narrative as one of an incredibly successful long-term asset.
However, a note of caution comes from on-chain analytics firm Glassnode, which warns that despite the breakout to over $118,000, liquidity is still thin. This means the order books on exchanges are not particularly deep. While this can amplify moves to the upside, it also means that a large sell order could cause a sharp and swift correction. This thin liquidity explains the continued volatility and serves as a reminder that the market, while more mature, is still susceptible to violent price swings.
Sentiment Analysis: A Rally Without the Mania
Perhaps the most compelling argument for further upside potential is what is absent from this rally: hype. In previous cycle tops, the market was characterized by a palpable mania. Bitcoin dominated mainstream news, celebrity endorsements were rampant, and stories of overnight crypto millionaires were inescapable.
This time is different. In a sign that suggests significant further upside potential, the current Bitcoin All-Time High Lacks Hype. Google Trends for "Bitcoin" are not at their peak, social media is not yet in a state of collective FOMO (Fear Of Missing Out), and the general public is not yet clamoring to get in. This suggests that the rally so far has been driven by the "smart money" of institutions. The retail-driven "mania phase," which typically marks the final blow-off top of a bull cycle, has not yet begun. This quiet confidence, devoid of irrational exuberance, is seen by many analysts as one of the healthiest indicators for the market's future.
Part 4: The Macroeconomic Tailwinds
A key factor is the falling dollar and anticipated Federal Reserve interest rate cuts. The US Dollar Index (DXY), which measures the greenback against a basket of foreign currencies, has been in a significant downtrend throughout 2025, hitting its lowest levels in over two decades relative to its moving averages. There is a historically strong inverse correlation between the DXY and Bitcoin; a weaker dollar makes assets priced in dollars, like BTC, more attractive to foreign investors and also pushes domestic investors to seek hedges against currency debasement.
Furthermore, the anticipation of interest rate cuts by the Federal Reserve to stimulate a slowing economy makes holding cash and low-yielding government bonds less attractive. This monetary policy shift encourages a "risk-on" environment, where capital flows out of safe-haven assets and into those with higher growth potential. As the ultimate digital risk-on asset, Bitcoin stands as a major beneficiary of this capital rotation.
The magnitude of this rally has also had fascinating side effects, such as the fact that the Bitcoin Surge Pushes Satoshi Nakamoto Into Global Top 15 Rich List. Based on the estimated 1.1 million BTC held by Bitcoin's pseudonymous creator, the recent price surge would place their net worth among the wealthiest individuals on the planet—a testament to the incredible value creation of this new technology.
Part 5: How to Prepare for the Imminent Crypto Summer
With a potential parabolic rally to $200,000 or $300,000 on the horizon, the central question for every investor is how to position themselves. The answer depends heavily on one's experience and risk tolerance. (This section is for informational purposes and should not be construed as financial advice).
For the Newcomer:
1. Education Before Allocation: Before investing a single dollar, take the time to understand what Bitcoin is. Learn about its core principles of decentralization, scarcity, and self-custody. Do not simply buy based on FOMO.
2. Dollar-Cost Averaging (DCA): Entering a market that is already in a parabolic uptrend can be risky. DCA involves investing a fixed amount of money at regular intervals, regardless of the price. This strategy reduces the risk of buying the top and smooths out your average entry price over time.
3. ETFs vs. Self-Custody: For the first time, investors have a simple choice. Buying a spot Bitcoin ETF through a traditional brokerage account is easy and secure. However, the core ethos of Bitcoin is self-sovereignty ("not your keys, not your coins"). Learning to use a hardware wallet to take self-custody of your coins is the ultimate way to embrace the technology, but it comes with greater personal responsibility.
For the Experienced Investor:
1. Prudent Risk Management: The warning of thin liquidity should be heeded. Volatility will remain high. Use stop-losses to protect capital, avoid excessive leverage, and do not get caught up in the euphoria. Have a clear plan for both entry and exit points.
2. Develop a Profit-Taking Strategy: No asset goes up forever. It is crucial to have a plan for taking profits. This could involve selling a certain percentage of your holdings at pre-determined price targets (e.g., $150k, $200k, $250k) or using technical indicators to signal a potential market top.
3. Look Beyond Bitcoin: Historically, a major Bitcoin rally paves the way for a subsequent "alt-season." As Bitcoin's dominance peaks, capital often rotates into Ethereum and other alternative cryptocurrencies with strong fundamentals, leading to explosive gains in those assets. Researching promising projects now could position you for the next phase of the crypto summer.
Finally, it is essential to address the question: Breakout Or Brutal Bull Trap? While all signs point to a sustained, institutionally-backed bull market, the risk of sharp corrections remains. Parabolic advances are often followed by equally dramatic pullbacks. The thin liquidity could exacerbate such a move. Staying grounded, managing risk, and sticking to a well-defined plan are the keys to surviving and thriving.
Conclusion
The Bitcoin story of 2025 is a symphony of powerful forces playing in perfect harmony. The violent crescendo of a $12 billion short squeeze announced its arrival, but the enduring melody is one of profound structural change. The unwavering commitment of institutional capital, flowing through newly approved and highly successful ETFs, has provided a stable and deep foundation for the market. This, combined with a clear regulatory framework and supportive macroeconomic tailwinds from a weakening dollar, has created the conditions for a historic "Crypto Summer."
Unlike the retail-driven manias of the past, this rally is characterized by a quiet confidence, a lack of widespread hype, and on-chain data that points to a severe supply shock. Models like the power law suggest that the journey is far from over, with potential targets that would have seemed fantastical just a year ago.
The road ahead will undoubtedly be volatile. But for those who understand the underlying dynamics at play—the institutional shift, the market structure, the on-chain truths—the path to navigating this new era is clear. The summer has just begun.

BITCOIN ABOUT TO CRASH HARD!!!!? (Be careful with your longs)I am sharing with you in this video the next CRYPTOCAP:BTC important resistances and support levels.
Together with the confirmations, it is said that if triggered, Bitcoin will start crashing hard, so be careful if you have overleveraged long positions opened right now!
Remember to always trade only with professional trading strategies and tactics, and make sure that your money management is tight!

Bitcoin Smashes Records, Hits $117,000Bitcoin has climbed to a new all-time high of approximately $117,000, gaining further credibility as an institutional asset class. Strong demand from ETFs, growing mainstream adoption, and a favourable stance from President Trump regarding crypto regulation are all contributing to this momentum.
As Bitcoin grows in market cap and adoption, its volatility has been slightly dampened, but it remains highly reactive at technical pivot points.
Technical View (BTC/USD):
The next resistance sits at $118,000, which also coincides with the 161% Fibonacci extension level. If price stalls here, expect potential pullbacks toward $114,000 or even down to $110,000. However, a confirmed breakout above $118,000 could re-establish a new bullish leg.

BTC Dominance (BTC.D) — Weekly Failed AuctionChart Context
• Instrument: CRYPTOCAP:BTC.D
• Time-frame: 1-Week
• *Key vLevels (dashed):
• 68 % – 2021 supply pivot
• 66-68 % zone – recorded a Weekly Failed Auction (wick above, close back below)
• 62.50 % – mid-range support / prior breakout shelf
Failed Auction at the Top
Price wicked into the 66-68 % vLevel but closed lower.
On a weekly chart that pattern often marks exhaustion; bulls couldn’t maintain control.
First Support = 62.50 %
If BTC.D trades < 62.50 % and closes a weekly bar there, odds rise that capital rotates out of BTC and into alt-coins.
Historically this breakdown triggers the early stages of alt-season (see 2021 analogue).
Invalidation
Weekly close > 68 % negates the failed auction and points to renewed BTC strength (alts lag).
How I’ll trade / allocate
Spot BTC bias – overweight BTC while dominance holds > 62 %.
Alt-coin rotation – shift 20-35 % into high-conviction alts only after a confirmed weekly close < 62 % and follow-through below 60 %.
Risk checks – trim alt exposure back to cash/BTC if dominance reclaims 62 % after a breakdown (failed alt-season).
