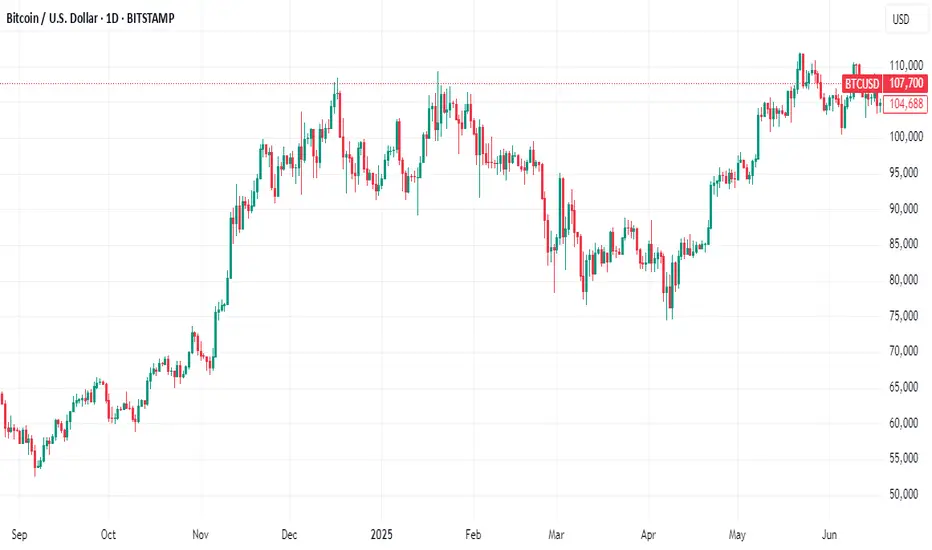
Bitcoin Breaks All-Time High: What’s Next?Bitcoin (BTC) has once again captured the world’s attention by smashing through its previous all-time high (ATH). This milestone has sparked excitement and speculation across the crypto community and beyond. But the key question remains: Will BTC continue its upward trajectory, or is a correction on the horizon?
Long-Term Outlook: The Bullish Case
In the long run, the fundamentals for Bitcoin remain strong. Several factors support a positive outlook:
Institutional Adoption: More institutional investors are entering the market, providing greater liquidity and legitimacy.
Scarcity and Halving Cycles: Bitcoin’s fixed supply and periodic halving events historically drive long-term price appreciation.
Macro Trends: Ongoing concerns about inflation and fiat currency devaluation continue to make BTC an attractive hedge.
Given these dynamics, we believe Bitcoin’s long-term trajectory remains upward.
Short-Term Caution: A Correction May Be Coming
While the long-term view is optimistic, the short-term picture may be less rosy:
Overheated Market Indicators: Rapid price surges often lead to overbought conditions, increasing the likelihood of a pullback.
Profit-Taking: After breaking ATH, some investors may lock in gains, adding selling pressure.
Technical Resistance: Historical patterns suggest that corrections often follow major breakouts.
We anticipate a potential correction, possibly pulling BTC back to the $90,000 range. This adjustment could unfold in the coming week or weeks as the market digests recent gains.
What Should Investors Do?
Stay Calm: Volatility is part of the crypto landscape. Corrections are healthy for sustainable growth.
Focus on Fundamentals: Remember why you invested in BTC in the first place.
Consider Dollar-Cost Averaging: Spreading out purchases can help mitigate the impact of short-term swings.
Conclusion
Bitcoin’s break above its all-time high is a testament to its enduring appeal and the growing confidence of investors. While a short-term correction may be likely, the long-term case for BTC remains compelling. As always, prudent risk management and a focus on fundamentals are key to navigating the exciting—and sometimes turbulent—world of crypto.
Do not consider it as investment advice.
#crypto #bitcoin #analysis
Bitcoinprice

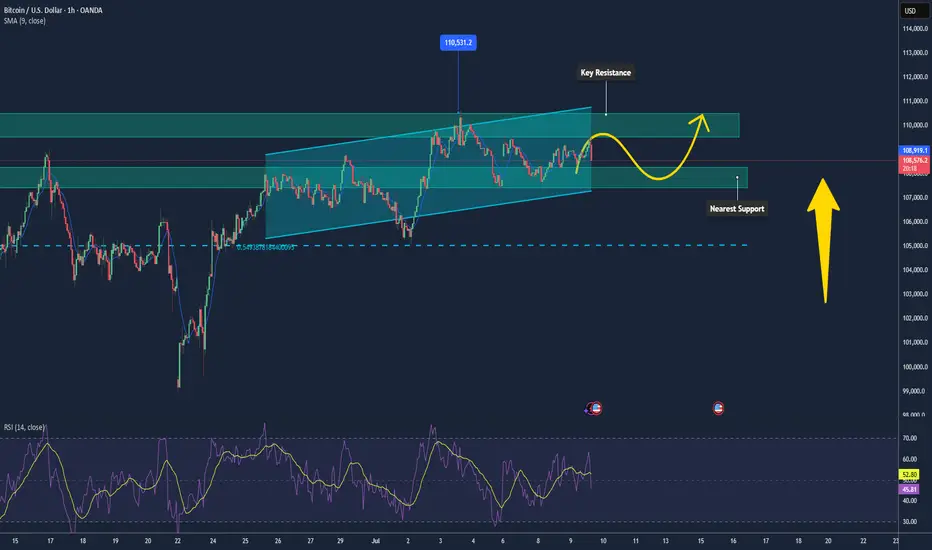
Bitcoin Maintaining Mild Uptrend, Poised Toward $110k📊 Market Overview:
• Strong ETF inflows continue, with over $13.5 billion in YTD flows into BTC, now making up nearly 70% of gold ETF inflows.
• Institutional investors like BlackRock (IBIT currently holds ~700k BTC) are still accumulating. The U.S. is also building a “Strategic Bitcoin Reserve,” reinforcing long-term confidence.
📉 Technical Analysis:
• Key Resistance: $109,000–$110,000, opening the path toward $110,500–$110,600 (Supertrend around $110,174).
• Nearest Support: $108,300 (EMA), followed by $107,800–$108,000; deeper pullback support at $105,000.
• EMA 09: Price is above this EMA → short-term trend remains bullish.
• Candlestick/Volume/Momentum: RSI is neutral around 58; MACD is converging near the zero line, signaling weakening bearish momentum and possible base formation.
📌 Outlook:
Bitcoin may continue its mild upward movement if it holds above $108,300–$108,000 and breaks clearly above $109k–110k with strong volume. Failure to do so could trigger a pullback toward $107,000–$108,000.
💡 Suggested Trading Strategy:
📉 SELL BTC/USD at: 109,500–110,000
🎯 TP: 108,000
❌ SL: 110,400
📈 BUY BTC/USD at: 108,200–108,500
🎯 TP: 109,500–110,000
❌ SL: 107,800
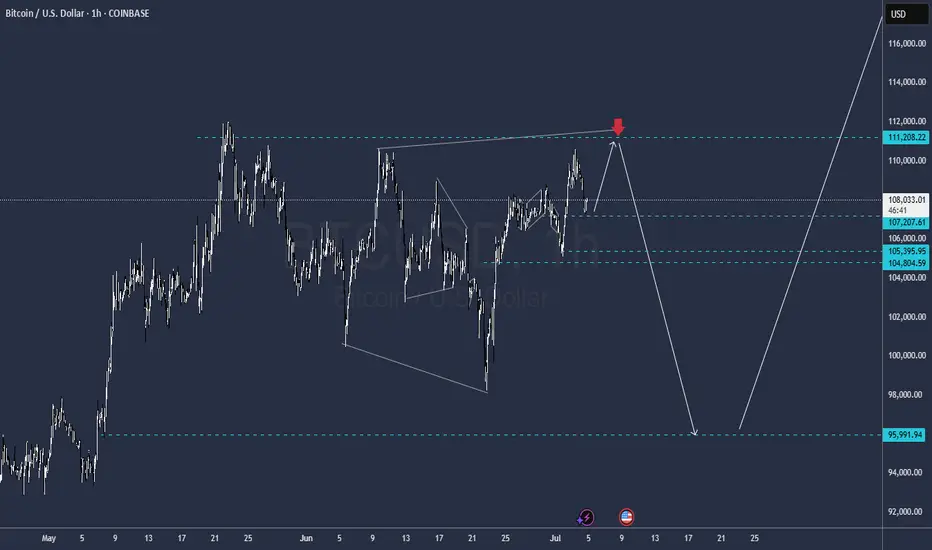
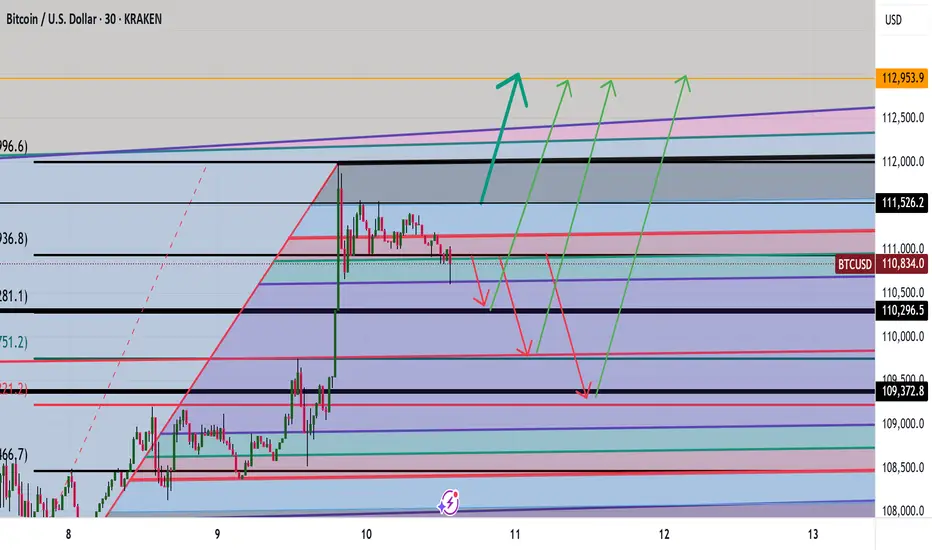
BTC Analysis TO 112,981 LEVELS AND BEYOND ? Good morning folks
BTC analysis with a little correction down to 110,300- 109,300 levels then a drive up to 112-113K levels
Let me know what you think
Kris/Mindbloome Exchange
Trade Smarter Live Better
Bitcoin at Triple Resistance – Will the Third Time Break It?BTC/USD is pressing against a key resistance zone near $112,500 for the third time in recent months.
This time, the breakout attempt is backed by a clear ascending trendline, showing sustained bullish pressure from the lows.
Highlights:
Triple top formation? Or ascending triangle breakout?
$112.5K has rejected BTC twice already
Higher lows = buyers stepping in more aggressively
Watch for volume surge and daily close confirmation
Break above = $118K–$120K likely in play.
Reject = revisit of trendline support near $106K.

XRP head to 7$XRP will make it the 2nd biggesst crypto in histiry surprassing Ethereum once ET Network is suffeering the biggest sells ever by traders.
Everyone on the other side is beting on Bitcoin, making it bigger but with room for others like XRP the best performing crypto in history.

BTC Correction's 📉 Significant Bitcoin Correction During Uptrend
After a strong bullish rally, Bitcoin has entered a correction phase, retracing nearly 25% of its recent gains. Interestingly, this correction aligns exactly with the 200-period moving average on the 4-hour chart, marking a potential key support level.
🔍 Is Bitcoin’s Correction Over or Just Beginning?
The overlap with the 200 MA could signal the end of the correction, but if this zone fails to hold, deeper targets between the 35% and 75% retracement levels may come into play.
🛡️ Potential Support Levels for Bitcoin if the Correction Continues:
First support: 102,200 USD – 25% correction
Second support: 93,200 USD – 35% correction
Third support: 84,100 USD – 50% correction
Fourth support: 74,600 USD – 75% correction

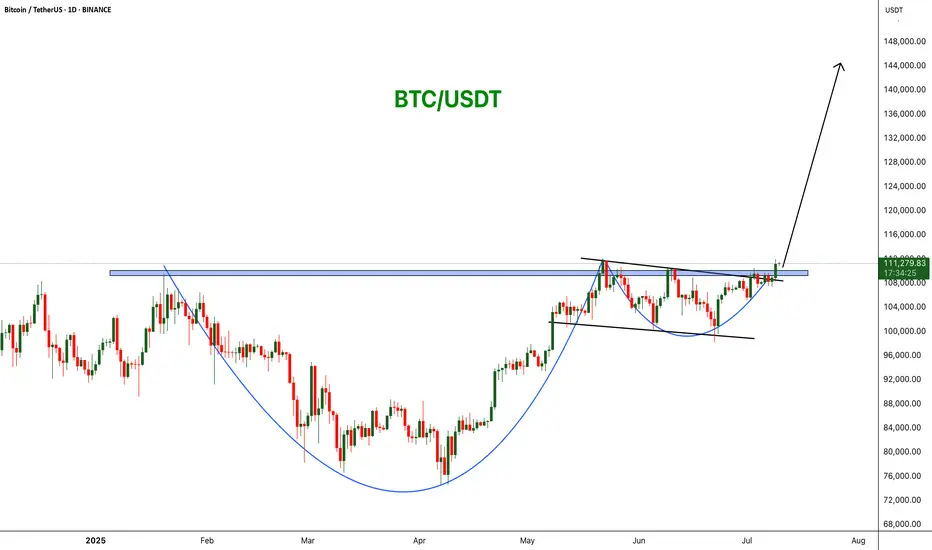
BTCUSDT: Cup and Handle Breakout! BINANCE:BTCUSDT is forming a powerful bullish breakout from a cup and handle pattern on the daily chart. Price has cleared key horizontal resistance around $110,000, signaling strength and the potential for a continuation move toward $144,444.
Stop Loss: $98K
Target : $144k
CRYPTOCAP:BTC
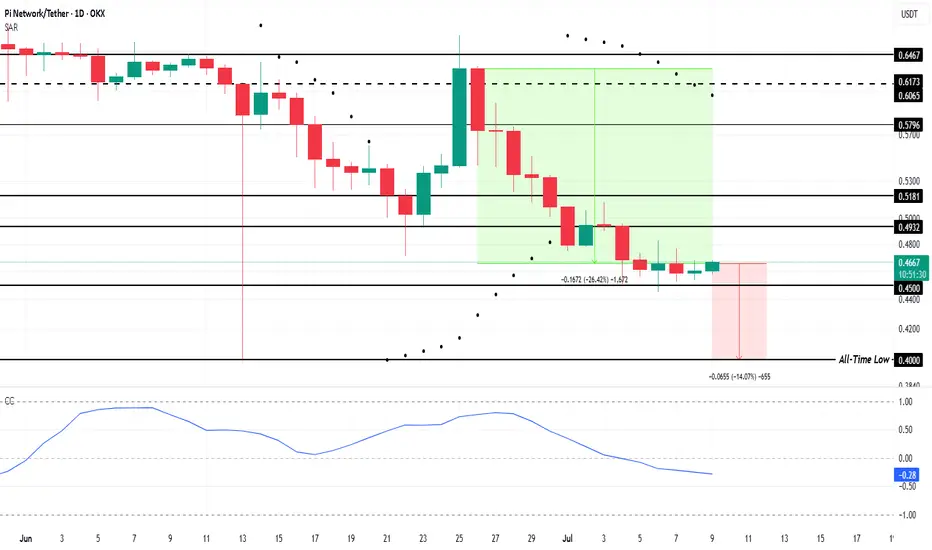
Pi Coin Decouples from Bitcoin, Pushes Price To All-Time LowOKX:PIUSDT is currently priced at $0.465, just above the critical support level of $0.450. With the altcoin hovering only 14% above its all-time low of $0.400 , it faces significant downside risk.
This price range puts Pi Coin in a precarious position, as a break below $0.450 could trigger a further decline. In the past two weeks, OKX:PIUSDT has already suffered a 26.4% drop , highlighting its ongoing struggle to regain momentum.
OKX:PIUSDT has experienced a dramatic shift in its correlation with BINANCE:BTCUSDT , now sitting at a negative 0.27 . This negative correlation means that Pi Coin is moving in the opposite direction to Bitcoin. In simpler terms, as Bitcoin rises, OKX:PIUSDT continues to struggle.
The negative correlation with Bitcoin suggests that Pi Coin will not capitalize on the positive trends seen in the wider cryptocurrency market. Instead, OKX:PIUSDT faces the risk of further decline.
Given these indicators, it seems likely that OKX:PIUSDT will fall to its all-time low of $0.400 . The fear of further losses is likely to prompt additional selling, which could accelerate the price decline. With the market sentiment weighed down by Pi Coin’s disconnection from Bitcoin, the path to recovery looks increasingly challenging.
However, there is still hope for OKX:PIUSDT if investors show restraint. If Pi Coin manages to hold the $0.450 support level, it could bounce back. A move past the $0.493 resistance level would be a positive sign , potentially pushing the price to $0.518. Such a recovery would invalidate the bearish thesis and offer a fresh outlook for the altcoin.
BITCOIN: BULL TRAP???! (Be careful if you are long)Yello! I am breaking down Bitcoin, and sharing with you the Elliot Wave descending Leading diagonal formation, Rising wedge aka contracting triangle where E wave might be forming a corrective mode wave triangle itself and, after that’s formed we might start crashing if we will get the confirmations we are waiting for, and which some of them I shared with you in this video. Enjoy Paradisers!

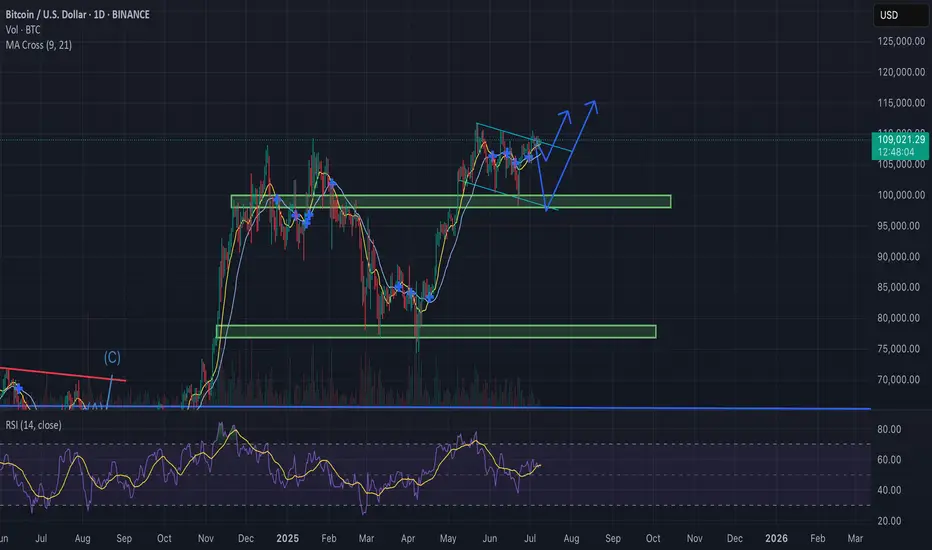
Bitcoin Update – Bullish Falling Wedge in Play?BTC/USD is currently trading near $108.8K, compressing within a falling wedge formation — historically a bullish continuation pattern, especially after a strong uptrend.
Why the Bias Remains Bullish:
Bullish MA Cross: Short-term MAs (9/21) are aligned for upside momentum.
Falling Wedge: Price compressing with lower highs and lows, coiling for a breakout.
RSI Strength: RSI (purple) remains elevated, supporting continued upside pressure.
Fundamental Catalysts:
Trump delays trade war announcements, reducing global uncertainty.
FOMC meeting in late July: Trump pushes for rate cuts, potentially bullish for risk assets like BTC.
If BTC breaks out above the wedge resistance with convincing volume:
Retest likely at ~$110K
Targets : $115K → $120K+
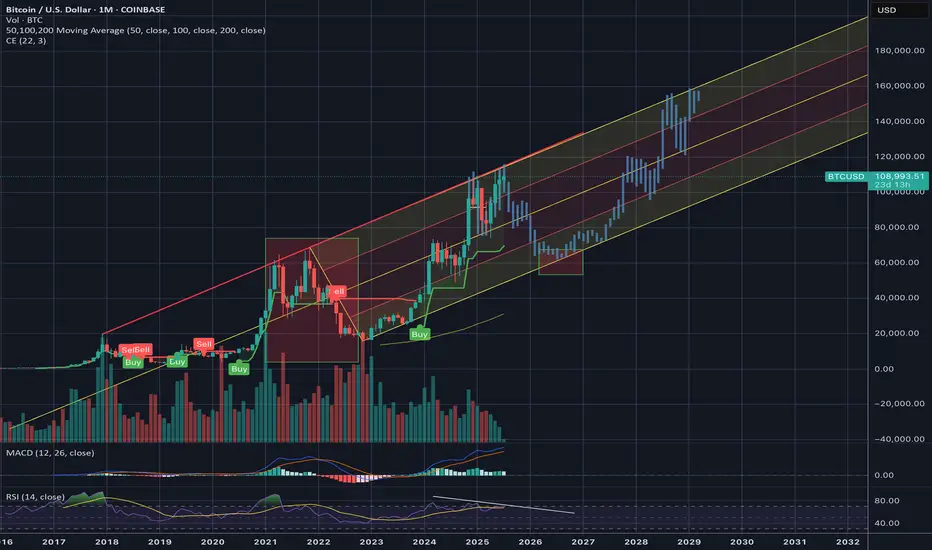
Interesting to see if this channel holds?CRYPTOCAP:BTC channel established from 2018 has held. If this channel holds, we are near if not at tops already and will be moving back down sooner than later.
Has #BTC really decoupled? COINBASE:BTCUSD
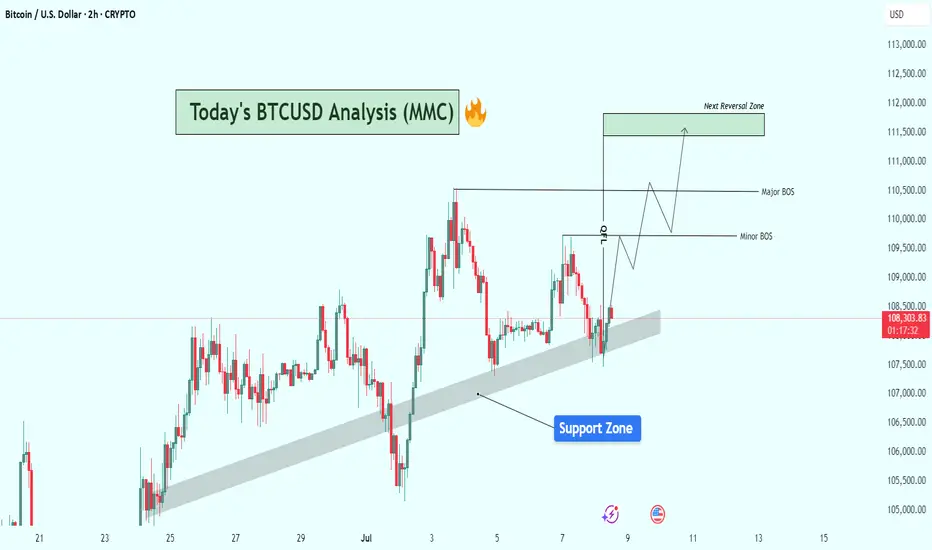
BTCUSD Structure Analysis : Bullish Zone From Support + Target🔍 Current Market Structure Overview:
Bitcoin is currently trading around $108,375, hovering just above a clearly respected rising support zone (shaded area). This dynamic support has held price multiple times and continues to act as a springboard for short-term bullish moves.
The chart illustrates a classic bullish continuation setup forming, with key structural levels marked as Minor BOS (Break of Structure) and Major BOS, indicating potential areas of trend validation and momentum acceleration.
🔹 Key Technical Elements:
✅ Support Zone:
The shaded diagonal support zone has acted as a bullish trendline base, holding up since late June.
BTC recently dipped into this area, found buyers, and is now attempting a reversal from this level.
This reinforces market interest and confirms the accumulation behavior in this zone.
⚠️ Break of Structure (BOS) Levels:
Minor BOS is marked near $109,800, signaling the first key intraday resistance.
A break above this level would signal bullish intent and open the way for price expansion.
Major BOS around $110,600–$110,800 is critical. A clean break here will likely validate a trend continuation toward the next objective.
🟩 Next Reversal Zone (Target Area):
Highlighted around $111,500–$112,000, this green zone represents a potential liquidity grab/reversal area where sellers could re-enter.
This zone aligns with previous price exhaustion levels and may trigger consolidation or a short-term pullback.
📈 Projected Price Path (Wave Schematic):
The chart outlines a wave structure projection, suggesting:
A possible retest of the minor BOS.
Follow-through into the major BOS area.
Final push into the reversal zone before potential rejection or sideways action.
🔧 Bias & Strategy:
Bias: Moderately Bullish as long as BTC respects the support zone.
Invalidation: A decisive breakdown below the trendline support and close under $107,500 would invalidate this bullish setup and shift bias to neutral/bearish short-term.
Trading Plan Ideas:
📥 Buy Opportunity: On minor dips within the support zone, targeting BOS levels.
📤 Sell Watch: Near reversal zone ($111.5K–$112K) if signs of exhaustion or bearish divergence appear.
📌 Final Notes:
BTC appears to be gearing up for a breakout from consolidation, and price action is coiling with higher lows. Market participants should watch closely how BTC reacts at the minor and major BOS zones, as they could define the next leg for either bullish continuation or rejection.
$BTC (BITCOIN) 4HPrice previously rallied strongly from a Fair Value Gap (FVG) at the bottom of the chart, forming a bullish market structure.
After a bullish displacement, BTC consolidated in a tight range (reaccumulation) and swept internal liquidity before breaking down.
Now, price has returned to a critical discount zone around 107800–107600
First Target: 109,229 — internal range high.
Main Objective: 112,000 — resting external liquidity above a clean high.
As long as BTC holds above 107600, we remain bullish. The current area is perfect for accumulation before a potential expansion phase toward external liquidity.

BTC Storm of Consolidation, New Money, and Macro-PoliticsBitcoin at the Precipice: A Perfect Storm of Consolidation, New Money, and Macro-Political Tailwinds
In the intricate and often tempestuous world of digital assets, there are moments of frantic volatility and periods of eerie calm. Bitcoin, the undisputed king of cryptocurrencies, currently finds itself in one of these fascinating lulls—a state of high-altitude consolidation that is anything but sleepy. Trading just a whisper away from its all-time high, the asset is coiling like a spring, absorbing immense selling pressure from early adopters while simultaneously drawing in a new, powerful wave of buyers. This delicate equilibrium, however, is set against a backdrop of explosive potential catalysts. From tightening technical indicators screaming of an imminent breakout to the looming deadline of US tariffs, the vocal endorsement of tech titans, and the unprecedented entry of Bitcoin into the mainstream political arena, the stage is being meticulously set. The question on every analyst's and investor's mind is no longer if Bitcoin will make its next major move, but when, and just how monumental it will be. This is not just another market cycle; it is a convergence of forces that could propel Bitcoin toward price horizons that were once the domain of only the most fervent optimists.
The Anatomy of a Healthy Consolidation: Whales Recede as a New Foundation is Built
At first glance, a market that stalls just below its peak might seem like a sign of weakness, an indication that the bullish momentum has been exhausted. However, a deeper look into the current structure of the Bitcoin market reveals a picture of profound strength and maturity. This period of consolidation is characterized by a crucial and healthy rotation of ownership. The so-called "whales"—early investors and large-scale holders who have accumulated vast quantities of Bitcoin at much lower prices—are beginning to ease their holdings. This is not the panic-selling seen during bear market capitulations. Rather, it is a strategic and logical process of taking profits, de-risking portfolios, and realizing life-changing gains after a historic run.
Every Bitcoin sold by a whale must be bought by someone else, and the identity of these new buyers is what makes the current phase so compellingly bullish. The supply being released onto the market is not causing a price crash; instead, it is being steadily absorbed by a fresh cohort of participants. This new wave includes a diverse mix of players: retail investors who are gaining confidence as Bitcoin solidifies its mainstream status, smaller institutional players who are now more comfortable entering the market, and, most significantly, corporations that are beginning to view Bitcoin as a legitimate treasury reserve asset. This process is akin to the changing of the guard. The early pioneers are passing the baton to a new generation of holders who are establishing a new, higher cost basis. This dynamic is incredibly constructive for long-term price stability. It builds a robust and formidable wall of support at these elevated price levels, transforming what was once a speculative peak into a solid foundation for the next leg up.
Further evidence of this underlying strength can be seen in Bitcoin's recent weekly performance. The asset has managed to set another record high weekly close. In the world of technical analysis, a weekly close is considered far more significant than a brief, volatile intraday spike. An intraday high can be the result of a short-lived speculative frenzy or a liquidation cascade, but a high weekly close demonstrates sustained buying pressure and conviction over a longer duration. It signifies that, for seven straight days, buyers successfully defended higher price levels against sellers, ultimately winning the battle as the candle closed. This repeated ability to secure high weekly closes indicates that the market is systematically accepting and validating these new price territories, creating a psychological and technical launchpad for a future assault on all-time highs. Traders are now intensely focused on this dynamic, attempting to pinpoint the new, higher bottoms of this consolidation range, recognizing that these levels are likely to serve as the bedrock for the next major bull run.
The Technical Cauldron: Bollinger Bands Signal an Imminent and Violent Breakout
While the fundamental picture is one of healthy rotation, the technical charts are sending an even more urgent message: prepare for a massive move. Among the myriad of indicators used by traders, the Bollinger Bands are currently painting a particularly dramatic picture. Bollinger Bands consist of three lines plotted over a price chart. The middle band is a simple moving average, while the upper and lower bands are positioned at a set number of standard deviations away from the middle band. In essence, they are a direct measure of market volatility. When the market is volatile, the bands widen. When the market is calm and consolidating, the bands contract, or "squeeze."
Bitcoin is currently in the midst of one of the most significant Bollinger Band squeezes seen in recent history. The upper and lower bands have drawn incredibly close to one another, indicating that volatility has been wrung out of the market to an extreme degree. Historically, such periods of low volatility are the calm before the storm. A Bollinger Band squeeze is almost always resolved by a period of explosive, high volatility—a powerful breakout. The longer and tighter the squeeze, the more violent the subsequent price move tends to be. The indicator itself does not predict the direction of the breakout, but in the current context, the directional bias is overwhelmingly clear. With Bitcoin consolidating just shy of its all-time high after a powerful uptrend, and with the fundamental backdrop being so strong, the path of least resistance is overwhelmingly to the upside.
This technical setup creates a powerful psychological feedback loop. As more traders and algorithms spot the tightening bands, they begin to position themselves for the inevitable breakout. This builds a massive amount of potential energy within the market. When the price finally does break through the upper band, it can trigger a cascade of buy orders—from traders entering new long positions, to short-sellers being forced to buy back to cover their losing bets. This rush of buying pressure is what can turn a simple breakout into a parabolic, face-ripping rally.
The anticipation surrounding this move has led to some audacious price targets being discussed. Analysts are now contemplating the possibility of a "false move" to as high as $105,000. The term "false move" in this context is intriguing. It could imply a rapid, almost wick-like surge to that level, driven by extreme speculation and leverage, which might then be followed by a sharp correction to shake out the "paper hands" before a more sustainable climb resumes. Alternatively, it could simply be a way of expressing disbelief at the sheer velocity of the potential move. Whether the target is $105,000 or another figure, the underlying message from the charts is unambiguous: Bitcoin is on the verge of a big move, and the technicals strongly suggest it will be a powerful breakout to the upside, potentially ushering in a new phase of price discovery.
The Confluence of Catalysts: Tariffs, Politics, and The Musk Effect
A primed technical setup is potent on its own, but when combined with powerful external catalysts, it creates the recipe for a perfect storm. Bitcoin's next potential move is not just being driven by its internal market dynamics; it is being pulled forward by a confluence of macroeconomic and political forces that are aligning in its favor.
One of the most significant near-term catalysts is the looming US tariff deadline. Historically, periods of geopolitical tension and economic uncertainty have been incredibly bullish for Bitcoin. Tariffs, trade wars, and protectionist policies create instability in global markets and can erode the value and trust in fiat currencies. As nations engage in economic conflict, savvy investors and even central banks begin to look for non-sovereign, censorship-resistant stores of value to hedge their wealth. Bitcoin, with its decentralized nature and fixed supply, is the ultimate hedge against such fiat currency debasement and geopolitical turmoil. The impending tariff deadline is forcing a global conversation about the stability of the current financial system, and Bitcoin stands to be a primary beneficiary as capital seeks a safe haven from the storm.
Adding fuel to this fire is the upcoming "Crypto Week," a period of heightened focus on the industry through conferences, major announcements, and media coverage. These events act as a gravitational force, pulling the attention of the financial world toward the digital asset space. This concentrated attention almost always leads to increased trading volume and volatility. It creates a self-fulfilling prophecy where the expectation of big news and market moves encourages traders to participate, thereby creating the very volatility they anticipated.
Perhaps the most electrifying and unpredictable catalyst, however, is the re-emergence of Elon Musk's "love" for Bitcoin and the asset's dramatic entrance onto the main stage of American politics. Musk, with his colossal social media following, has a proven and unparalleled ability to influence market sentiment with a single post. His recent teasing of a "Pro-Bitcoin America Party" has sent shockwaves far beyond the crypto community. This move, whether serious or satirical, has injected Bitcoin directly into the heart of the US political discourse. It reframes Bitcoin not just as a financial asset, but as a political symbol—a representation of innovation, decentralization, and freedom from government control.
This has been met with a reaction from other major political figures, including Donald Trump, creating a fascinating push-and-pull. The fact that leading presidential candidates and political influencers are now debating Bitcoin's merits and role in the nation's future is a monumental step in its journey toward mainstream legitimacy. It forces the public and policymakers to take it seriously. This political theater creates an environment where assets perceived as being aligned with pro-growth, pro-innovation, and pro-freedom ideologies can thrive. The emergence of a "BTC Bull Token" or similar concepts tied to this political momentum underscores the new reality: Bitcoin is no longer just a tech story; it is a powerful political and cultural movement, and this new dimension is likely to attract a wave of capital from those who align with its burgeoning ideology.
The Institutional Stamp of Approval: A Corporate Treasury Revolution
While retail excitement and political drama provide the fuel, the institutional adoption of Bitcoin provides the solid, unshakeable foundation for its long-term trajectory. The most powerful recent example of this trend is the announcement from Genius Group, a publicly traded education technology company, that it is increasing its Bitcoin treasury target to a staggering 10,000 BTC. This is not a speculative trade; it is a profound strategic shift in corporate treasury management.
This decision signifies that corporate boards and CFOs are beginning to understand and act upon Bitcoin's value proposition as a superior treasury reserve asset. In an era of persistent inflation and low-to-negative real yields on traditional assets like government bonds, holding large amounts of cash on a balance sheet is a guaranteed way to lose purchasing power. By allocating a portion of its treasury to Bitcoin, Genius Group is taking a proactive step to protect its shareholders' value from the ravages of monetary debasement. It is a declaration of confidence in Bitcoin's long-term potential as a reliable store of value.
The importance of such a move cannot be overstated. It provides a powerful stamp of approval and a case study for thousands of other corporations around the world. When one publicly traded company makes such a bold move and outlines its rationale, it normalizes the strategy. Other CFOs, who may have been hesitant, now have a blueprint to follow and a precedent to point to when presenting the idea to their own boards. This has the potential to unlock a veritable floodgate of corporate capital. Even a small, single-digit percentage allocation from the treasuries of the S&P 500 companies would represent hundreds of billions of dollars of new, sustained buying pressure for Bitcoin. The move by Genius Group is not an isolated event; it is the leading edge of a seismic shift in how the corporate world perceives and utilizes money.
Conclusion: The Dawn of a New Epoch
Bitcoin stands at a historic inflection point. The current period of quiet consolidation is deceptive; beneath the surface, a powerful confluence of forces is converging to launch the asset into its next major chapter. The market's internal structure has never been healthier, with the holdings of early whales being patiently absorbed by a new and committed class of buyers, building a formidable price floor far above previous highs. The technical charts are screaming of an imminent and powerful breakout, with the tightening Bollinger Bands signaling a massive release of energy that heavily favors the upside.
Layered on top of this potent technical and structural setup is a perfect storm of external catalysts. The specter of global economic instability driven by tariffs, the focused attention of a "Crypto Week," the unparalleled influence of figures like Elon Musk, and the shocking but legitimizing entry of Bitcoin into the partisan political arena are all acting as powerful tailwinds. This is all underpinned by the quiet but revolutionary trend of institutional and corporate adoption, which promises to bring waves of new capital into the asset for years to come.
The consolidation will soon end. The question is not about direction, but about magnitude. The forces at play are no longer just about market cycles; they are about a fundamental repricing of a global, non-sovereign asset in a world grappling with economic and political uncertainty. The stage is set for a breakout that could not only shatter previous all-time highs but could also permanently elevate Bitcoin's status, solidifying its role as a cornerstone of the 21st-century financial and political landscape.
XRPUSDT Forming Bullish BreakoutXRPUSDT is showing an interesting setup with a bullish breakout potential that could fuel gains of 60% to 70% or more in the coming weeks and months. The recent price action suggests that XRP is breaking out of a long-standing consolidation pattern, with price pushing above a descending trendline and holding well above key support levels. This breakout is attracting both retail traders and big investors who see Ripple’s strong fundamentals and unique use case in the cross-border payment sector as major catalysts for its long-term growth.
The trading volume has remained healthy, signaling strong market participation and increasing confidence that XRP’s next move could be substantial. If momentum continues, traders can expect a potential rally towards major resistance zones, with increased interest from whales likely to accelerate the bullish scenario. Market sentiment around XRP has also improved thanks to positive developments in its legal battles and expanding partnerships, which add further conviction for investors.
XRP’s performance has historically shown that when it moves, it often does so aggressively, rewarding patient holders and active traders alike. This pattern aligns well with broader altcoin market cycles, where XRP tends to outperform during bullish phases. As always, it’s essential to monitor price action around key levels, adjust stop-losses wisely, and stay updated with market news to make the most of this potential run.
✅ Show your support by hitting the like button and
✅ Leaving a comment below! (What is You opinion about this Coin)
Your feedback and engagement keep me inspired to share more insightful market analysis with you!

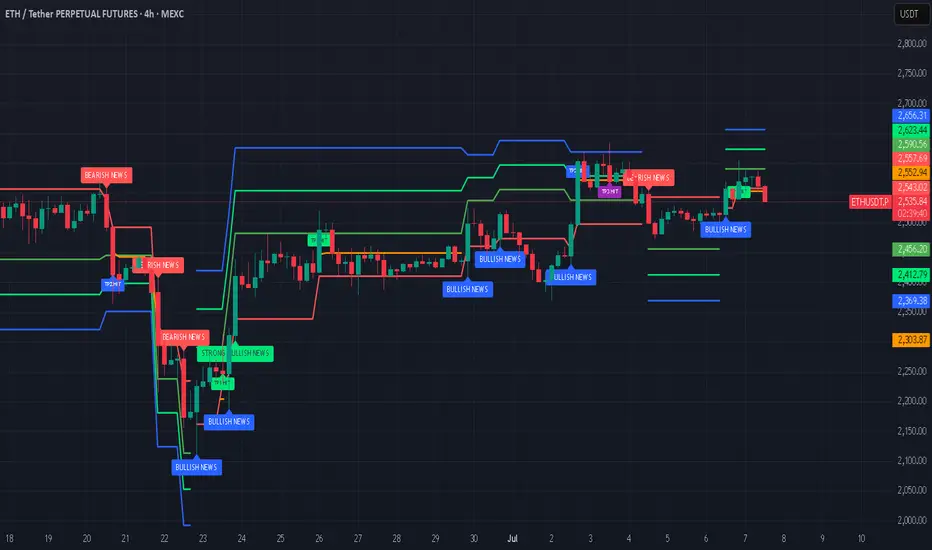
ETH - Should I go long?Ethereum (ETH) is currently positioned at a critical juncture, with multiple technical and fundamental indicators suggesting the potential for a significant move ahead.
Current Price and Momentum: As of the latest real-time data, ETH is trading at $2,549.97, having recently started a fresh increase above the $2,520 zone. The price is above both the $2,550 level and the 100-hourly Simple Moving Average, indicating short-term bullish momentum.
Key Resistance Levels: The immediate resistance is near $2,600, followed by $2,620 and a major barrier at $2,650. A decisive break above $2,650 could open the path toward $2,720 and potentially $2,800 in the near term.
Support Levels: On the downside, $2,520 is a key support zone. A sustained drop below this could trigger declines toward $2,500 or even $2,420, but as long as ETH holds above $2,520, the bullish structure remains intact.
On-Chain and Institutional Signals: Long-term holders have been accumulating ETH, and institutional inflows have surged, with over $750 million invested recently. This accumulation, alongside strong ETF inflows and rising staking activity, points to growing confidence and could act as a catalyst for a major price move.
Technical Patterns: ETH is consolidating above critical moving averages and within bullish chart formations (such as ascending triangles and coiling structures). These patterns often precede significant breakouts, especially when accompanied by increasing trading volumes and improving momentum indicators.
Market Sentiment: While short-term indicators show some cooling, the broader trend remains bullish. Analysts note that if ETH can break above the current resistance cluster, it could ignite a new wave of bullish momentum and set the stage for a broader breakout.
In summary: Ethereum is at a pivotal resistance zone. If it can break and hold above $2,600–$2,650, analysts expect a strong move higher, with targets at $2,800. Institutional inflows, strong on-chain accumulation, and bullish technical setups all support the case for a significant upside move in the coming weeks or months, provided key support levels are maintained.
Note that a possible correction of Bitcoin (which essentially will result in a drop of the entire crypto market) is possible in the next weeks.
#crypto #eth #btc #bitcoin #ethereum #analysis #trading #portfolio #long #algorithm #buysellsignals #tradingsignals #bullrun
BITCOIN CRASH INCOMING!!! (Brace Yourself Now???) I am breaking down MARKETSCOM:BITCOIN and the potential completion of the 4th wave on an leading diagonal which might work as an early warning of a crash towards $93k!
Wait for the confirmations, and play the market with a proper trading strategy that you have backtested enough to be able to say that you will be long-term profitable. That means make sure your trading system is good enough that you always have an edge and a great enough money management system to make sure that you are giving your edge enough space to play out in the long run and be robust against losing streaks!

BTC's Situation, A Comprehensive Analysis !!!Bitcoin is now at a point where it cannot be ignored! In my view, the bullish wave has started after the corrective wave ended. This wave could continue until it breaks the ascending triangle, then with a slight correction, push the price upward again. The current period and the coming days could be crucial in determining the market's trend.
Best regards CobraVanguard.💚

Bitcoin BTC Trade Plan: Watching for Breakout or Pullback Entry📊 Currently watching BTC (Bitcoin) as price action remains bullish overall, but we're approaching a key decision point 🎯
💹 Price is pushing higher, but with some signs of exhaustion after the recent rally ⚠️ — and with the weekend approaching, we could either see a continuation higher or a healthy pullback
I’m keeping an eye on two potential trade scenarios:
1️⃣ A break and clean retest of the recent high, which could offer a continuation long if momentum follows through 🚀
2️⃣ A retracement into equilibrium — a deeper pullback toward fair value 📉 — which could also present a high-probability long setup if confirmed with structure and reaction 📈
Either way, I’m letting the market reveal its hand and waiting for one of these setups to play out before committing 💡
💬 Not financial advice — always assess your own risk and confirm with your own analysis.


BTC: 650 Point Long Trade To 108,650$ (Date: Sat 05 Jul 25)High potential signal as my all signals. Don't miss this opportunity. At least open a trade in demo just to test.
Details:
Entry: Now - 108,100 $
Target Price: 108,650 $
Stop loss: 107,700 $
Trade Ideas:
There is a flag pattern here after a good down trend. So here is possibility for a small pull back till my target price.
Trade Signal:
I provide trade signals here so follow my account and you can check my previous analysis regarding BITCOIN. So don't miss trade opportunity so follow must.
BINANCE:BTCUSDT BINANCE:BTCUSDT.P BYBIT:BTCUSDT.P

ETH: Buying in the DipCME: Micro Ether Futures ( CME:MET1! ), #microfutures
On May 22nd, #Bitcoin reached a new all-time high of $111,814. The king of cryptos rallied as bullish sentiment built up behind the most pro-crypto U.S. administration. As of last Friday, bitcoin realized a one-year return of +90.8%. For comparison, holding S&P 500 only yields 11.8% for a year, even after the US stock index made its ATH last week.
Meanwhile, #Ethereum, second only to Bitcoin in the cryptocurrency world, experienced a dramatic decline in 2025. ETH is currently trading around $2,500, down 40% since December. It is a far cry from its ATH of $4,815 on November 9, 2021.
Why Is Ethereum (ETH) Falling?
The most significant challenge facing Ethereum is the proliferation of Layer 2 scaling solutions. Networks such as Arbitrum, Base, and Optimism were developed to address Ethereum's scalability issues, but they've created a revenue problem for the main chain.
When users conduct transactions on these Layer 2 networks, transaction fees flow to third-party organizations rather than to the Ethereum network itself. Revenue diversion has weakened Ethereum's economic model.
Ethereum could counter the revenue erosion by implementing a fee on Layer 2 transactions. However, it would undermine the very purpose of these networks. Layer 2 solutions were designed specifically to reduce transaction costs by processing operations off-chain and submitting only batched results to the main network. Adding fees would increase costs and diminish their competitive advantage.
Increased competition in the blockchain space has further eroded Ethereum’s dominance. Investors have been withdrawing funds from Ethereum and redirecting them to competing projects with potentially better returns or technological advantages.
Future Outlook
Ethereum’s path forward appears challenging. While the platform still hosts thousands of decentralized applications and maintains a large developer community, its economic model is under pressure from multiple directions. Without finding new ways to generate value, Ethereum may continue to lose market share to more nimble competitors.
The platform’s supporters point to upcoming technical improvements and the maturation of the proof-of-stake consensus mechanism as potential catalysts for recovery. The recent approval of staking enabled ETF for Ethereum in Hong Kong is one of the ways forward. However, with increasing competitive pressures, Ethereum faces an uphill battle to reclaim its former status as the undisputed leader in smart contract platforms.
While the future remains challenging, Ethereum still has upside potential at the current price level. As ETH dropped below $1,500 in April, bargain hunters came in to scoop it up. As a result, ETH had a spectacular rebound of 70% in the last three months, outrunning Bitcoin’s 25% gain for the same period.
There are over 17,000 cryptocurrencies in existence, according to Coin Gecko. However, only a handful of them have proven to have a lasting investment value. We could refer to Bitcoin and Ethereum as the digital form of Gold and Silver. Historical trend shows that the spike in gold prices would likely prompts investors to buy silver at a lower cost, helping maintain a stable Gold/Silver price ratio. The same could be true for the BTC/ETH relationship.
For extensive reading, please refer to my Editors’ Picks, The Gold-Silver Ratio Explained, published on TradingView on April 28th.
Recent regulations on #stablecoins in the US and Hong Kong are good news to the crypto space. It legitimates crypto offerings from mainstream financial institutions. Bitcoin is positioned for another big lift as investors reallocate assets into cryptos.
On July 4th, President Trump signed into law the “Big and Beautiful Bill”. Above all, this massive package funds deficit spending and raises the national debit by $5 trillion. While we will carry the debt burden for many years, in the short run, injecting huge liquidity into the economy and the financial market would pop up asset prices.
The latest CFTC Commitments of Traders report shows that, as of June 24th, the total open interest for Micro Ether futures are 128,500 contracts.
• Leverage Fund has 94,167 in long, 112,442 in short, and 1,854 in spreading
• The long-short ratio of 0.84 does not provide a good indication of what the “Smart Money” views about Ethereum.
In summary, I hold the view that ETH may regain ground above 3,300 before year end. Investors sharing this bullish view could explore CME’s Micro Ether Futures ( NYSE:MET ).
Long Futures with Stop Loss
Last Friday, the August Ether Futures contract (METQ5) was settled at 2,518. Each contract has a notional value of 0.1 ETH, or a market value of $251.8. To buy or sell 1 contract, a trader is required to post an initial margin of $84. The margining requirement reflects a built-in leverage of 3-to-1. It’s cost-effective to invest with CME MET futures, vs. buying ETH from the spot market.
Let’s use a hypothetical trade to illustrate how the long futures with stop loss strategy would compare with buying spot ETH.
Hypothetical Trade:
• Buy 1 METQ5 contract at 2,518, and set a stop loss at 2,400
• Trader pays $84 for initial margin
High Price Scenario: Ethereum rises to $3,000
• Futures gain will be $48.2 (= (3000-2518) x 0.1)
• Futures return will be +57.4% (= 48.2 / 84)
• This compares to a 19.1% for investing in spot ETH. (= (3000 /2518) – 1)
Low Price Scenario: Ethereum drops to $2,000
• Futures stop loss at 2,400, and the maximum loss is $11.8 (= (2518-2400) x 0.1)
• Futures return will be -14% (=11.8 /84)
• This compares to a 20.6% loss for investing in spot ETH. (= (2000 /2518) – 1)
The above scenarios show that
• When ETH goes up, futures will have higher returns due to its leverage nature.
• When ETH falls, the stoploss will kick in to reduce losses.
Happy Trading.
Disclaimers
*Trade ideas cited above are for illustration only, as an integral part of a case study to demonstrate the fundamental concepts in risk management under the market scenarios being discussed. They shall not be construed as investment recommendations or advice. Nor are they used to promote any specific products, or services.
CME Real-time Market Data help identify trading set-ups and express my market views. If you have futures in your trading portfolio, you can check out on CME Group data plans available that suit your trading needs www.tradingview.com

Bitcoin UPDATEThe sell is @ 111.200
I think it still has to make a new high, sell is not ready just yet
levels highlighted