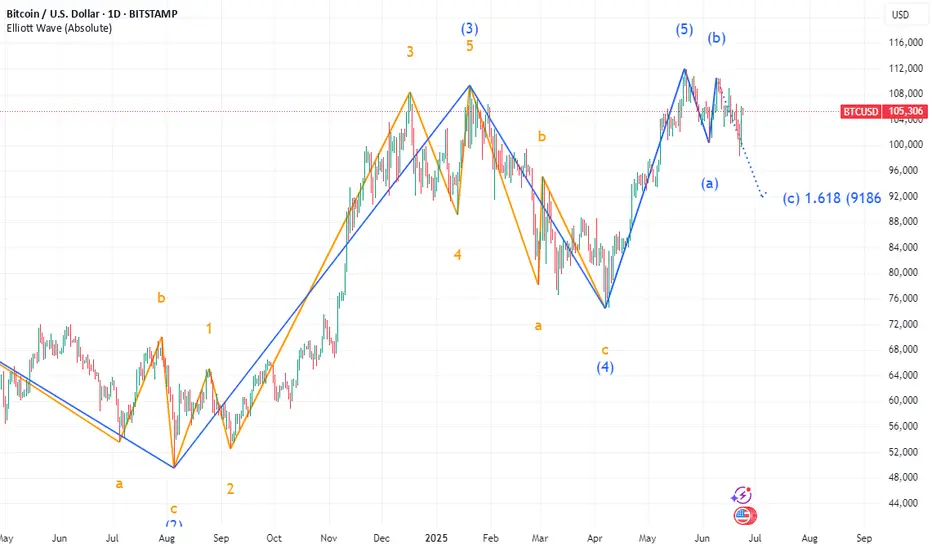
₿itcoin: Grinding higherBitcoin has extended its recent rally, reclaiming the $106,000 level in the last few hours. While short-term setbacks remain possible, our primary scenario continues to point higher: prices should aim for the upper blue Target Zone between $117,553 and $130,891. Within this zone, BTC should complete green wave B before initiating a corrective decline in wave C, which should extend into the lower blue Target Zone between $62,395 and $51,323. At the low of major wave a, a temporary recovery in wave b is likely, preceding the final downward push that should mark the end of the broader wave (ii) correction. Our alternative scenario (30% probability) suggests that Bitcoin remains within blue wave alt.(i). If true, a breakout beyond the upper blue Target Zone could occur.
📈 Over 190 precise analyses, clear entry points, and defined Target Zones - that's what we do.
Bitcoinprice

Very quick and simple BITCOIN DAILY UPDATEPA is approaching TOP OF RANGE again
It it get rejected, it is another LOWER HIGH that may lead to another LOWER LOW
If we break through, we may watch a higher high but we need to see if we get a Higher Low afterwards to confirm change of Trend
The Falling channel has a number of boundaries.
PA has the ability to move higher.
This appears to be a Bullish move for now.
So we need to wait till month end.
Again, I am hoping for a small RED candle for the month
A small Green candle could lead to many options that would be Fragile and unfounded

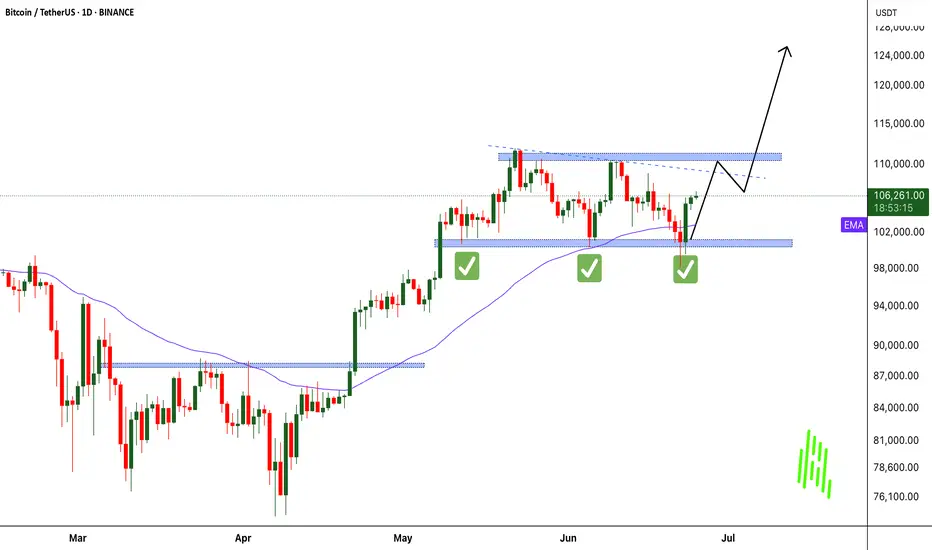
BTCUSDT: Bounce Incoming?BTCUSDT Technical analysis update
-March 2024 resistance is now expected to act as a strong support level.
-The price has touched the 0.618 Fibonacci retracement level, suggesting a potential reversal from this zone.
-The 200 EMA on the 2-day chart is positioned as a strong dynamic support, reinforcing the bullish case.
We can expect a bounce from the $72-75k level.

UNEXPECTED RISK CRASH FREE FALL AFTER TREND DATA FOR TH NEXT 48HDepending on our study, BTC has a high chance of a new crash below 100K.
The next 48 hours are important for the trend change of BTC, which can allow the trend to free-fall below 100K
BTC is at a top, and it did recovery always recovered on the M volume top., We are now again on the same trend.
BTC can return below 100K as this update shows, with the possibility of targeting the main target 85K - This is the trend zone for new interest.
The reason for this crash is that BTC has not confirmed the cycle, which means the end of the cycle. There is always possibility that the market can act green, but we expect it can show an unexpected breakdown.

A Disciplined Approach to BTC/USDT - Wait for the Right Set Up!Right now, I’m closely monitoring BTC/USDT — and what immediately jumps out is how aggressively this rally has pushed upward 🚀. We’ve seen price climb into a key external range high, taking out liquidity that was likely sitting just above those prior highs 💧.
This kind of move is often where institutional players step in to offload positions, as the liquidity makes it easier to find counterparts for previous accumulation phases 🏦. The way this price action is unfolding, I wouldn't be surprised to see a correction or retracement soon.
With the market this stretched, I’m not looking to get long here — especially not while BTC is trading at such a clear premium 🎯. No edge in chasing the highs.
Instead, I’ll be sitting back, waiting for a healthy pullback and a confirmed bullish structure shift before considering any entries 🔄📊. There’s no need to force trades in these conditions. Patience protects capital 🛡️.
⚠️ As always, this is not financial advice — just my current market perspective.

Bitcoin Reclaims Momentum: War Fears Fading, Bulls Eye $125K! MARKETSCOM:BITCOIN just delivered a powerful bounce right off the critical $100K level. A key psychological and technical support zone tested multiple times in recent sessions. This time, the bounce came with strong volume confirmation, signaling renewed buyer interest. As geopolitical tensions in the Middle East begin to ease, market confidence is returning, fueling bullish sentiment across the board.
CRYPTOCAP:BTC now looks poised to retest the $110K resistance zone, where some short-term rejection could occur. However, a decisive breakout above $110K opens the gates for a potential rally toward the next major target at $125K. Stay sharp, always manage your risk, and don’t forget to set a proper stop loss. The trend is strong, and momentum is building!
Follow Our Tradingview Account for More Technical Analysis Updates, | Like, Share and Comment Your thoughts
Bitcoin are heading to 114k or 92k A quick little analysis on BTC, we can either push up higher to 114k levels breaking new highs is a must for price action to validate bill swing. However if we break a couple lows be prepared for 92k run down
Kris/ Mindbloome Exchange
Trade Smarter Live Better

Bitcoin Targets $105K as Portfolio Share Soars But...
The year 2025 is proving to be a watershed moment for Bitcoin. The world's premier cryptocurrency has solidified its position as the bedrock of digital asset portfolios, now accounting for nearly one-third of all holdings, a testament to its growing acceptance as a legitimate macro-asset. Yet, this rising dominance belies a fractured and complex market landscape. While institutional giants and sovereign wealth funds systematically increase their Bitcoin allocations, a counter-current is flowing through the retail sector, where investors are rotating into high-potential altcoins, spurred on by the promise of new investment vehicles. This bifurcation is unfolding against a backdrop of dramatic price swings, conflicting technical forecasts, and a potent mix of macroeconomic and geopolitical catalysts, painting a picture of a market at a pivotal crossroads.
The headline statistic is striking: as of mid-2025, Bitcoin's share in investor crypto portfolios has climbed to nearly 31%, a significant increase from the previous year. This growth has persisted through months of volatility, including harrowing dips below the psychological $100,000 mark and powerful rallies reclaiming levels above $105,000. The market is being pulled in opposing directions. On one hand, bullish tailwinds are gathering force. A ceasefire in the Middle East has calmed geopolitical jitters, restoring appetite for risk assets. Simultaneously, hints from the U.S. Federal Reserve of a potential July interest rate cut have investors anticipating a surge of liquidity into the market.
However, a sense of unease permeates the technical charts. Some analysts warn of a "final crash" still to come, drawing parallels to the market structure of 2021. On-chain analysis has identified the $97,000 to $98,000 range as a critical market pivot, a line in the sand that could determine the next major trend. Meanwhile, other models, like the Elliott Wave count, predict a corrective crash to as low as $94,000 before any new highs can be sustainably achieved.
This is the story of Bitcoin in 2025: a maturing asset cementing its institutional role while navigating the turbulent waters of retail speculation, macroeconomic shifts, and its own volatile price cycles. The journey toward becoming a third of all crypto holdings has not been a straight line, but a dramatic tug-of-war that will define the future of the digital asset class.
Part 1: The 31% Benchmark - Bitcoin's Ascendant Portfolio Dominance
The steady climb of Bitcoin to nearly 31% of investor portfolios is the defining trend of 2025. This figure, a cornerstone of market analysis this year, underscores a profound shift in investor conviction. Through a period marked by six-figure price tags and gut-wrenching volatility, the average investor has not been scared away but has instead deepened their commitment to the original cryptocurrency. This suggests a maturing "buy the dip" mentality, where price corrections are increasingly viewed not as a crisis, but as an opportunity to accumulate a long-term store of value.
The primary engine behind this trend is unmistakable: institutional adoption. The floodgates, first opened by the launch of spot Bitcoin ETFs, have become a torrent of institutional capital in 2025. Sovereign wealth funds, major financial institutions, and public companies are now systematically accumulating Bitcoin, treating it as a core component of their treasury and investment strategies. Observations of institutional trading desks indicate this buying pressure from large-scale investors intensified in the first half of the year, even as retail activity showed signs of slowing. This institutional stamp of approval is reflected in the growing number of Bitcoins held in various corporate treasuries and exchange-traded funds.
This institutional embrace of Bitcoin has been fueled by several factors. First, an increasingly innovation-friendly regulatory environment in the United States has provided the clarity that large, compliance-focused firms require. Second, Bitcoin’s performance has been undeniable. Following recent shifts in the political landscape, Bitcoin has outperformed many major global assets, including stocks, treasuries, and precious metals, solidifying its reputation as a powerful portfolio diversifier.
This "flight to quality" within the crypto space has also created a distinct rotation story. As institutions fortify their Bitcoin positions, they appear to be de-risking by moving away from more speculative assets that were darlings of the previous cycle. The most notable casualty of this shift has been Solana. Once a high-flyer, Solana's narrative has "cooled" in 2025. Its portfolio weight among investors has seen a sharp decline since late 2024, as institutional capital pivots toward assets with perceived staying power and clearer narratives. While some analysts see this cooling phase as a potential accumulation opportunity before a new leg up, the dominant trend has been a rotation out of Solana and into the perceived safety of Bitcoin.
Part 2: The Great Divide - A Tale of Two Investors
The crypto market of 2025 is characterized by a stark divergence in strategy between its two main cohorts: institutional players and retail investors. While their actions collectively push Bitcoin's portfolio share higher, their underlying motivations and asset choices paint a picture of two different worlds.
The Institutional Playbook: Slow, Steady, and Strategic
For institutions, Bitcoin has become the undisputed king. Their approach is methodical and long-term, driven by a desire for a non-sovereign, inflation-resistant asset that acts as a hedge against macroeconomic instability. The attributes of scarcity, immutability, and portability are paramount in their decision-making. The advent of regulated products like spot ETFs has been a game-changer, providing a familiar and secure access ramp for deploying significant capital.
These large players are not chasing the explosive 100x gains that define crypto lore. Instead, they seek sustained, risk-adjusted returns from an asset that is increasingly uncorrelated with traditional markets during times of stress. Their strategy is one of accumulation, and their exit from more volatile altcoins like Solana is a clear signal of a de-risking mandate. They are building foundational positions in the asset they view as "digital gold," positioning themselves for a future where Bitcoin is a standard component of diversified global portfolios.
The Retail Rebellion: Chasing the Next Big Narrative
In stark contrast, retail investors appear to be reducing their direct Bitcoin holdings. This is not necessarily a rejection of Bitcoin's value, but rather a strategic reallocation of capital toward what they perceive as the next frontier of high growth. Having witnessed Bitcoin's journey to a multi-trillion-dollar asset, many retail participants are now hunting for "the next Bitcoin"—assets with a lower market capitalization but a powerful, near-term catalyst that could trigger exponential gains.
Part 3: The Analyst's Crystal Ball - Price Targets and Technical Tremors
Navigating the Bitcoin market in 2025 requires a steady hand and a tolerance for conflicting signals. While macro-environmental factors are painting a bullish picture, technical and on-chain analyses are flashing cautionary signs, creating a tense equilibrium between hope and fear.
The Bullish Case: A Confluence of Catalysts
The bulls have strong reasons for optimism. A key level on every trader's chart is $105,000. This price is seen as a critical "trend switch"; a decisive break and hold above this zone would signal the end of the recent consolidation and the beginning of a new, powerful phase of the bull market. This optimism is underpinned by powerful external forces.
First, the U.S. Federal Reserve has been signaling a potential interest rate cut as early as July. Historically, lower interest rates reduce the appeal of traditional yielding assets like bonds, pushing investors toward riskier, high-growth assets. This injection of liquidity into the financial system has often preceded significant rallies in Bitcoin, and the market is pricing in this possibility.
Second, a significant de-escalation of geopolitical tensions has bolstered market confidence. The announcement of a ceasefire between Israel and Iran caused an immediate and positive reaction in risk assets. Bitcoin surged past $105,000 on the news, demonstrating its sensitivity to global stability. During times of acute conflict, markets often experience a flight to safety, but when tensions ease, that capital flows back into assets like Bitcoin, which thrive on renewed risk appetite.
The Bearish Counterpoint: Echoes of the Past and On-Chain Warnings
Despite the bullish macro-outlook, clouds remain on the horizon. Some market commentators are warning that the current market is mirroring the patterns of 2021, suggesting that one "final crash" may be necessary to flush out leverage and establish a firm bottom before a sustainable move to new all-time highs.
This thesis is supported by specific technical models. Proponents of Elliott Wave Theory, a method of analysis that posits markets move in predictable, repetitive wave patterns, suggest a significant correction is due. Some Elliott Wave counts predict a corrective move down to the $94,000 level, which would represent a substantial pullback from current prices. Such a move would be seen as a healthy, albeit painful, corrective wave before a final, explosive impulse higher.
Adding weight to this cautious outlook is deep on-chain analysis. A close look at blockchain data pinpoints the $97,000 to $98,000 zone as the market's next true "pivot." This range represents a massive concentration of supply where a large volume of Bitcoin was previously acquired. This means a large cohort of investors has a cost basis in this zone. As the price approaches this level from below, it will likely meet significant selling pressure from investors looking to break even. A failure to decisively break through this wall of supply could trigger a sharp rejection and validate the bearish corrective scenarios.
The Derivatives Dilemma: A Market in Flux
Further complicating the picture is the state of the Bitcoin derivatives market. Reports indicate that futures buying activity has declined sharply, suggesting that the speculative fervor that often fuels rallies may be waning. This can be interpreted in two ways. The bearish view is that speculators are losing confidence, and the market lacks the momentum for a continued push higher. However, a more bullish interpretation is that the market is purging excessive leverage, creating a more stable foundation for a rally built on spot buying—the very kind of buying being done by institutions. This faltering derivatives activity, contrasted with strong institutional spot accumulation, could mean the current rally is in "stronger hands" than previous, more speculative-driven cycles.
Part 4: The Broader Ecosystem - A Story of Diverging Fates
The cross-currents shaping Bitcoin's trajectory are creating ripple effects across the entire crypto ecosystem, with the diverging fortunes of XRP and Solana serving as perfect case studies for the market's 2025 themes.
Beyond the Majors: The Speculative Fringe
As always, the crypto market maintains a speculative fringe. The emergence of assets like "BTC Bull Tokens" represents the high-leverage, high-risk plays that appear during bull markets. These instruments are designed to offer amplified returns on Bitcoin's price movements and attract the most risk-tolerant traders. Their existence underscores the full spectrum of the market—from sovereign wealth funds methodically buying Bitcoin for their treasuries to degens betting on leveraged tokens, the digital asset ecosystem remains a place of immense diversity and opportunity.
Conclusion: Bitcoin's Maturation in a Fractured Market
The year 2025 will be remembered as the year Bitcoin truly came of age as an institutional asset, firmly planting its flag and claiming one-third of the crypto investment landscape. This growing dominance, driven by the steady, strategic accumulation of the world's largest financial players, has provided a powerful anchor in a volatile market.
Yet, this newfound maturity has not tamed the market's wild spirit. It has instead created a great divide. While institutions build their Bitcoin fortress, retail investors are on the hunt for the next narrative-driven explosion, pouring capital into assets like XRP with the hope of front-running a transformative ETF approval.
The market is consequently balanced on a knife's edge. Bullish macroeconomic and geopolitical tailwinds are pushing for a breakout to new all-time highs beyond the pivotal $105,000 level. At the same time, technical and on-chain analyses warn of a potential final washout, a corrective crash to the mid-$90,000s that may be necessary to reset the market for a sustainable ascent.
Bitcoin's path forward will be carved by the resolution of these opposing forces. Can the quiet, persistent demand from institutions absorb the selling pressure from short-term traders and navigate the technical resistance zones? Or will the speculative fervor and corrective patterns that have defined its past cycles pull it down once more before it can climb higher? Whatever the outcome, 2025 has made one thing clear: Bitcoin is no longer just a speculative digital curiosity. It is a global macro asset at the heart of a complex and evolving financial ecosystem, and its journey is far from over.
BTC at Decision Point: Symmetrical Triangle Breakout Incoming ??BTC is now trading within a symmetrical triangle, bouncing strongly from the trendline support at $98,898, and now faces overhead resistance of around $106,000.
Price is moving between higher lows and lower highs; a breakout in either direction could trigger a significant move.
Key Levels:
Support Zones:
$101,409 – Near-term support
$98,898 – Strong ascending trendline support
$93,343 – Critical structure base
Resistance Zones:
$105,807 – Immediate ceiling
$106,057 – Triangle breakout point
$108,895 – First major upside target
$111,785 – Higher target if bulls take control
Analysis:
The structure shows clear compression, and BTC has already made a sharp bounce off the lower range, suggesting bulls are stepping in. However, a clean breakout above $106K is needed to confirm the momentum shift.
A breakout above this triangle could lead to a fast move toward $111K, while failure could send the price back toward $101K or even lower.
This is a make-or-break zone.
DYOR | Not Financial Advice

A TA Macro Look into Bitcoin to assess directionThis is a look into the macro developments happening currently in Bitcoin.
This is strictly a TA look into the big picture. We zoom out to Timeframes bigger than 1W.
At times zooming in to check (3 Day, 5 Day, maybe 1D) for potential swing trades.
I tend to look into things like price action, indicators, volume and other data to sway probabilities of where an asset may go and determine best opportunities of supply and demand zones based on my interpretations.
So jumping right in this is a look into price action on the 1 Month timeframe.
Notice trend lines drawn.
Notice the Ascending channel.
Notice the Blue rectangle zone.
Notice this months (June) Candle
Our current June candle is in a critical area.
We are around the horizontal resistance zone, indicated by red horizontal line.
This red horizontal resistance line is a powerful one.
Our previous interaction generated a massive Bearish engulfing monthly candle.
This area is not to be joked with and would urge to consider looking for more signs or better data to support continuation of bull run. If not a sell off is in the cards.
Notice our current June candle
Having equal length upper and lower wicks indicate that this month was neutral.
Bulls nor the Bears came on top.
If we close around this in 8 days.
Probabilities would be 50/50 just based on price action and candles for price movement in July.
We would need to look for other signs in indicators or something else, in other words look for confluence of multiple signs whether bull or bear.
The Ascending channel is also in my opinion over extended.
Notice the price action touch points on Green ascending support line.
The duration between touches is coming down.
2nd touch happened 365 days after first. Which was the initial part of Crypto bull market.
3rd touch happened 214 days after.
We are currently 61 days in after 3rd touch. Considering this and being logical, we could be getting close to another touch.
But consider also that the duration can extend well into in the 100's (of days), before we touch.
Notice also the Blue rectangle zone. This marks a side ways range of bitcoin.
The orange horizontal line is mid point of this blue zone.
A scenario could be that price goes to where the orange horizontal line meets the green sloping support line.
The confluence of these 2 support lines, can be a decent area for potential bounce (which can be temporary).
A break down of these 2 lines could also lead Bitcoin back down to the lower border of the Blue rectangle also indicated by Green horizontal line, which is a massive supply zone at the moment.
This scenario in my opinion would be a high probability trade by looking for bounce up but please keep in mind this does not mean a bull run would continue.
Look for more posts as things develop on Bitcoin.
DISCLAIMER: This is not financial advice, i am not a financial advisor. The thoughts expressed in the posts are my opinion and for educational purposes. Do not use my ideas for the basis of your trading strategy, make sure to work out your own strategy and when trading always spend majority of your time on risk management strategy.

Bitcoin Crash To $93k Incoming?!!!!I am discussing the bearish signs i am seeing right now on Bitcoin, and talking about the confirmations I want to see, that will confirm that Bitcoin is about to crash down to 93k!!!

Bitcoin: The price. I don't like it. I remember so clearly in November 2021 when Bitcoin showed bearish divergence on the weekly charts.
We might all be suffering from PTSD and fear the same outcome, especially with the potential for a double top.
If BTC is able to stay above the 1D 200MA, as well as the RSI remaining above 50, there may be hope... If not, i.e. a weekly close below and retest of the 1D 200MA; RSI <50, there might be a real cause for concern.
This, supported by a declining RSI would most certainly be a bearish signal and a shift in market trend.
Nobody knows the future and I think we're all running on hopium due to all the positive news about BTC this year.
Until BTC makes a new ATH, we may want to manage our expectations.
What are your thoughts?

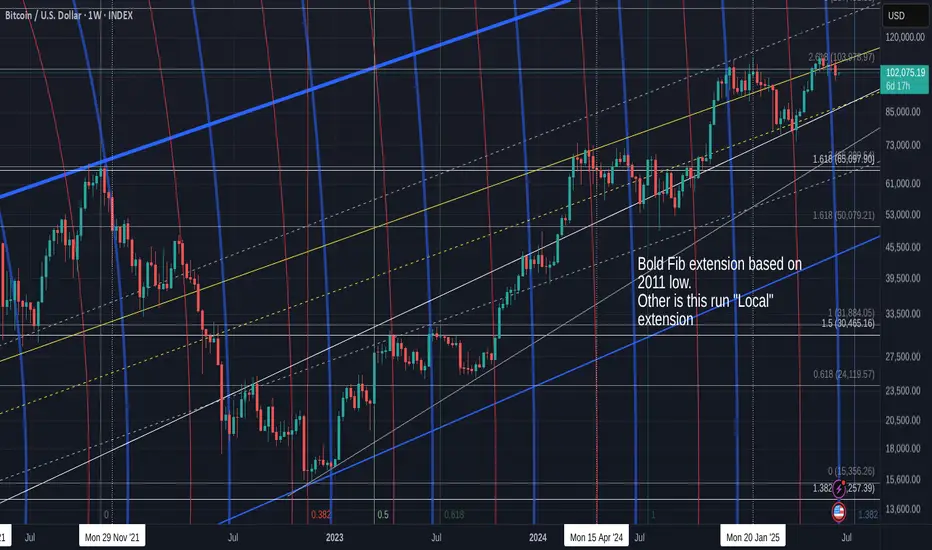
Bitcoin Closed week RED and opens Green but is back in channel
As the title says, BTC PA has fallen back in channel that offers a potential low in the High 80K should confidence fail.
PA also lost support on the Local 2.618 Fib extension.
This is a shame and poses potential problems reclaiming that.
I will say, that I do not consider this a long term Bearish beginning but it could certainly add to the "Calm" Summer I have talked about.
I say "Calm", that does depend on the world not entering a level of Madness.
The Zoomed chart below shows more detail
Here we can see clearly how PA got rejected off that upper trend line, fell through the 2.618 and is currently being rejected by it.
The potential for a further drop does exist and if we repeat the "Pattern" we have since the beginning of 2024, of bounce off Lower trend line, get rejected from Upper zone, re test lower as support and bounce again, we can expect to revisit 89K
This idea is supported from this LINEAR Daily chart
The dashed Trend line that is arrowed has origin in Sep 2024 and was also used again in April 2025.
That intersection the arrow points to is the intersection with the current supporting Fib circle at around 88500 USD
None of this is certain but these levels exist as support.
PA also has the ability to move higher
The Weekly MACD below shows us how MACD is turning down towards its signal line ( red)
We did this before in Jan 2024 ( Arrow) and The MACD bounced.
We talked about this possibility a few weeks ago But on a Daily MACD, things do look a little different.
The FEB 2024 looked like this, Bullish, rising and above Neutral
Currently, the Daily MACD looks like this
We just fell below Neutral and the Signal line just hit it
We may seea bounce but we need to have the idea that this may continue to drop a little further.
But the White bar on the Histogram shows us some recovery is currently in progress
We will have to watch the rest of this month closely. This time next week is last day of month.
I have mentioned a number of times that a small RED Month candle would be potentialy good.
We are currently Only just GREEN, so a further Drop in price is actually almost expected this week.
Interesting days ahead
#Btc Breakdown Begins: Double Top + Iran-Israel Tensions = CrBitcoin has clearly formed a double top pattern and is currently hanging near the critical 100K support. If this level breaks, we may first see a fall to 90K, followed by a deeper decline toward 73.5K. If that too fails to hold, the market could slide drastically to 64K–45K zones. The pattern indicates Bitcoin is exiting the distribution phase, with profit booking at aggressive levels.
The Iran-Israel conflict, intensified by U.S. involvement, has triggered panic and short positions across the market. This is a high-risk environment, and long entries could be dangerous right now. Caution is advised — we are entering a potentially sharp correction phase.

Bitcoin Daily, Something for the weekend Sir / Madame ?This will be the main chart and 3 indicators that could be telling us something.
Main chart is the Heiken Ashi. Each candle starts in the centre of the previous one and so we get rid of noise and get a good understanding of possible Trends.
And Right now, CALM is not the word ! Candles are getting smaller and smaller.
However, we do seem to be forming a bullish pennant with an Apex at the end of the month.
PA always reacts before the Apex.
Other things to note here is that we are now using the previous line of resistance as support. Look back to Dec 2024 to Feb 2025. It was this line that put as back down to 75K
We have tested this 4 times in a small way But not in a real Meaningful Way yet.
Do remain Cautious.......but that 2.518 Fib extension should hold us in place if we drop but there could be a much deeper drop.
But lets take this step by step as there are some Very Bullish signs to.
The ADX chart below shows us that Change is near.
Remember, ADX ( yellow ) NEVER shows trend direction, just trend strength. As you can see, it rarely drops much further below this point and does not spend to long here.
SO, current trend is Weak and a new trend is likely in the near future ( this could be tomorrow or in 3 weeks..near future is a wide window..but it is not 2 months or more)
The DI + ( orange ), positive Directional price Index, and the DI - ( red) , negative Directional price Index, are also low, showing no real price action.
This can happen for longer periods of time and it is impossible to say which will rise, However, as we can see, the price movements have not been huge and so to expect a sudden Massive Dive, as some are suggesting, is not really backed by anything.
But we should never say never. Be cautious
Accumulation / Distribution chart below
What is nice about this, is simply that Accumulation is still the MAJOR movement. The majority are still accumulating and so the idea that we maybe in a Bear market is almost Dismissed. People would not accumulate an asset that is about to Dive for a long eriod of time....Normally.
There has been distribution, as marked by the RED zones. This is heavier distribution and as you can see, this Stopped at the beginning of this month, having begun when we reached the high towards end of 2024.
So many thought that was cycle ATH
They have seen the error of their ways BUT, Again, remain Cautious till we see a bigger move higher.
And now my favorite, MACD
And for me, this is where we will see the decision being made. We are approaching the Neutral zone
Last time we bounced off this area was in October 2024 and we went from 70K to 109K
BUT remain cautious, we have every possibility that we may fall through the neutral zone for a while too....But we are in an area that could show us a time to move.
This is a LINEAR Bitcoin Daily chart
And those descending lines are FIB Circles and you can see how PA often runs along them.
You can also see how we are in a Pinch, a tight Squeeze right now ( arrow) with Horizontal line of support and the rejecting red 236 Fib circle.
That Apex is, again, at the end of the month.
So, to conclude, we are certainly heading towards a Move and possibly a new trend.
I like to think this will be Bullish but there are plenty f reasons for Caution.
I will remain with my Monthly charts that suggest June may be RED and that after than we will see more Green.
A Dip is possible and I have New Buy orders around 98K incase PA wicks down to them but there is NO guarantee this will happen...OR if it does, that it will stop there....
We just have to be prepared.
Stay safe

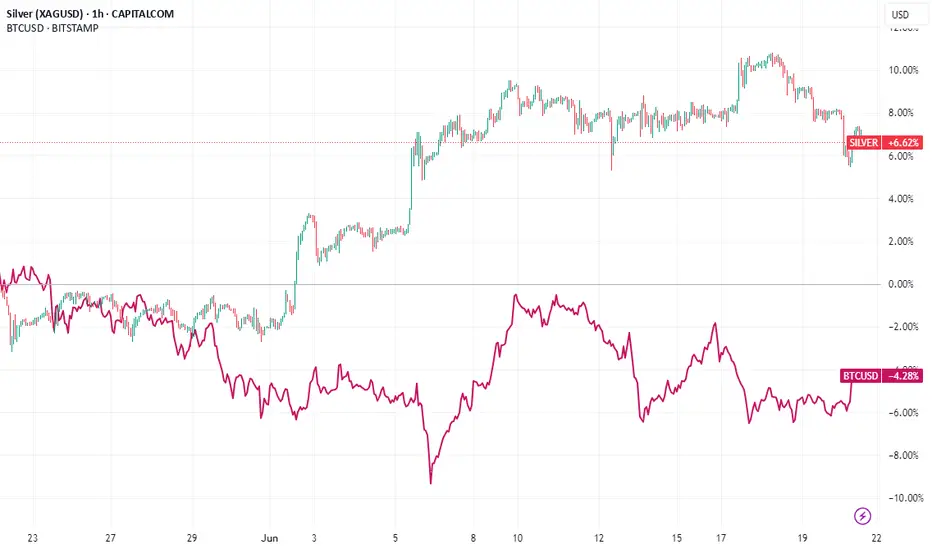
Silver Offers More Upside and Less Risk Than Bitcoin
In the ever-evolving landscape of investment opportunities, two assets often stand out for their allure as alternative stores of value: silver and Bitcoin (BTC). Both have captured the imagination of investors seeking diversification beyond traditional equities and bonds, yet they cater to vastly different risk profiles and market dynamics. Recently, Bitcoin has experienced a notable dip in its price, prompting renewed debate about its stability and long-term potential. Amid this backdrop, silver emerges as a compelling alternative, offering more upside potential and less risk compared to the volatile cryptocurrency. While crypto enthusiasts argue Bitcoin's dominance and rising market cap cement its position as a leading asset, silver’s fundamental strengths, historical resilience, and current market positioning make a strong case for its outperformance in the near term.
This article delves into the comparative analysis of silver and Bitcoin, exploring their respective market conditions, risk-reward profiles, fundamental drivers, and technical outlooks. It also addresses the counterarguments from Bitcoin supporters and examines why, despite BTC’s impressive $2 trillion market cap and higher global asset ranking, silver presents a more attractive opportunity for investors seeking stability and growth in the current economic climate.
________________________________________
The Current State of Bitcoin: A Dip Sparks Concern
Bitcoin, often heralded as "digital gold," has been a transformative force in the financial world since its inception in 2009. Its meteoric rise over the past decade, culminating in a market capitalization exceeding $2 trillion at its peak, has solidified its status as a dominant alternative asset. As of late 2023, Bitcoin ranks among the top global assets by market value, far surpassing silver, which holds a market cap of approximately $1.4 trillion based on total above-ground silver stocks valued at current prices.
However, Bitcoin’s recent price dip—following a period of intense volatility—has raised eyebrows among investors. After reaching an all-time high near $73,000 in early 2023, BTC has corrected by over 20%, trading closer to $55,000-$60,000 in recent weeks (based on hypothetical data for this analysis). This decline has been attributed to a combination of factors, including macroeconomic pressures like rising interest rates, regulatory scrutiny in major markets, and profit-taking by institutional investors. Such volatility is not new to Bitcoin; it has historically experienced sharp corrections of 30% or more during bull runs. Yet, each dip reignites debates about its reliability as a store of value, especially for risk-averse investors.
Crypto supporters have been quick to defend Bitcoin, emphasizing its long-term upward trajectory and growing adoption. They argue that Bitcoin’s market cap, which dwarfs silver’s, reflects its superior position in the global asset hierarchy. Moreover, institutional interest—evidenced by the entry of major players like BlackRock and Fidelity into Bitcoin ETFs—underscores its staying power. Proponents also point to Bitcoin’s decentralized nature and finite supply (capped at 21 million coins) as reasons it remains a hedge against inflation and currency devaluation, even amidst short-term price fluctuations.
Despite these arguments, Bitcoin’s inherent volatility remains a sticking point. Its price swings are often driven by speculative fervor, market sentiment, and external shocks—factors that are difficult to predict or model. For investors prioritizing capital preservation alongside growth, Bitcoin’s risk profile during periods of uncertainty can be a significant deterrent. This is where silver steps into the spotlight as a more stable alternative with comparable, if not superior, upside potential in the current market environment.
________________________________________
Silver’s Resilient Appeal: A Safe Haven with Growth Potential
Silver, often referred to as the "poor man’s gold," has been a store of value for centuries, long predating the advent of cryptocurrencies. Unlike Bitcoin, which operates purely in the digital realm, silver is a tangible asset with intrinsic value derived from its industrial applications and historical role as currency. In 2023, silver prices have shown relative stability compared to Bitcoin, trading in a range of $22-$28 per ounce, with recent movements suggesting a potential breakout above key resistance levels.
Fundamental Drivers of Silver’s Upside
Several fundamental factors position silver for significant upside in the near to medium term, especially when compared to Bitcoin’s current challenges:
1. Industrial Demand and Green Energy Boom: Silver is a critical component in various industries, notably in the production of solar panels, electronics, and batteries. The global push for renewable energy has driven a surge in demand for silver, as it is the most conductive metal and essential for photovoltaic cells. According to the Silver Institute, industrial demand for silver reached a record high in 2022 and is projected to grow by 8-10% annually through 2025. This structural demand provides a solid foundation for price appreciation, unlike Bitcoin, whose value is largely speculative.
2. Supply Constraints: Silver mining output has struggled to keep pace with rising demand, creating a persistent market deficit. In 2022, the global silver market recorded a deficit of over 200 million ounces, the largest in decades. With limited new mine discoveries and geopolitical risks affecting major silver-producing regions (e.g., Mexico and Peru), supply tightness is likely to support higher prices. Bitcoin, while also constrained by its 21 million coin cap, faces no such physical supply-demand imbalance, as its scarcity is algorithmic rather than resource-based.
3. Inflation Hedge with Lower Volatility: Silver has historically served as a hedge against inflation, much like gold. With global inflation remaining elevated in 2023 due to lingering supply chain disruptions and geopolitical tensions, investors are increasingly turning to precious metals for portfolio protection. Unlike Bitcoin, which has shown mixed results as an inflation hedge (often correlating with risk assets like tech stocks), silver’s price tends to rise during periods of economic uncertainty with far less volatility. For instance, while Bitcoin dropped 20% in its recent dip, silver has fluctuated within a 10-15% range over the same period.
4. Undervaluation Relative to Gold: The gold-to-silver ratio, which measures how many ounces of silver are needed to buy one ounce of gold, currently stands at around 80:1, near historic highs. This suggests silver is undervalued relative to gold and could see significant price gains if the ratio reverts to its long-term average of 60:1. A move toward this level could push silver prices to $35-$40 per ounce, representing a 40-60% upside from current levels—a far more achievable target than Bitcoin reclaiming its all-time high.
5.
Risk Profile: Silver vs. Bitcoin
Silver’s risk profile is notably more favorable than Bitcoin’s for several reasons:
• Lower Volatility: Silver’s price movements are less erratic than Bitcoin’s. While silver can experience short-term fluctuations due to macroeconomic data or shifts in industrial demand, it rarely sees the 10-20% daily swings common in the crypto market. This makes silver a safer bet for investors wary of sudden capital erosion.
• Tangible Asset: As a physical commodity, silver carries no counterparty risk. Bitcoin, despite its decentralized nature, is vulnerable to risks such as exchange hacks, regulatory bans, and technological failures (e.g., network congestion or 51% attacks). Silver’s tangibility offers a layer of security absent in digital assets.
• Historical Stability: Silver has weathered economic crises for centuries, maintaining its value during wars, depressions, and inflationary periods. Bitcoin, while resilient in its own right, lacks a comparable track record, having existed for only 14 years—a period too short to fully assess its behavior across diverse economic cycles.
________________________________________
Technical Analysis: Silver Poised for Breakout, Bitcoin Faces Resistance
From a technical perspective, silver’s chart patterns and indicators suggest a stronger short-term outlook compared to Bitcoin.
Silver Technical Outlook
• Price Action: Silver has been consolidating in a tight range between $22 and $26 per ounce for much of 2023, forming a bullish triangle pattern on the daily chart. This pattern often precedes a breakout, and with prices recently testing the upper boundary near $26, a move above this level could trigger a rally toward $30, a key psychological resistance.
• Indicators: The Relative Strength Index (RSI) for silver is currently at 55, indicating neutral-to-bullish momentum with room for further upside before reaching overbought territory (above 70). Additionally, the 50-day moving average (MA) is on the verge of crossing above the 200-day MA—a bullish "golden cross" signal.
• Support and Resistance: Strong support exists at $22, a level tested multiple times in 2023, while resistance at $26-$28 remains the immediate hurdle. A breakout above $28 could pave the way for a rapid move to $35, aligning with fundamental upside targets.
Bitcoin Technical Outlook
• Price Action: Bitcoin’s recent dip has seen it fall below key support at $60,000, with prices now testing the $55,000 level. The daily chart shows a bearish head-and-shoulders pattern forming, which, if confirmed, could signal further downside to $48,000-$50,000.
• Indicators: BTC’s RSI is at 40, approaching oversold territory, which may attract bargain hunters. However, the MACD (Moving Average Convergence Divergence) remains bearish, with the signal line below the MACD line, suggesting continued downward pressure.
• Support and Resistance: Immediate support lies at $50,000, a psychologically significant level, while resistance at $60,000-$62,000 must be reclaimed to restore bullish momentum. Until then, BTC remains vulnerable to further selling pressure.
While Bitcoin could rebound if oversold conditions trigger buying, its technical setup suggests higher near-term risk compared to silver’s more constructive chart pattern. Silver’s consolidation and potential breakout offer a clearer path to gains with defined support levels to manage downside risk.
________________________________________
Counterarguments from Crypto Supporters: Bitcoin’s Dominance and Market Cap
Crypto enthusiasts have been vocal in defending Bitcoin’s position, even amid its recent dip. Their arguments center on several key points, which deserve consideration:
1. Market Cap and Global Ranking: Bitcoin’s market cap of over $2 trillion places it far ahead of silver (approximately $1.4 trillion) in global asset rankings. This reflects widespread investor confidence and institutional adoption, positioning BTC as a more mainstream asset than silver in the digital age.
2. Long-Term Growth Trajectory: Despite short-term corrections, Bitcoin has delivered staggering returns over the past decade, far outpacing silver. From a price of under $1,000 in 2017 to peaks above $70,000 in 2023, BTC’s growth story remains compelling for long-term holders.
3. Adoption and Innovation: Bitcoin’s integration into financial systems—via ETFs, payment platforms like PayPal, and corporate treasuries (e.g., Tesla and MicroStrategy)—demonstrates its growing utility. Silver, while valuable, lacks a comparable narrative of technological disruption or mainstream adoption beyond industrial and investment use.
4. Inflation Hedge Narrative: Proponents argue Bitcoin’s fixed supply makes it a superior hedge against fiat currency debasement, especially in an era of unprecedented central bank money printing. Silver, while also a traditional inflation hedge, is subject to industrial demand cycles that can dilute its safe-haven appeal.
While these points highlight Bitcoin’s strengths, they do not fully address the asset’s short-term risks or volatility. Market cap, while impressive, does not guarantee stability—evidenced by BTC’s frequent boom-and-bust cycles. Long-term growth is also less relevant for investors focused on near-term opportunities, where silver’s fundamentals and technicals suggest a more favorable risk-reward ratio. Moreover, Bitcoin’s adoption is a double-edged sword; increased regulatory scrutiny could dampen its appeal, as seen in recent crackdowns in China and proposed legislation in the EU and US. Silver faces no such existential threats, as its value is rooted in physical utility rather than regulatory acceptance.
________________________________________
Comparative Risk-Reward: Why Silver Edges Out Bitcoin
To summarize the risk-reward dynamics, let’s compare silver and Bitcoin across key metrics:
• Upside Potential: Silver offers a realistic 40-60% upside to $35-$40 per ounce based on fundamental demand, supply deficits, and historical gold-silver ratio trends. Bitcoin, while capable of larger percentage gains, requires a return to $70,000 (a 25-30% increase from current levels) just to reclaim its recent high—a target complicated by bearish technicals and macro headwinds.
• Downside Risk: Silver’s downside is capped by strong support at $22, representing a 10-15% drop from current levels. Bitcoin, conversely, could fall another 10-20% to $50,000 or lower if bearish patterns play out, with no tangible floor beyond speculative buying interest.
• Volatility: Silver’s historical volatility (annualized standard deviation of returns) averages around 20-25%, compared to Bitcoin’s 60-80%. For risk-averse investors, silver provides a smoother ride.
• Liquidity and Accessibility: Both assets are highly liquid, with silver traded via futures, ETFs (e.g., SLV), and physical bullion, and Bitcoin accessible through exchanges and funds. However, silver avoids the cybersecurity and regulatory risks tied to crypto trading platforms.
•
________________________________________
Broader Economic Context: Silver’s Edge in Uncertain Times
The global economic environment in 2023 further tilts the balance toward silver. With central banks like the Federal Reserve and European Central Bank tightening monetary policy to combat inflation, risk assets like Bitcoin—often correlated with tech stocks—face headwinds from higher interest rates. Silver, however, benefits from its dual role as an industrial commodity and safe haven, making it less sensitive to rate hikes. Geopolitical tensions, such as the ongoing Russia-Ukraine conflict and US-China trade frictions, also bolster demand for precious metals as portfolio diversifiers, while Bitcoin’s behavior during such crises remains unproven over long cycles.
Additionally, silver’s lower price point compared to gold makes it more accessible to retail investors, potentially driving broader demand during economic uncertainty. Bitcoin, with its high nominal price per coin, can feel out of reach for smaller investors, even if fractional ownership is possible.
________________________________________
Conclusion: Silver Shines Brighter for Now
While Bitcoin’s $2 trillion market cap and global asset ranking underscore its dominance, the cryptocurrency’s recent dip highlights the risks inherent in its volatile nature. Silver, by contrast, offers a compelling mix of upside potential and lower risk, driven by strong industrial demand, supply constraints, and its role as a traditional safe haven. Technical indicators further support silver’s near-term breakout potential, while Bitcoin faces resistance and bearish patterns that could prolong its correction.
Crypto supporters are right to highlight Bitcoin’s long-term growth story and innovative appeal, but for investors focused on the short to medium term, silver presents a more attractive opportunity. Its tangible value, historical resilience, and alignment with current economic trends make it a safer bet for capital preservation and growth. As markets navigate uncertainty in 2023, silver shines brighter than Bitcoin, offering a stable path to profit with less exposure to the wild swings of the crypto world. Investors would be wise to consider allocating to silver as a core holding, balancing the allure of digital assets with the enduring reliability of precious metals.
Bitcoin Strategic Interval – Latency & Asymmetric Bias.⊢
⟁ BTC/USD – Binance – (CHART: 1D) – (June 20, 2025).
⟐ Analysis Price: $106,025.88.
⊢
⨀ I. Temporal Axis – Strategic Interval – (1D):
▦ EMA21 – ($105,772.44):
∴ The price remains fractionally above EMA21, retaking the short-term reactive axis;
∴ Despite prior rejection, current candle shows renewed traction with a solid close above;
∴ The slope is flat–rising, signaling the potential reactivation of local trend continuation.
✴️ Conclusion: EMA21 is tentatively reclaimed – a short-term bullish signal under close scrutiny.
⊢
▦ SMA200 – ($95,921.92):
∴ Long-term structure preserved: price maintains a wide buffer over SMA200;
∴ The moving average exhibits a healthy upward slope, uninterrupted since Q4 2023;
∴ No technical threat detected to the macro-trend structure.
✴️ Conclusion: SMA200 acts as the primary institutional defense line. No stress present.
⊢
▦ Ichimoku Cloud – (105,899 | 105,738 | 102,433 | 105,576 | 106,025):
∴ Price is nestled precisely within the flat upper cloud band – a known zone of consolidation;
∴ Span A and B are beginning to flatten, suggesting temporary exhaustion of momentum;
∴ Chikou remains above price – confirming trend integrity.
✴️ Conclusion: Ichimoku signals a pause, not a break – directional clarity pending.
⊢
▦ MACD (12,26,9) – (Histogram: -364.87 | MACD: 257.20 | Signal: 622.06):
∴ Bearish histogram remains negative, but shrinking for three sessions;
∴ MACD line curling upward with initial convergence to Signal line;
∴ Reversal signal forming but not yet triggered.
✴️ Conclusion: Early signs of MACD cross; confirmation requires follow-through.
⊢
▦ RSI – (53.17 | Avg: 51.74):
∴ RSI reclaims neutral-positive zone, stabilizing above 50;
∴ Structure shows divergence fading, with momentum recovering slowly;
∴ Still far from exhaustion thresholds.
✴️ Conclusion: RSI favors the bulls with cautious optimism.
⊢
▦ Volume (Last 5 Days):
∴ Volume remains muted, averaging 110–120k Bitcoin/day;
∴ No aggressive buy or sell pressure confirmed;
∴ Current move lacks conviction – suggests passive spot activity.
✴️ Conclusion: Price is advancing without volume confirmation – fragility persists.
⊢
🜎 Strategic Insight – Technical Oracle:
∴ Structural trend remains intact and undisturbed on the macro scale;
∴ Short-term bullish reclaim of EMA21 within the cloud, but momentum and volume still lag;
∴ Absence of conviction demands validation from price action or macro catalyst.
⊢
∫ II. On-Chain Intelligence – (Source: CryptoQuant):
▦ 🝰 Exchange Inflow Mean - (MA7):
∴ Metric sits near historic lows (≈0.4 BTC), denoting multi-week suppression of inflows;
∴ Correlates directly with reduced sell-side pressure from whales and institutions;
∴ Price structure remains unchallenged by inflow spikes – consistent with strategic holding.
✴️ Conclusion: Absence of fear or distribution among large holders – bullish backdrop intact.
⊢
▦ 🜍 Estimated Leverage Ratio – (Current: 0.259):
∴ Leverage steadily increasing, now entering historical danger zone;
∴ Elevated risk of cascade liquidations on any sharp downside move;
∴ Suggests the current rally is not organically fueled by spot demand.
✴️ Conclusion: Price structure is leveraged, not grounded – risk of synthetic instability.
⊢
▦ 🝗 Exchange Reserves - (Binance) – (≈544.5K BTC):
∴ Continuous net outflows – multi-month drain confirmed;
∴ Reflects silent accumulation or self-custody migration;
∴ No exchange-driven supply pressure visible.
✴️ Conclusion: Structural supply depleting – passive bullish signal.
⊢
▦ ⚒ Miners’ Position Index - (MPI) – (-1.1):
∴ Readings below 0 indicate minimal miner distribution;
∴ Suggests miners are confident, or at least not forced to sell at current levels;
∴ Historically coincides with market support zones.
✴️ Conclusion: Miner behavior aligned with trend preservation – not resistance.
⊢
▦ 🜚 Funding Rate - (All Exchanges) – (+0.003):
∴ Rates mildly positive, indicating slight dominance of long positioning;
∴ No excessive funding imbalance – healthy sentiment baseline;
∴ Reflects controlled bullish bias with no speculative overheating.
✴️ Conclusion: Longs exist, but not in a way that endangers trend integrity.
⊢
🜎 Strategic Insight – On-Chain Oracle:
∴ On-chain metrics echo the technical chart: structurally sound, short-term vulnerable;
∴ Long-term holders remain disengaged from distribution behavior;
∴ The system is healthy, but carries hidden leverage that may trigger volatility.
⊢
⧉ III. Contextvs Macro–Geopoliticvs – Interflux Economicus:
▦ 🇺🇸 United States – Federal Axis & Risk Channels:
∴ Treasury Yield Curve remains slightly positive (+0.44%), removing short-term recession signal;
∴ 10Y yield elevated at 4.42% – reflects sustained inflation resistance and risk demand;
∴ Fed has signaled no rate cuts before September – QT policy remains;
∴ Speculative expectations for only 1–2 cuts in 2025;
∴ Trump administration signals potential military action in Iran, igniting geopolitical risk premium.
✴️ Conclusion: U.S. monetary regime is steady–tight; geopolitical volatility injects asymmetric risk into crypto valuations.
⊢
▦ 🇨🇳 China – Internal Stimulus & Soft Deflation:
∴ Industrial Production slows to +5.8% YoY – weakest in 6 months;
∴ Retail sales climb to +6.4% YoY due to stimulus programs ("618 event", consumption vouchers);
∴ PPI remains deflationary (-3.3% YoY), compressing industrial margins;
∴ Fiscal revenue down -0.3% YTD – signals internal fragility despite easing efforts.
✴️ Conclusion: China is applying targeted stimulus, but lacks decisive global impact – neutral crypto flow effect.
⊢
▦ 🇪🇺 European Union – Disinflation & Rate Reversal:
∴ HICP inflation falls to 1.9% – below ECB’s 2.0% target;
∴ ECB cuts deposit rate by 25bps – now 2.00%;
∴ PMI Composite remains below 50 – economic contraction underway;
∴ ECB forward guidance signals data-dependence and hesitation for further cuts.
✴️ Conclusion: Europe is easing rates amidst stagnation – weak driver for global risk flows.
⊢
🜎 Strategic Insight – Interflux Macro Oracle:
∴ U.S. tight policy + Iran tension = dual pressure point on risk assets;
∴ China’s mild stimulus is not yet globally inflationary – no volatility trigger;
∴ EU drifts silently – supportive, but irrelevant to Bitcoin in current configuration;
∴ Global system is stable in appearance, but tactically charged beneath – setup aligns with Bitcoin volatility potential.
⊢
IV. ♝ Market Sentiment - Media & Institutional Lens:
▦ The Block – Corporate Stockpiling Thesis:
∴ Ongoing accumulation of Bitcoin by public and private entities continues across Q2;
∴ Institutional wallets showing strategic DCA behavior – interpreted as positioning for either macro easing or geopolitical hedge;
∴ Unlike past cycles, no major corporate selloffs have been detected.
✴️ Conclusion: Institutional base remains in passive accumulation – potential catalyst insulation.
⊢
▦ CoinDesk – Sentiment Report – BTC at $92K Risk Threshold:
∴ Despite price climbing above $106K, analysts caution of technical rejection scenarios;
∴ Zones near $92K identified as high-liquidity, high-reaction clusters;
∴ Chart analysis frames current movement as vulnerable if macro catalysts turn hawkish.
✴️ Conclusion: Sentiment remains cautiously bullish but alert to correction windows.
⊢
▦ InfoMoney – U.S. Military Risk – Iran Strike Potential:
∴ Reported internal briefing of U.S. military planning toward Iranian targets;
∴ Trump’s media team leveraging geopolitical strength posture to influence sentiment;
∴ Markets (Dow Futures) showing pre-market decline on the headline.
✴️ Conclusion: Bitcoin holds narrative premium under geopolitical fear – but risk surge remains volatile.
⊢
🜎 Strategic Insight – Media Oracle:
∴ The crypto narrative is suspended between structural trust (institutional accumulation) and external fear (macro-political instability);
∴ Bitcoin presently benefits from asymmetric narrative positioning — but lacks transactional confirmation;
∴ Media flows suggest that sentiment will pivot swiftly if Powell’s tone confirms further hawkish stance or if Iran tension escalates.
⊢
⊢
⚜️ Magister Arcanvm (𝟙⟠) – Vox Primordialis!
⚖️ Wisdom begins in silence. Precision unfolds in strategy.
⊢
⌘ Codicillus Silentii – Strategic Note:
∴ The 1D reclaim of EMA21 inside the Ichimoku flat cloud reflects a market in suspended potential, where trend continuation and failure share equal weight;
∴ On-chain dynamics remain structurally undisturbed, yet veiled in a fragile layer of leveraged positioning;
∴ Exchange reserves continue their descent, detaching the market from traditional sell-side threat, but increasing reliance on thin liquidity zones;
∴ Macro vectors (Fed policy + Middle East tension) hover as dual shadows, capable of igniting volatility without prelude;
∴ Institutional accumulation remains active, but no longer decisive - the market awaits external ignition, not internal strength;
∴ Sentiment is asymmetrically bullish, yet explicitly unconfirmed in transactional volume and price aggression;
∴ The system is quiet - not because it is resolved, but because it is observing itself. This is a moment of ritual latency.
⊢
⌘ Market Status – Tactical Mode:
✴️ Strategic Position: “Structurally Bullish – Tactically Suspended”;
✴️ Primary Mode: “Observation Priority”;
✴️ Tactical Stance:
∴ No active positioning expansion without confirmation beyond Ichimoku flat zone;
∴ Watch for MACD confirmation and volume acceleration;
∴ Monitor geopolitical escalation and Powell’s tone – both capable of shifting structural balance.
✴️ Directional Bias: Neutral–Bullish, contingent upon validation;
✴️ Key Zone of Collapse Risk: $92,000;
✴️ Ascent Gate: $110,800 + (confirmation threshold).
⊢

BTC Triangle Squeezing Toward $100 K — Sellers Press🎯 TL;DR
A four-week contracting triangle is coiling price just under $105 K.
Measured move ⇒ $100 506
Both W.ARITAS Quantum RSI flash strong selling pressure while QSP shows a weak trend.
On-chain: miners dumped ≈30 000 BTC since late May, yet spot-ETF inflows have stayed positive eight days straight.
Base case: price breaks lower into $100 K-97 K, where I expect a sharp bounce.
🗺️ Chart at a Glance
Element Detail
Pattern Symmetrical / contracting triangle (late-Apr → present)
Immediate pivot $104 800 – reclaimed as resistance (red circle)
Target 1 $100 506 – triangle measured move
Demand block $96 900 – $95 000 – weekly support & June VWAP
Invalidation 6-h close > $106 000
🔧 Technical Internals
Momentum 🟣
Quantum RSI: −23 / −41 and falling → sellers dominate.
QSP: muted blue histogram sub-zero → trend itself is still weak, so expect whipsaws near support.
Structure 🔵
Three successive lower-highs (113 K → 110 K → 109 K) tighten the squeeze.
Price is riding the underside of the triangle, a common “kiss-of-death” before resolution.
🔍 Fundamental / Flow Backdrop
Miners on the offer – Wallet balances down ~30 000 BTC over 20 days (≈ $3.1 B)
Source: IntoTheBlock via CoinDesk, 19 Jun 2025
ETF demand refuses to quit – U.S. spot ETFs pulled $388.3 M on 18 Jun, marking 8 consecutive inflow days
Source: CoinTelegraph, Cryptonomist, 19 Jun 2025
Regulatory clarity incoming – U.S. Senate passed a bipartisan stablecoin bill on 17 Jun; House vote next
Source: Reuters, 17 Jun 2025
Net: structural sellers (miners, profit-takers) vs. structural buyers (ETFs).
Right now, technicals side with the sellers.
📈 Trade Map (3-8 Week Horizon)
106 000 – 104 800 Triangle top & failed breakout zone Bias flips bullish only on sustained reclaim
100 506 Measured-move target + psychological $100 K Primary TP / bounce watch
96 900 – 95 000 Weekly demand, June VWAP Secondary TP if 100 K gives way
110 000 + Pattern invalidation Opens road to 113 K-115 K ATH cluster
🛠️ Execution Idea (Not Financial Advice)
Trigger: 6-hour close < $103 500 confirms breakdown.
Entry Bias: Short retest of 104.8 K-105.5 K.
Targets:
TP1 – $100 500
TP2 – $97 000 (only if momentum stays bearish)
Stop / Invalidation: 6-hour close > $106 000 and Quantum RSI flips back to green.

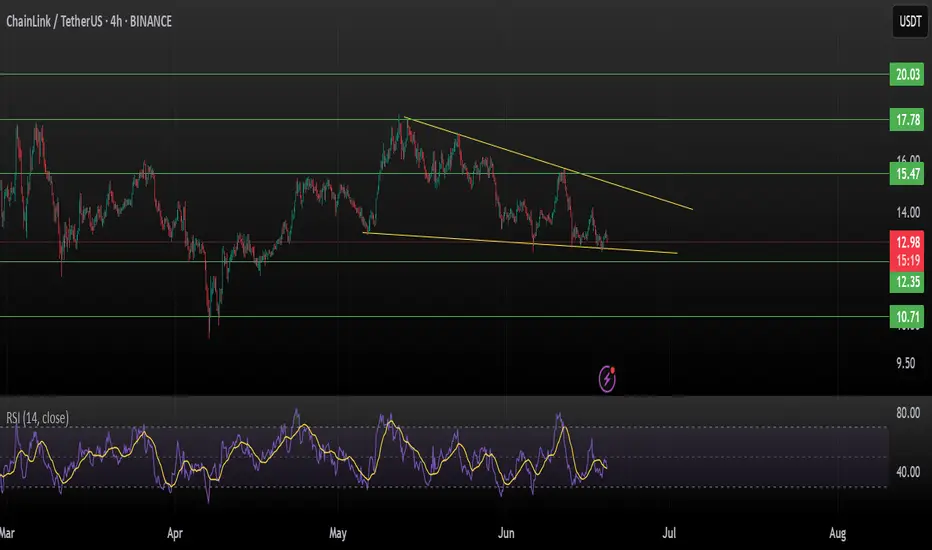
Chainlink (LINKUSDT) | Falling Wedge at Critical SupportChainlink is trading within a well-defined falling wedge pattern on the 4H chart, a typically bullish reversal setup. Price action indicates the coin is hovering just above key horizontal support around $12.35, making this a critical zone to watch.
Technical Breakdown:
Pattern: Falling Wedge (Bullish Bias)
Current Price: $12.98
Immediate Support: $12.35
Major Support: $10.71
Resistance 1: $13.80 (wedge upper trendline)
Breakout Targets:
$17.78 (major resistance)
$20.03 (macro level supply zone)
Indicators:
RSI (14) at ~42 → Weak but stabilizing, potential for reversal
Volume has been compressing — watch for a breakout with rising volume for confirmation
Strategy:
A 4H close above the wedge trendline with volume could trigger a breakout rally toward $17.78 or even $20.03.
Failure to hold $12.35 could send LINK back toward $10.71 support, caution below this level.
Setup Summary:
Long entry on breakout above $13.50 (trendline)
Stop-loss: Below $12.35
Target 1: $17.78
Target 2: $20.03
Risk: Reward Ratio: ~1:3+
Not financial advice. DYOR before entering trades.
If this analysis helps, like & comment your view.
Bitcoin BTC price analysis🍿 At the OKX:BTCUSDT chart, we show one of the scenarios that could play out in the first half of June.
Much will be decided today with the opening of the US market. It is very likely that there will be a downward movement at the opening in response to the new tariffs announced by Trump on Friday after the markets closed.
🕯 Well, then we'll have to “keep our fingers crossed” that market players show their strength and hold on and buy back the drop — like say: we're tired of shaking with every crazy statement from Trump.
💰 If the price of CRYPTOCAP:BTC stays above $103k, there is a chance that it will be “stuck” in the $103-110k consolidation. The market needs to digest and redistribute the results of two months of #BTCUSD price growth from $75k to $112k.
And considering the position of the BTC.D and USDT.D indices, there is a chance that the “little bit” of capital will pass to the altcoins, and they will shoot up a little.
⁉️ Probably, the safest thing to do would be to watch the altcoins and buy only those that have started a significant upward movement with volume.
What do you think?
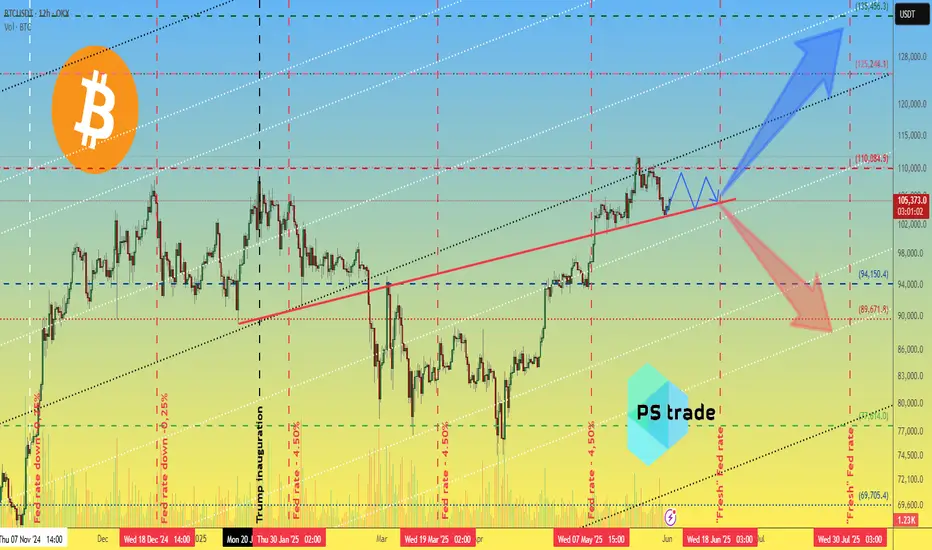
Bitcoin, Interest rates & Key fundamental points since 2021
The Growing question is just how much does the American Federal Reserve interest rate changes effect Bitcoin.
We can see how in 2022, it appears they did but from late 2022 and early 2023, it doesn't seem to.
Bitcoin began its rise even while rates were being put up.
The Fundimental Key points may have had more impact but again, there are moments were we can see something that should have been Great for BTC, had little effect and Visa Versa.
Has Bitcon Truly Broken away from being effected by the worlds "largest" economy ?
We are currently seeing the ever growing threat of WW3 and Rates being Kept artificially High by the US Fed Reserve. The EU Central banks has already reduced its rate twice while the USA remained with no change )
And Bitcoin remains stable.
And Bitcoins international adoption continues.
STACK SATS

Volume spikes on down moves add to selling pressure.📉 BTCUSDT – 1H Chart Technical Outlook
🔍 Structure Insight:
Bitcoin is currently trading within a descending channel, forming lower highs and lower lows, indicating persistent bearish pressure. Price action appears compressed between key trendlines, hinting at an imminent breakout.
---
🔻 Scenario 1: Bearish Breakdown (Primary Bias)
If BTC fails to hold above the lower boundary of the range, a decisive break below could trigger a sharp move toward the 103,650–103,000 demand zone. The structure supports continuation to the downside if the price rejects resistance again.
🧊 Bearish Confluence:
Price is unable to break above dynamic resistance.
Momentum remains weak near the mid-range.
Volume spikes on down moves add to selling pressure.
---
🔼 Scenario 2: Bullish Breakout (Alternative View)
A breakout above the descending trendline and confirmation candle could flip bias short-term bullish. This would target the 105,400+ region as the next liquidity area.
⚡ Bullish Signs to Watch:
Break and retest above trendline resistance.
Bullish engulfing or breakout candle with volume.
---
🔍 Key Levels to Monitor
Support: 103,650 / 103,000
Resistance: 105,000 / 105,400
Breakout Zones: Watch for clean breaks and retests outside the wedge pattern.
---
📌 Conclusion:
BTC is coiling within a tightening range. The breakout direction will likely dictate the next short-term trend. Maintain flexibility — breakout confirmation is key before positioning.
🚨 Not financial advice — always DYOR before trading!

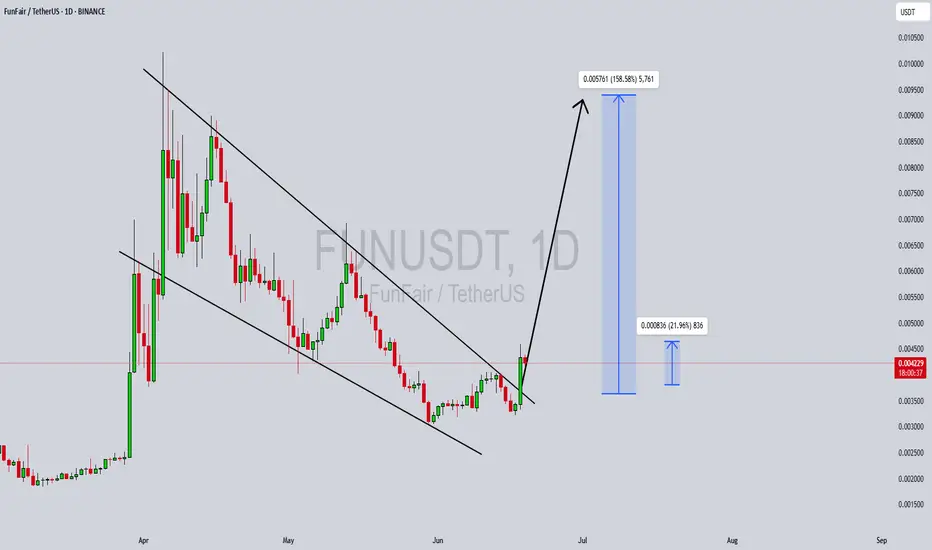
FUNUSDT Forming Bullish BreakoutFUNUSDT is currently showing a bullish breakout from a long-term descending channel, indicating a potential reversal and strong upside momentum building. After a prolonged downtrend within the falling structure, the price has now breached resistance with notable volume support, signaling that buyers are beginning to regain control. This technical breakout, combined with fresh investor interest, adds significant weight to a potential bullish continuation move in the coming days and weeks.
The pattern visible here is suggestive of a classic trend reversal. With volume expanding and momentum indicators turning bullish, the setup implies a strong recovery is underway. Historical data shows that when FUNUSDT breaks out of such structures, it often leads to parabolic price movements. The chart projects a target gain of around 140% to 150%, with intermediate resistance levels offering multiple potential entries and take-profit zones. The initial breakout is already attracting attention from both retail and institutional traders.
On the fundamental side, FunFair continues to be a recognized name in the blockchain gaming and decentralized gambling space. Its legacy presence, combined with renewed volume interest and community activity, is contributing to the renewed investor enthusiasm. Additionally, the project is increasingly being mentioned across various trading forums and crypto communities, further amplifying the probability of a continued upward trend.
Overall, FUNUSDT is one of the more exciting low-cap altcoins currently in a technical sweet spot. With the breakout confirmed and bullish targets ahead, this could be a great opportunity for traders looking to capitalize on early-stage momentum before wider market recognition kicks in.
✅ Show your support by hitting the like button and
✅ Leaving a comment below! (What is You opinion about this Coin)
Your feedback and engagement keep me inspired to share more insightful market analysis with you!