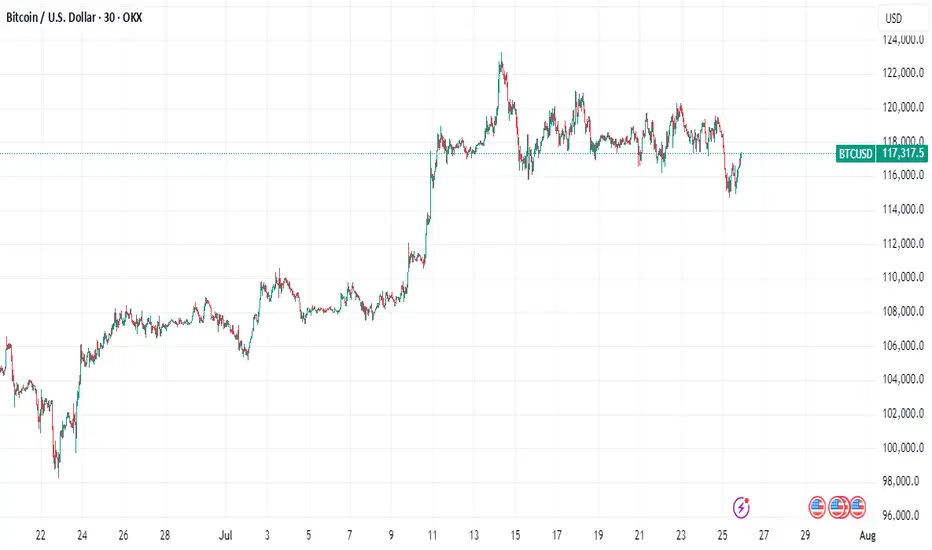
BTC Full Analysis WHERE ARE WE HEADING ???Good afternoon
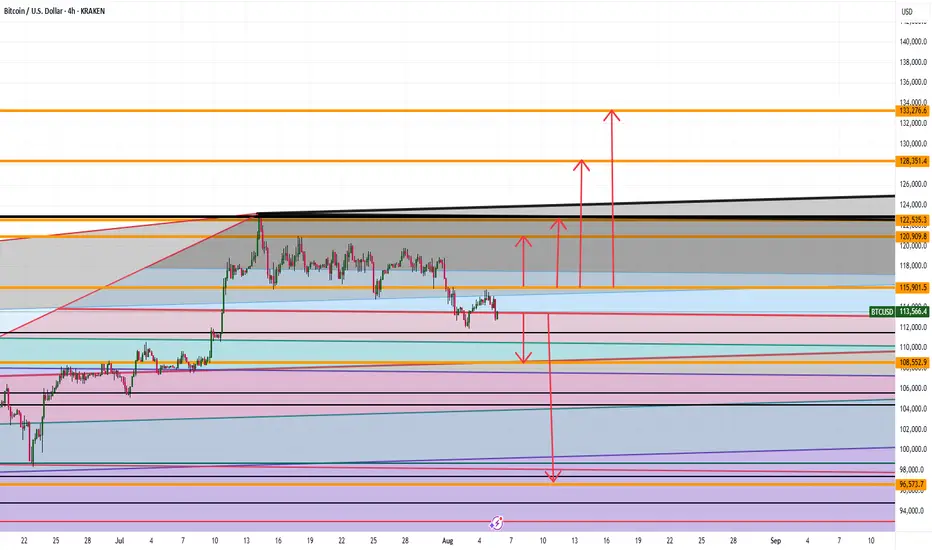
SO currently with BTC we see the following:
Bullish:
If we can stay and hold above 115,900 then 120K, 122K, 128K and 133K makes sense
BEARISH:
If we close and hold under 113K levels then we can see 108, and 96K levels being hit
What do you think ? Comment Below
Trade Smarter Live Better
Kris
Bitcoinpriceprediction
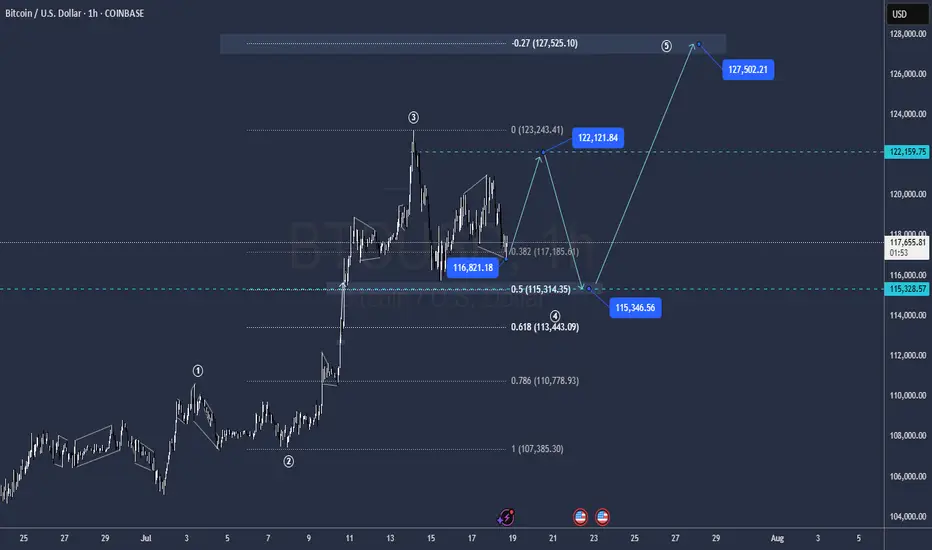
BBTCUSD long setupBTCUSD long setup
Entry - 111900.0
Stop Loss - 110670.0
Target - 123120.0
Risk Reward - 1:9.12

Analytics: Market Outlook and Predictions
📈 WHAT HAPPENED?
Last week, US President Donald Trump once again "shook up" the financial markets.
The report published by the White House was received positively and contributed to the recovery of the Bitcoin price. But soon after, new import duties were introduced, which changed the short-term trend of the first cryptocurrency to a downward one. Unfortunately, no one is immune to FUD.
The local minimum was recorded at $112,000, after which the price rebounded slightly, but didn’t reach the key zone of $110,000-$107,000 (accumulated volumes).
💼 WHAT WILL HAPPEN: OR NOT?
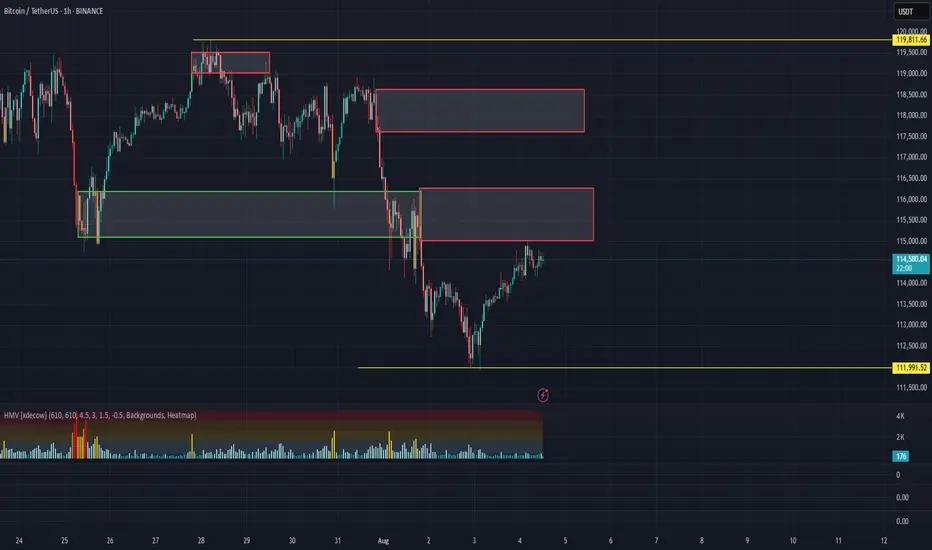
Currently, buyer activity remains weak, with significant volumes concentrated above the current price, and no active demand at the local lows. Another wave of sales is likely from the $115,000-$116,300 zone to the formed low of $112,000.
On the other hand, wave analysis shows the weakening of sellers. The market has already absorbed the last wave of sales, and there was a break on the hourly timeframe. With the growth of buying volumes, a rebound to the nearest volume resistance is possible. However, we’ll most likely not be able to do without strong sales, and we’re highly likely to see Bitcoin at $110,000.
Buy Zones:
$110,000–$107,000 (accumulated volume)
Sell Zones:
$117,600–$118,600 (accumulated volume)
$115,000–$116,300 (mirror volume zone)
📰 IMPORTANT DATES
Macroeconomic events that we’re following this week:
• Tuesday, August 5, 13:45 (UTC) — publication of the business activity index (PMI) in the US services sector for July;
• Tuesday, August 5, 14:00 (UTC) — publication of the US Non-Manufacturing Purchasing Managers' Index (ISM) for July;
• Thursday, August 7, 11:00 (UTC) — announcement of the UK interest rate decision for August;
• August 7, Thursday, 11:30 (UTC) — publication of the Bank of England's letter on UK inflation;
• August 7, Thursday, 12:30 (UTC) — publication of the number of initial jobless claims in the United States for August.
*This post is not a financial recommendation. Make decisions based on your own experience.
#analytics
Waiting Patiently for this bias on BTCUSDWaiting for BTC to come clear the liquidity as shown in my chart setup, then I'm entering for a BUY following the overall trend.
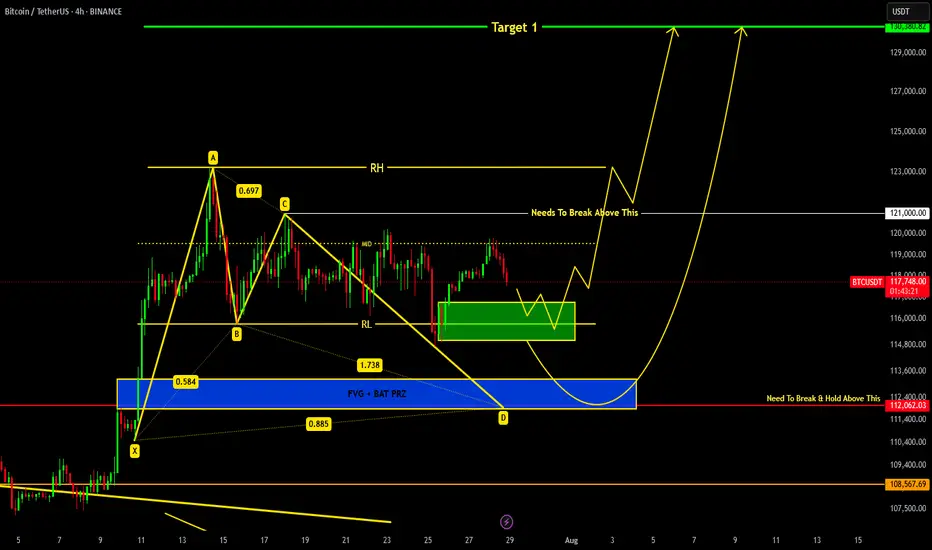
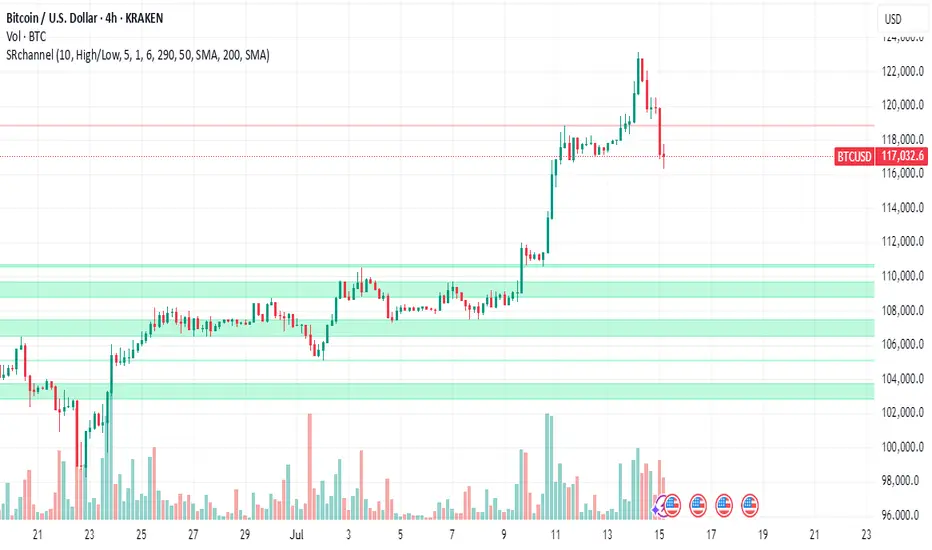
BITCOIN Current Update !!!we are heading towards support region around 116.8k-115k from where we can expect a reversal.
If price breaks down 115k level then a bat harmonic pattern is also forming which indicates it's PRZ at 113-112k region...
Remember 121k is key level which needs to be broken in order to remain bullish !!!
Why Bitcoin's Bull Run Hits a WallBitcoin's Bull Run Hits a Wall: A Deep Dive into the $115K Correction, Record Leverage, and the Battle for Market Control
A sudden and violent tremor has shaken the cryptocurrency market to its core. After a period of quiet range-bound trading, Bitcoin has decisively moved from consolidation to a sharp correction, plunging below the critical $116,000 support level and briefly touching $115,000. The abrupt downturn triggered a "bloodbath for crypto longs," liquidating hundreds of thousands of traders and wiping out nearly $600 million in leveraged positions. Yet, as the dust settles, a complex and contradictory picture emerges. While institutional sell-offs and cascading liquidations paint a grim short-term picture, record-high open interest, significant liquidity grabs, and bullish on-chain signals suggest the long-term uptrend may be far from over. This article delves into the anatomy of the crash, the forces that fueled it, and the fierce battle between bearish catalysts and bullish undercurrents that will define Bitcoin's next move.
Part 1: The Anatomy of the Correction - From Sideways to Sell-Off
For weeks, Bitcoin's price action was characterized by consolidation, a phase where an asset trades within a defined range, reflecting market indecisiveness. After a strong upward trend that pushed Bitcoin to new highs above $120,000, this period of sideways movement was seen by many as a healthy pause before the next leg up. However, this placid surface masked building pressure. The transition from this consolidation phase to a full-blown correction was swift and brutal.
A market correction is defined as a rapid price change, often a decline of at least 10% but less severe than a crash, that disrupts an asset's prevailing trend. The recent tumble below $116,000 fits this description perfectly. The sell-off was not a gradual slide but a violent dislocation, breaking through established support levels and triggering a wave of panic.
This dramatic shift was exacerbated by several key factors. On-chain data revealed that a significant institutional player, Galaxy Digital, unleashed a massive sell-off, reportedly moving billions in Bitcoin to exchanges. This sudden injection of supply into the market acted as a powerful catalyst, overwhelming buy-side pressure and initiating the downward price spiral. The market's reaction was immediate, with the price slicing through the psychological support at $116,000 and heading towards the next major liquidity zone around $115,000.
Part 2: The Cascade - A $600 Million Bloodbath for Leveraged Traders
The speed of the price drop had a devastating impact on the derivatives market, a space where traders use borrowed funds to amplify their bets on price movements. The sudden downturn resulted in one of the most significant liquidation events in recent memory, with 213,729 traders liquidated for a total of nearly $600 million over a 24-hour period.
What is a Liquidation?
In crypto futures trading, liquidation is the forced closure of a trader's position by an exchange. This happens when a trader can no longer meet the margin requirements for their leveraged position, meaning their collateral is insufficient to cover their mounting losses. For example, a trader using 20x leverage on a $1,000 position controls $20,000 worth of Bitcoin. However, a mere 5% price move against them can wipe out their entire initial capital, triggering a liquidation.
The recent event was a "bloodbath for crypto longs," meaning traders who had bet on the price of Bitcoin increasing were the primary victims. As the price fell, these long positions became unprofitable, and once they crossed their liquidation price, exchanges automatically sold the collateral on the open market to cover the losses.
This process created a deadly feedback loop known as a liquidation cascade. The first wave of forced selling from liquidated longs added more downward pressure on the price. This, in turn, pushed the price down further, triggering the liquidation of another set of long positions whose liquidation prices were slightly lower. This domino effect—where liquidations cause lower prices, which in turn cause more liquidations—is what transforms a standard price dip into a violent market crash. This automated, rapid chain reaction is a hallmark of the highly leveraged and volatile crypto markets.
Part 3: The Fuel for the Fire - Open Interest Reaches a Record $44 Billion
Underpinning this massive liquidation event was an unprecedented buildup of leverage in the market, best measured by a metric called Open Interest (OI). Open Interest represents the total number of active or unsettled futures contracts in the market. It’s a measure of the total capital and number of positions committed to the derivatives market, distinct from trading volume, which counts both opened and closed positions. An increase in OI signifies that new money and new positions are entering the market, often leading to higher volatility.
In a stunning development, as Bitcoin's price began to plunge, the total Open Interest surged to a new all-time high of $44 billion. This unusual divergence—where price falls while open interest rises—suggested that a significant number of new short positions were being opened to bet against the market, while many longs remained trapped, hoping for a reversal. This created a powder keg of leverage.
Further fueling this was a notable surge on the world's largest crypto exchange. On-chain data showed that traders added 10,000 Bitcoin worth of open interest to the BTCUSDT perpetual contract on Binance alone. This single-day surge in open interest on a key trading pair signaled a massive influx of speculative capital.
High open interest acts as fuel for volatility. With so many leveraged contracts open, any sharp price movement can trigger the kind of cascading liquidations that were just witnessed. The record-breaking $44 billion in open positions meant the market was more susceptible than ever to a violent deleveraging event.
Part 4: The Big Players - A Tale of Two Whales
The recent market turmoil cannot be fully understood without examining the actions of its largest participants: the whales and institutions. Their movements often create the initial waves that retail traders are forced to navigate.
On the bearish side, the primary catalyst for the sell-off appears to be Galaxy Digital. The digital asset financial services firm was observed moving tens of thousands of Bitcoin, worth billions of dollars, to centralized exchanges. These flows were reportedly part of a larger liquidation of holdings from a dormant "Satoshi-era" whale, with Galaxy acting as the intermediary to facilitate the sale. By strategically offloading such a massive amount, even if through over-the-counter (OTC) desks to minimize initial impact, the sheer volume of sell pressure eventually spilled into the public markets, triggering the correction. The firm's subsequent withdrawal of over a billion dollars in stablecoins from exchanges further suggests a large-scale profit-taking or strategic de-risking maneuver.
However, this institutional selling pressure is contrasted by a powerful bullish undercurrent. Even as the market reeled, other large players were making bold, long-term bets. Reports surfaced of a significant whale bet on Bitcoin reaching a staggering $200,000 by the end of the year. This dichotomy highlights the deep division in market sentiment. While some large entities are taking profits or repositioning, others view this correction as a prime accumulation opportunity, demonstrating unwavering conviction in Bitcoin's long-term trajectory.
This clash of titans—the institutional seller and the long-term bullish whale—defines the current market structure. The price is caught in a tug-of-war between immediate, heavy supply and deep-pocketed, long-term demand.
Part 5: Reading the Tea Leaves - A Healthy Reset or the Start of a Bear Market?
While the headlines scream "bloodbath" and "crash," a deeper analysis of market mechanics and on-chain data offers a more nuanced perspective. Several key indicators suggest that this brutal pullback, while painful, may be a healthy reset rather than the beginning of a sustained bear market.
Argument 1: The Pullback Remains Within Normal Volatility Range
Bitcoin is notoriously volatile, and sharp corrections are a historical feature of its bull markets. Drawdowns of 30-40% have been common pit stops during previous bull runs. While a drop from over $120,000 to $115,000 is significant, analysts point out that such moves are not out of character for the asset. Historically, major cycle-ending bear markets have seen drawdowns exceeding 75-80%. In contrast, mid-cycle corrections serve to wipe out excess leverage, shake out weak hands, and build a more sustainable foundation for future growth. This event, though severe for leveraged traders, may fall into the category of a standard, albeit sharp, bull market correction.
Argument 2: A Necessary Liquidity Grab
Sophisticated market analysis suggests the plunge below $115,000 was a textbook liquidity grab. This is a maneuver, often initiated by large players or "smart money," where the price is intentionally pushed to a level where a high concentration of stop-loss and liquidation orders are known to exist. By triggering these sell orders, large buyers can absorb the resulting liquidity to fill their own large positions at more favorable prices before reversing the market direction. The area just below a key psychological level like $115,000 is a prime location for such a maneuver. The rapid dip followed by a stabilization could indicate that this was not a panic-driven crash, but a calculated move to hunt liquidity before the next leg up.
Argument 3: Bullish Signals from Spot Markets and On-Chain Data
While the derivatives market was in turmoil, other indicators flashed bullish signals. One analyst pointed to a strong correlation between surges in Binance's spot trading volume and subsequent price upswings. Recently, Binance's share of the spot market volume surged significantly, a move that has historically preceded rallies. High spot volume indicates genuine buying and selling activity, as opposed to the paper bets of the futures market, and can signal strong underlying demand.
Furthermore, key on-chain metrics suggest the long-term bullish scenario remains intact. Analysts highlighted that Bitcoin's price found support near the "Realized Price" for short-term holders, indicating that recent buyers were not panic-selling in large numbers. Other metrics, such as those showing that major long-term holders are retaining their assets despite record prices, paint a picture of underlying market strength that contrasts with the short-term speculative chaos.
Conclusion: A Market at a Crossroads
The dramatic plunge to $115,000 was a multifaceted event, a perfect storm of institutional profit-taking, extreme leverage, and the brutal mechanics of the crypto derivatives market. For the over-leveraged trader, it was a catastrophe. For the long-term investor, it may have been a fleeting opportunity.
The market now stands at a critical juncture, defined by conflicting forces. On one hand, the specter of institutional selling, exemplified by the Galaxy Digital offload, looms large. The record-high open interest, though slightly diminished after the liquidations, still represents a significant amount of leverage that could fuel further volatility.
On the other hand, the arguments for a bullish continuation are compelling. The idea that the crash was a calculated liquidity grab, the historical precedent for sharp bull market corrections, the strength in spot market volumes, and the conviction of long-term holders all suggest that the core uptrend is resilient. The whale betting on a $200,000 price by year-end serves as a potent symbol of this underlying confidence.
The coming weeks will be crucial in determining which of these forces will prevail. The battle between the short-term pressures of deleveraging and the long-term thesis of accumulation will be fought in the charts and on the blockchain. While the bloodbath for longs served as a stark reminder of the perils of leverage, it may have also been the violent, necessary purge required to cleanse the market and pave the way for a more sustainable ascent.
Bitcoin Weekend ForecastIts in the middel of wave 4 correction, impulses are tradeable
Levels Highlighted in the chart
Bitcoin Hits New Highs: Is The Institutional Money Here To Stay?Bitcoin Hits New Highs, Gains Stability and Scale in Its Institutional Era: Will It Last?
From a volatile and often misunderstood outsider, Bitcoin has embarked on a remarkable transformation, evolving into what many now see as a foundational financial layer. This new era is not fueled by the fleeting whims of retail hype, but by the calculated, long-term strategies of professional capital. The steady influx of institutional investors is profoundly reshaping Bitcoin's character, taming its notorious volatility and broadening its accessibility to everyday individuals. This seismic shift begs the question: is this newfound stability and scale a permanent feature of the financial landscape, or a transient phase in Bitcoin's tumultuous history?
The Dawn of a New Epoch: The Institutional Stampede
For years, the narrative surrounding Bitcoin was one of a grassroots monetary experiment, a digital curiosity championed by cypherpunks and early internet adopters. Wall Street remained a skeptical spectator, wary of the asset's wild price swings, its lack of regulatory clarity, and its disruptive potential. However, Bitcoin's unyielding resilience and its core value proposition of a decentralized, finite digital asset gradually wore down this institutional resistance. The floodgates did not just creak open; they were blown apart with the regulatory approval of spot Bitcoin Exchange-Traded Funds (ETFs). This landmark decision marked a clear and decisive tipping point, a formal invitation for mainstream finance to embrace the world's first cryptocurrency.
This regulatory green light has had a profound and cascading impact. It has, in a single stroke, legitimized Bitcoin in the eyes of the most conservative financial establishments. More importantly, it has provided a familiar, regulated, and highly accessible entry point for a vast and previously untapped ocean of capital. Exposure to Bitcoin is no longer confined to specialized crypto-native platforms, which often carried a steep learning curve and perceived security risks. Now, it can be seamlessly integrated into the traditional investment portfolios that millions of people rely on, managed through their existing brokerages, pension funds, and even insurance products. This growing wave of institutional adoption is not merely inflating Bitcoin's price; it is fundamentally anchoring it more firmly within the global economy, weaving it into the very fabric of the system it was once designed to challenge.
The numbers illustrating this shift are staggering. In a remarkably short period, spot Bitcoin ETFs have amassed well over $138 billion in assets. This figure is not static; it represents a dynamic and growing pool of capital, reflecting sustained institutional interest. Registered Investment Advisors (RIAs), who manage the wealth of millions of Americans, along with sophisticated hedge funds and forward-thinking pension funds, represent a growing share of this investment. These are not speculative day traders but entities with long-term horizons and rigorous due diligence processes. Their participation signals a deep conviction in Bitcoin's future.
This institutional embrace extends far beyond the realm of ETFs. Major corporations have continued their aggressive accumulation of Bitcoin, viewing it as a treasury reserve asset superior to cash. This trend of corporate and institutional adoption is a key driver of Bitcoin's maturation, lending it a newfound sense of legitimacy and stability that was unimaginable just a few years ago. The current market cycle is thus being defined not by the frenetic energy of individual retail investors, but by the methodical and powerful currents of professional capital.
Taming the Beast: Volatility in the Institutional Age
One of the most significant and welcome consequences of this institutional influx has been the taming of Bitcoin's infamous volatility. For most of its history, Bitcoin's price chart resembled a dramatic mountain range, with breathtaking peaks and terrifying valleys. This volatility was its defining characteristic and its biggest barrier to mainstream acceptance. Institutional capital, however, operates on a different wavelength. With its longer time horizons and more systematic, data-driven approach, it behaves differently from the often emotionally-driven retail market.
While individual investors are more prone to panic-selling during sharp price dips or piling in during euphoric rallies, large institutions are more likely to employ disciplined strategies like dollar-cost averaging. They see price corrections not as a reason to panic, but as a buying opportunity. This behavior provides a stabilizing force, creating a floor during downturns and tempering the irrational exuberance of market tops.
This shift in market dynamics is evident in the flow of funds into the new financial products. These investment vehicles have frequently seen strong net inflows during price corrections, with major asset managers absorbing billions in capital even as retail sentiment soured. This institutional buying pressure acts as a powerful buffer, moderating the extreme price swings that have historically characterized the Bitcoin market.
While Bitcoin's volatility remains higher than that of traditional assets like gold or global equities, its trajectory is one of marked and consistent decline. This decline is a natural consequence of its growing market capitalization. As the total value of the network expands, the relative impact of new capital inflows or outflows is diminished, leading to smoother price action.
Interestingly, Bitcoin's volatility has at times converged with, and even fallen below, that of some mega-cap technology stocks, which themselves can exhibit significant price swings. This convergence is making traditional investors take a closer look, as the risk-reward profile of Bitcoin becomes more palatable and understandable. Historically, investors have been well-compensated for taking on Bitcoin's volatility, with its risk-adjusted returns often outperforming major stock indices over multi-year periods.
From Digital Gold to a Financial Base Layer: An Evolving Narrative
For much of its existence, Bitcoin has been championed as "digital gold." This narrative is powerful and intuitive. Like gold, it has a finite, predictable supply. It is decentralized, meaning no single entity can control it or create more of it at will. And it is censorship-resistant, offering a store of value outside the traditional financial system. This narrative has been a potent driver of adoption, particularly among those seeking a hedge against inflation, currency debasement, and geopolitical uncertainty.
However, the increasing stability brought about by institutional investment is fostering a new and complementary narrative: Bitcoin as a potential medium of exchange and, more broadly, as a foundational settlement layer for the global financial system. Lower volatility is a crucial prerequisite for any asset to function effectively as a currency. When prices are relatively stable, merchants and consumers can transact with confidence, knowing the value of their money will not drastically change overnight.
The development of Layer 2 solutions, most notably the Lightning Network, is a critical piece of this puzzle. These protocols are built on top of the Bitcoin blockchain and are designed to enable faster, cheaper, and more scalable transactions. They address the primary technical hurdles that have hindered Bitcoin's use for everyday payments, such as coffee or groceries. As this technological infrastructure continues to mature and gain adoption, Bitcoin's utility beyond a simple store of value is poised to expand significantly.
Furthermore, Bitcoin's historically low correlation with traditional assets like stocks and bonds makes it an exceptionally valuable tool for portfolio diversification. In a world where asset classes are becoming increasingly interconnected, Bitcoin offers a unique return stream. Adding even a small allocation of Bitcoin to a traditional 60/40 portfolio can potentially enhance returns over the long term without a commensurate increase in overall risk. This diversification benefit is a key part of the thesis for many institutional investors.
Navigating the Market's Pulse: Price, Psychology, and Predictions
As Bitcoin navigates this new institutional era, the question on every investor's mind is: where does the price go from here? The recent surge to new all-time highs above the $123,000 mark has been met with a mix of bullish enthusiasm and cautious optimism. After reaching this peak, the market saw a natural retreat, with bulls pausing for a breath and prices consolidating. The price action has been dynamic, with a fresh increase starting above the $120,000 zone before finding temporary resistance and trading near the $118,500 level. This kind of price discovery, including breaks below short-term bullish trend lines, is characteristic of a market absorbing new information and establishing a new support base.
Technical analysis suggests that the current rally may have further to run. Having decisively broken through key psychological and technical resistance zones, some analysts see a clear path toward $135,000 or even $140,000 in the medium term. The price trading well above key long-term moving averages confirms that the underlying momentum remains strongly bullish.
However, a closer look at market sentiment and on-chain data reveals a more nuanced and perhaps even more bullish picture. Despite the record-breaking prices, the market has yet to enter the state of "extreme greed or euphoria" that has characterized the absolute peaks of previous bull cycles. Key metrics that track the profitability of long-term holders remain below the "euphoria" zone, suggesting that the smart money is not yet rushing to take profits. This could indicate that the current rally, while impressive, is still in its early or middle phases, with more room to grow before reaching a cyclical top. A delay in the full-blown bull market euphoria could ultimately push Bitcoin higher than many expect.
Of course, the market is not a one-way street. The spike to $123,000 was followed by an increase in Bitcoin flowing into exchanges, a potential sign of short-term profit-taking and a cooling-off period. Even large, strategic players may take profits during rallies. The news of Bhutan's sovereign wealth fund strategically unloading a portion of its holdings is a prime example. While these sales can introduce short-term selling pressure, they are also a healthy part of a functioning market. The fact that inflows, even at the peak, were just a fraction of those seen in earlier parts of the year suggests that the selling pressure is not yet overwhelming.
The Sustainability of the Institutional Era: A Critical Analysis
The institutionalization of Bitcoin is undoubtedly a paradigm shift, but its long-term sustainability is not a foregone conclusion. While the current trend is one of increasing adoption and stability, there are several factors that could challenge this new status quo and must be considered by any serious investor.
One potential risk is the concentration of Bitcoin in the hands of a few large institutions. While this brings stability in the short term, it also introduces a potential point of centralization in a decentralized system. If a handful of major asset managers were to simultaneously decide to sell their holdings—perhaps due to a change in their own internal risk models or a major macroeconomic shock—it could trigger a significant market downturn. Such a move would likely be exacerbated by retail investors following the lead of these financial giants.
Regulatory risk also remains a significant and unpredictable concern. While the approval of spot Bitcoin ETFs in the United States was a major step forward, the global regulatory landscape is a complex and evolving patchwork. Any future crackdowns, unfavorable tax treatments, or restrictive regulations in major jurisdictions could dampen institutional enthusiasm and hinder further adoption. The path to full regulatory clarity is likely to be long and fraught with challenges.
Furthermore, the narrative of Bitcoin as an inflation hedge has yet to be definitively proven across all possible economic conditions. While it has performed well during recent periods of high inflation and monetary expansion, its correlation with risk assets means it can also be sensitive to economic downturns and tightening financial conditions. A prolonged period of global recession or stagflation could test its resilience as a store of value in new and unexpected ways.
Conclusion: A Maturing Asset in an Evolving World
Bitcoin has come an immeasurably long way from its obscure beginnings as a niche digital currency for a small community of technologists. The influx of institutional capital has ushered in a new era of stability, accessibility, and legitimacy. The launch and wild success of spot Bitcoin ETFs has been the primary catalyst, providing a regulated and familiar on-ramp for a vast pool of professional money that is reshaping the asset's very DNA.
This institutional embrace is about far more than just price appreciation; it is fundamentally changing the character of Bitcoin. Its volatility, while still present, is on a clear downward trend, making it a more viable contender as both a global store of value and a neutral settlement network. The long-held dream of Bitcoin as a foundational layer of a new, more transparent financial system is slowly but surely taking shape.
However, the road ahead is not without its challenges. The risks of institutional concentration, regulatory uncertainty, and macroeconomic headwinds are real and should not be underestimated. The sustainability of this new era will depend on a delicate interplay of market forces, regulatory developments, and continued technological innovation on its network.
What is clear is that Bitcoin has earned its place on the world's financial stage. It is no longer an outsider looking in, but a maturing asset that is being progressively integrated into the global economic fabric. Whether this institutional era will be a lasting one remains the defining question of our time. But one thing is certain: Bitcoin's journey is far from over, and its evolution will continue to be one of the most compelling and consequential stories in the world of finance for years to come.
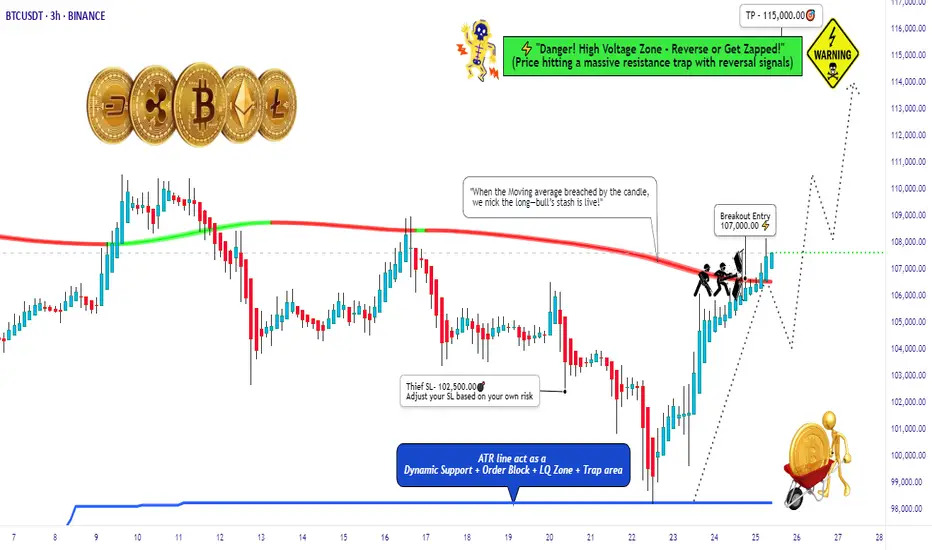
BTC/USD Thief Breakout at $107K – Eyeing $115K!🚨 Thief Entry Setup: BTC/USD Breakout Play 🚨
Overview:
Jump in after the $107 000 breakout—aiming for $115 000 with a tight “Thief SL” at $102 500. Adjust the stop‑loss to match your personal risk tolerance.
🧠 Setup Summary
Pair: BTC/USD
Entry trigger: Breakout above $107 000
Stop‑Loss: “Thief SL” at $102 500 (use your own risk‑based SL)
Target: $115 000
🎯 Why This Setup?
Clear breakout level at $107 000 = fresh momentum
Tight SL cushion (≈‑4.3%) = defined risk
Target ≈ +7.5% potential = strong reward-to-risk (~1.75:1)
📏 Risk Management Tips:
Only risk a small % of your capital—never exceed your comfort zone.
Move your SL to breakeven once mid‑target is hit to lock in profits.
Trailing your stop‑loss could secure bigger gains if BTC surges toward $115 000.
Bitcoin’s Incoming Bear Market!🚀 Bitcoin’s Bullish Phase: The Final Push Before the Fall?
Bitcoin is currently in the parabolic uptrend phase of its halving cycle, with price action closely following historical patterns. Since the last halving on April 15, 2024, Bitcoin has mined approximately 42,480 blocks, pushing the market closer to the 70,000-block threshold where the trend historically reverses into a deep bear market.
Based on historical patterns, Bitcoin’s next major bull market peak is expected around 150,000 USD, approximately 70,000 blocks post-halving (projected for August 2025). However, investors must prepare for what follows—a severe bear market fuelled by miner capitulation.
🔥The 70,000-Block Bearish Reversal: Why It Happens Every Cycle
1. The Mining Difficulty Trap & Rising Costs
Bitcoin’s mining difficulty adjusts every 2,016 blocks (~2 weeks) to maintain the 10-minute block interval.
As BTC price surges in the bull market, more miners join the network, driving competition and difficulty higher.
This raises mining costs and squeezes profit margins, making it harder for smaller miners to stay afloat.
✅ Bull Market (~0-70,000 Blocks Post-Halving)
High BTC prices offset increased difficulty, allowing miners to hold rather than sell.
Low sell pressure from miners keeps Bitcoin in an uptrend.
❌ Bear Market (~70,000 Blocks Post-Halving)
After BTC peaks, prices decline but difficulty remains high.
Mining costs remain constant, while block rewards drop.
Weaker miners can’t afford to mine at a loss and are forced to sell their BTC holdings to cover operational expenses.
2. The Snowball Effect: How Miner Capitulation Triggers a Crash
Once inefficient miners begin selling, a chain reaction unfolds:
1️⃣ Bitcoin price starts declining after the cycle peak (~12-18 months post-halving).
2️⃣ Miners struggle to remain profitable due to high difficulty and lower block rewards.
3️⃣ Miners begin offloading BTC to cover expenses, increasing supply in the market.
4️⃣ More BTC supply leads to further price drops, triggering panic selling.
5️⃣ Additional miners shut down operations, selling off reserves, further flooding the market.
6️⃣ Capitulation accelerates, causing a cascading effect similar to leveraged liquidations seen in past bear markets.
🔄 This cycle repeats until enough miners exit, difficulty adjusts downward, and BTC stabilizes.
3. Historical Proof: How Miner Capitulation Has Marked Every Bear Market
Each Bitcoin bear market aligns with major miner capitulation events. Here’s how past cycles have played out:
📌 2012 Halving: Bull top in late 2013, miner capitulation in 2014, BTC fell -80%.
📌 2016 Halving: Bull top in late 2017, miner capitulation in 2018, BTC fell -84%.
📌 2020 Halving: Bull top in late 2021, miner capitulation in 2022, BTC fell -78%.
📌 2024 Halving: Expected bull top in late 2025, miner capitulation likely in 2026?, BTC decline TBD but estimated to be around -60%.
🔹 In all cases, BTC topped ~70,000 blocks after the halving, followed by a deep drawdown driven by miner capitulation.
🔹 The selling pressure from miners perfectly aligns with the start of major market crashes.
4. The Accumulation Phase: What Follows the Crash?
After miners capitulate and difficulty adjusts downward, Bitcoin enters a sideways accumulation phase (~140,000-210,000 blocks post-halving).
Weaker miners have already exited, reducing sell pressure.
Surviving miners adjust to lower rewards and stop mass selling BTC.
Smart money (whales & institutions) begin accumulating at undervalued prices.
The MVRV ratio drops below 1, signalling a market bottom.
Bitcoin stabilizes, setting the stage for the next bull cycle.
This predictable recovery cycle lays the groundwork for Bitcoin’s next exponential rally into the next halving period.
The Bitcoin Bear Market Prediction for 2025-2026
✅ Bitcoin is currently on track to peak near ~$150,000 around 70,000 blocks post-halving (August 2025).
✅ Following this, BTC is expected to enter its bear market, with prices potentially falling to ~$60,000 (by December 2026).
✅ The primary catalyst for this crash will be miner capitulation, just as it has been in every prior cycle.
Final Thoughts
If history repeats, the Bitcoin market is set to follow a sharp parabolic rise to ~$150,000 before undergoing a 70,000-block miner-driven selloff into a multi-month bear market. Investors should be aware of this pattern and plan accordingly.
Sources & Data Validation
The insights presented in this article are based on historical Bitcoin price cycles, on-chain analytics, and mining difficulty trends from various sources, including:
Blockchain Data (Glassnode, CoinMetrics)
Historical BTC Halving Data (Bitcoin Whitepaper, Blockchain Explorers)
Market Analysis Reports (Messari, Arcane Research)
Macroeconomic Influences (Federal Reserve Reports, Global Liquidity Cycles)
Disclaimer: Not an Investment Recommendation
This article is for informational purposes only and should not be considered financial or investment advice. Bitcoin and cryptocurrency markets are highly volatile, and past performance is not indicative of future results. Conduct your own research and consult with a financial professional before making any investment decisions.

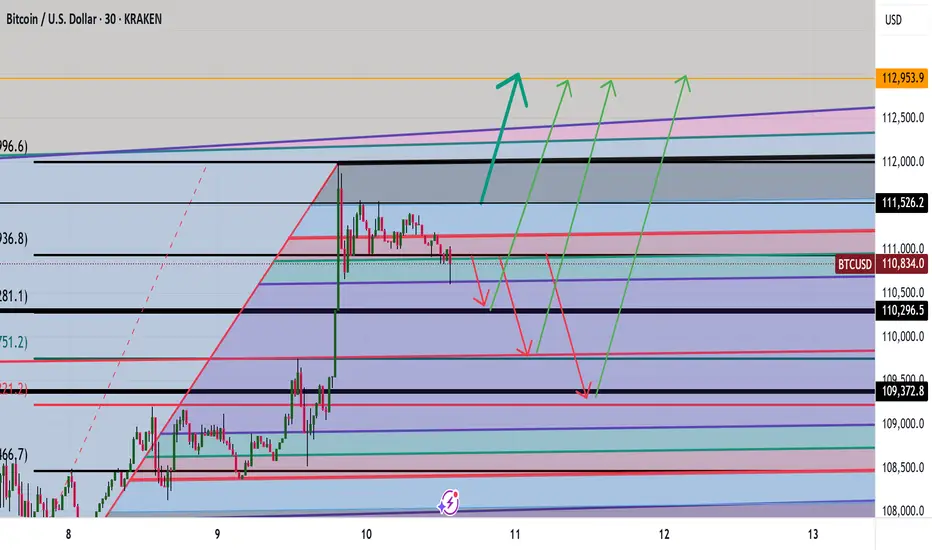
BTC Analysis TO 112,981 LEVELS AND BEYOND ? Good morning folks
BTC analysis with a little correction down to 110,300- 109,300 levels then a drive up to 112-113K levels
Let me know what you think
Kris/Mindbloome Exchange
Trade Smarter Live Better
BITCOIN: BULL TRAP???! (Be careful if you are long)Yello! I am breaking down Bitcoin, and sharing with you the Elliot Wave descending Leading diagonal formation, Rising wedge aka contracting triangle where E wave might be forming a corrective mode wave triangle itself and, after that’s formed we might start crashing if we will get the confirmations we are waiting for, and which some of them I shared with you in this video. Enjoy Paradisers!

BTC Storm of Consolidation, New Money, and Macro-PoliticsBitcoin at the Precipice: A Perfect Storm of Consolidation, New Money, and Macro-Political Tailwinds
In the intricate and often tempestuous world of digital assets, there are moments of frantic volatility and periods of eerie calm. Bitcoin, the undisputed king of cryptocurrencies, currently finds itself in one of these fascinating lulls—a state of high-altitude consolidation that is anything but sleepy. Trading just a whisper away from its all-time high, the asset is coiling like a spring, absorbing immense selling pressure from early adopters while simultaneously drawing in a new, powerful wave of buyers. This delicate equilibrium, however, is set against a backdrop of explosive potential catalysts. From tightening technical indicators screaming of an imminent breakout to the looming deadline of US tariffs, the vocal endorsement of tech titans, and the unprecedented entry of Bitcoin into the mainstream political arena, the stage is being meticulously set. The question on every analyst's and investor's mind is no longer if Bitcoin will make its next major move, but when, and just how monumental it will be. This is not just another market cycle; it is a convergence of forces that could propel Bitcoin toward price horizons that were once the domain of only the most fervent optimists.
The Anatomy of a Healthy Consolidation: Whales Recede as a New Foundation is Built
At first glance, a market that stalls just below its peak might seem like a sign of weakness, an indication that the bullish momentum has been exhausted. However, a deeper look into the current structure of the Bitcoin market reveals a picture of profound strength and maturity. This period of consolidation is characterized by a crucial and healthy rotation of ownership. The so-called "whales"—early investors and large-scale holders who have accumulated vast quantities of Bitcoin at much lower prices—are beginning to ease their holdings. This is not the panic-selling seen during bear market capitulations. Rather, it is a strategic and logical process of taking profits, de-risking portfolios, and realizing life-changing gains after a historic run.
Every Bitcoin sold by a whale must be bought by someone else, and the identity of these new buyers is what makes the current phase so compellingly bullish. The supply being released onto the market is not causing a price crash; instead, it is being steadily absorbed by a fresh cohort of participants. This new wave includes a diverse mix of players: retail investors who are gaining confidence as Bitcoin solidifies its mainstream status, smaller institutional players who are now more comfortable entering the market, and, most significantly, corporations that are beginning to view Bitcoin as a legitimate treasury reserve asset. This process is akin to the changing of the guard. The early pioneers are passing the baton to a new generation of holders who are establishing a new, higher cost basis. This dynamic is incredibly constructive for long-term price stability. It builds a robust and formidable wall of support at these elevated price levels, transforming what was once a speculative peak into a solid foundation for the next leg up.
Further evidence of this underlying strength can be seen in Bitcoin's recent weekly performance. The asset has managed to set another record high weekly close. In the world of technical analysis, a weekly close is considered far more significant than a brief, volatile intraday spike. An intraday high can be the result of a short-lived speculative frenzy or a liquidation cascade, but a high weekly close demonstrates sustained buying pressure and conviction over a longer duration. It signifies that, for seven straight days, buyers successfully defended higher price levels against sellers, ultimately winning the battle as the candle closed. This repeated ability to secure high weekly closes indicates that the market is systematically accepting and validating these new price territories, creating a psychological and technical launchpad for a future assault on all-time highs. Traders are now intensely focused on this dynamic, attempting to pinpoint the new, higher bottoms of this consolidation range, recognizing that these levels are likely to serve as the bedrock for the next major bull run.
The Technical Cauldron: Bollinger Bands Signal an Imminent and Violent Breakout
While the fundamental picture is one of healthy rotation, the technical charts are sending an even more urgent message: prepare for a massive move. Among the myriad of indicators used by traders, the Bollinger Bands are currently painting a particularly dramatic picture. Bollinger Bands consist of three lines plotted over a price chart. The middle band is a simple moving average, while the upper and lower bands are positioned at a set number of standard deviations away from the middle band. In essence, they are a direct measure of market volatility. When the market is volatile, the bands widen. When the market is calm and consolidating, the bands contract, or "squeeze."
Bitcoin is currently in the midst of one of the most significant Bollinger Band squeezes seen in recent history. The upper and lower bands have drawn incredibly close to one another, indicating that volatility has been wrung out of the market to an extreme degree. Historically, such periods of low volatility are the calm before the storm. A Bollinger Band squeeze is almost always resolved by a period of explosive, high volatility—a powerful breakout. The longer and tighter the squeeze, the more violent the subsequent price move tends to be. The indicator itself does not predict the direction of the breakout, but in the current context, the directional bias is overwhelmingly clear. With Bitcoin consolidating just shy of its all-time high after a powerful uptrend, and with the fundamental backdrop being so strong, the path of least resistance is overwhelmingly to the upside.
This technical setup creates a powerful psychological feedback loop. As more traders and algorithms spot the tightening bands, they begin to position themselves for the inevitable breakout. This builds a massive amount of potential energy within the market. When the price finally does break through the upper band, it can trigger a cascade of buy orders—from traders entering new long positions, to short-sellers being forced to buy back to cover their losing bets. This rush of buying pressure is what can turn a simple breakout into a parabolic, face-ripping rally.
The anticipation surrounding this move has led to some audacious price targets being discussed. Analysts are now contemplating the possibility of a "false move" to as high as $105,000. The term "false move" in this context is intriguing. It could imply a rapid, almost wick-like surge to that level, driven by extreme speculation and leverage, which might then be followed by a sharp correction to shake out the "paper hands" before a more sustainable climb resumes. Alternatively, it could simply be a way of expressing disbelief at the sheer velocity of the potential move. Whether the target is $105,000 or another figure, the underlying message from the charts is unambiguous: Bitcoin is on the verge of a big move, and the technicals strongly suggest it will be a powerful breakout to the upside, potentially ushering in a new phase of price discovery.
The Confluence of Catalysts: Tariffs, Politics, and The Musk Effect
A primed technical setup is potent on its own, but when combined with powerful external catalysts, it creates the recipe for a perfect storm. Bitcoin's next potential move is not just being driven by its internal market dynamics; it is being pulled forward by a confluence of macroeconomic and political forces that are aligning in its favor.
One of the most significant near-term catalysts is the looming US tariff deadline. Historically, periods of geopolitical tension and economic uncertainty have been incredibly bullish for Bitcoin. Tariffs, trade wars, and protectionist policies create instability in global markets and can erode the value and trust in fiat currencies. As nations engage in economic conflict, savvy investors and even central banks begin to look for non-sovereign, censorship-resistant stores of value to hedge their wealth. Bitcoin, with its decentralized nature and fixed supply, is the ultimate hedge against such fiat currency debasement and geopolitical turmoil. The impending tariff deadline is forcing a global conversation about the stability of the current financial system, and Bitcoin stands to be a primary beneficiary as capital seeks a safe haven from the storm.
Adding fuel to this fire is the upcoming "Crypto Week," a period of heightened focus on the industry through conferences, major announcements, and media coverage. These events act as a gravitational force, pulling the attention of the financial world toward the digital asset space. This concentrated attention almost always leads to increased trading volume and volatility. It creates a self-fulfilling prophecy where the expectation of big news and market moves encourages traders to participate, thereby creating the very volatility they anticipated.
Perhaps the most electrifying and unpredictable catalyst, however, is the re-emergence of Elon Musk's "love" for Bitcoin and the asset's dramatic entrance onto the main stage of American politics. Musk, with his colossal social media following, has a proven and unparalleled ability to influence market sentiment with a single post. His recent teasing of a "Pro-Bitcoin America Party" has sent shockwaves far beyond the crypto community. This move, whether serious or satirical, has injected Bitcoin directly into the heart of the US political discourse. It reframes Bitcoin not just as a financial asset, but as a political symbol—a representation of innovation, decentralization, and freedom from government control.
This has been met with a reaction from other major political figures, including Donald Trump, creating a fascinating push-and-pull. The fact that leading presidential candidates and political influencers are now debating Bitcoin's merits and role in the nation's future is a monumental step in its journey toward mainstream legitimacy. It forces the public and policymakers to take it seriously. This political theater creates an environment where assets perceived as being aligned with pro-growth, pro-innovation, and pro-freedom ideologies can thrive. The emergence of a "BTC Bull Token" or similar concepts tied to this political momentum underscores the new reality: Bitcoin is no longer just a tech story; it is a powerful political and cultural movement, and this new dimension is likely to attract a wave of capital from those who align with its burgeoning ideology.
The Institutional Stamp of Approval: A Corporate Treasury Revolution
While retail excitement and political drama provide the fuel, the institutional adoption of Bitcoin provides the solid, unshakeable foundation for its long-term trajectory. The most powerful recent example of this trend is the announcement from Genius Group, a publicly traded education technology company, that it is increasing its Bitcoin treasury target to a staggering 10,000 BTC. This is not a speculative trade; it is a profound strategic shift in corporate treasury management.
This decision signifies that corporate boards and CFOs are beginning to understand and act upon Bitcoin's value proposition as a superior treasury reserve asset. In an era of persistent inflation and low-to-negative real yields on traditional assets like government bonds, holding large amounts of cash on a balance sheet is a guaranteed way to lose purchasing power. By allocating a portion of its treasury to Bitcoin, Genius Group is taking a proactive step to protect its shareholders' value from the ravages of monetary debasement. It is a declaration of confidence in Bitcoin's long-term potential as a reliable store of value.
The importance of such a move cannot be overstated. It provides a powerful stamp of approval and a case study for thousands of other corporations around the world. When one publicly traded company makes such a bold move and outlines its rationale, it normalizes the strategy. Other CFOs, who may have been hesitant, now have a blueprint to follow and a precedent to point to when presenting the idea to their own boards. This has the potential to unlock a veritable floodgate of corporate capital. Even a small, single-digit percentage allocation from the treasuries of the S&P 500 companies would represent hundreds of billions of dollars of new, sustained buying pressure for Bitcoin. The move by Genius Group is not an isolated event; it is the leading edge of a seismic shift in how the corporate world perceives and utilizes money.
Conclusion: The Dawn of a New Epoch
Bitcoin stands at a historic inflection point. The current period of quiet consolidation is deceptive; beneath the surface, a powerful confluence of forces is converging to launch the asset into its next major chapter. The market's internal structure has never been healthier, with the holdings of early whales being patiently absorbed by a new and committed class of buyers, building a formidable price floor far above previous highs. The technical charts are screaming of an imminent and powerful breakout, with the tightening Bollinger Bands signaling a massive release of energy that heavily favors the upside.
Layered on top of this potent technical and structural setup is a perfect storm of external catalysts. The specter of global economic instability driven by tariffs, the focused attention of a "Crypto Week," the unparalleled influence of figures like Elon Musk, and the shocking but legitimizing entry of Bitcoin into the partisan political arena are all acting as powerful tailwinds. This is all underpinned by the quiet but revolutionary trend of institutional and corporate adoption, which promises to bring waves of new capital into the asset for years to come.
The consolidation will soon end. The question is not about direction, but about magnitude. The forces at play are no longer just about market cycles; they are about a fundamental repricing of a global, non-sovereign asset in a world grappling with economic and political uncertainty. The stage is set for a breakout that could not only shatter previous all-time highs but could also permanently elevate Bitcoin's status, solidifying its role as a cornerstone of the 21st-century financial and political landscape.
BITCOINBTC needs correction and one more push up before a drop to complete the correction.
Disclosure: We are part of Trade Nation's Influencer program and receive a monthly fee for using their TradingView charts in our analysis.

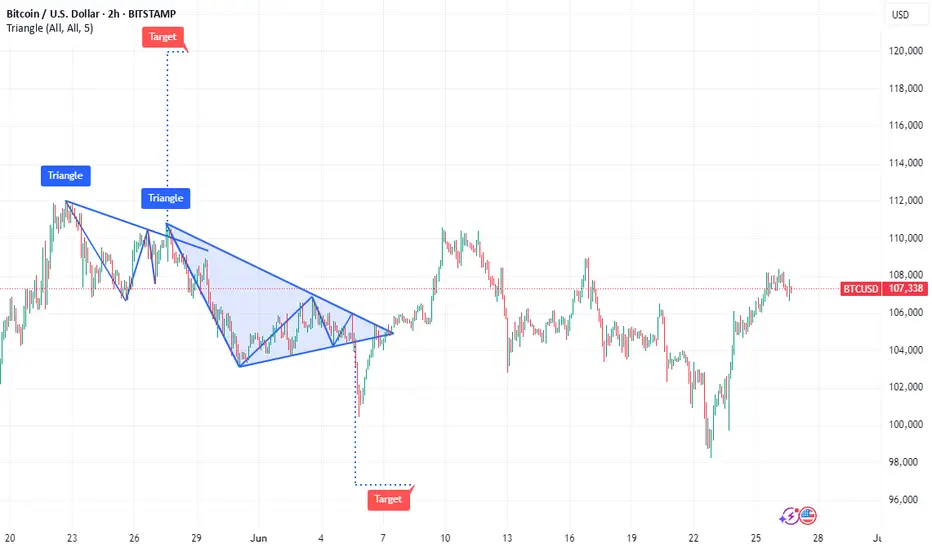
Bitcoin's Podium-Ready 'Bull Flag' Hints at Price Boom to $120KBitcoin's Podium-Ready 'Bull Flag' Hints at Price Boom to $120K
Bitcoin, the pioneering cryptocurrency that has redefined the financial landscape, continues to spark intense debate and fervent speculation about its future price trajectory. Amidst the sea of technical analyses and market predictions, a compelling pattern has emerged on Bitcoin's price chart: the 'bull flag.' This bullish continuation pattern, often seen as a precursor to significant upward price movements, has ignited excitement among Bitcoin proponents, fueling predictions of a potential surge to $120,000.
This article delves into the intricacies of the bull flag pattern, exploring its formation, characteristics, and implications for Bitcoin's price. We will analyze the current market conditions, considering the recent retreat from $108,000 and the overall sentiment of Bitcoin bulls. Furthermore, we will examine the factors that could either validate or invalidate the bull flag pattern, providing a nuanced perspective on the potential for Bitcoin to reach $120,000. By synthesizing these insights, we aim to offer a comprehensive overview of the technical and fundamental factors that could shape Bitcoin's price trajectory in the coming months.
Understanding the Bull Flag Pattern
The bull flag is a technical analysis pattern that signals a continuation of an existing uptrend. It is characterized by two distinct phases:
1. The Flagpole: This represents the initial strong upward movement in price. It is a sharp, almost vertical rally that establishes the overall bullish trend.
2. The Flag: This is a period of consolidation that follows the flagpole. The price moves sideways or slightly downwards, forming a rectangular or parallelogram-shaped pattern that resembles a flag. This consolidation phase allows the market to digest the initial rally and prepare for the next leg up.
The bull flag pattern is considered a bullish signal because it suggests that the initial uptrend is likely to resume after the consolidation phase. Traders often look for a breakout above the upper trendline of the flag as a confirmation signal to enter a long position.
Bitcoin's Bull Flag Formation
Bitcoin's price chart has exhibited a pattern that closely resembles a bull flag. The flagpole can be identified by the significant upward movement that occurred in the months leading up to June 2025. This rally propelled Bitcoin to a high of $108,000, establishing a strong bullish trend.
Following this rally, Bitcoin entered a period of consolidation, with the price moving sideways and slightly downwards. This consolidation phase has formed a flag-like pattern on the chart, characterized by two parallel trendlines that slope gently downwards.
The formation of this bull flag pattern has led many analysts to believe that Bitcoin is poised for another significant upward movement. The target price for this potential breakout is often calculated by measuring the length of the flagpole and adding it to the breakout point on the upper trendline of the flag. In Bitcoin's case, this calculation suggests a potential target price of around $120,000.
Factors Supporting the Bull Flag Pattern
Several factors support the validity of the bull flag pattern and the potential for Bitcoin to reach $120,000:
• Strong Underlying Bullish Trend: The bull flag is a continuation pattern, meaning that it relies on an existing uptrend to be valid. Bitcoin's price has been in a strong uptrend for several years, driven by increasing institutional adoption, growing mainstream adoption, and limited supply.
• Positive Market Sentiment: The overall sentiment among Bitcoin investors remains positive, despite the recent retreat from $108,000. Many analysts believe that Bitcoin is still in the early stages of its adoption curve and that its long-term potential remains significant.
• Increasing Institutional Adoption: Institutional investors, such as hedge funds, pension funds, and corporations, are increasingly allocating capital to Bitcoin. This increased institutional adoption can drive up the price of Bitcoin and provide a more stable foundation for its long-term growth.
• Growing Mainstream Adoption: Bitcoin is becoming increasingly accepted as a form of payment and a store of value by mainstream consumers and businesses. This growing mainstream adoption can increase demand for Bitcoin and drive up its price.
• Limited Supply: Bitcoin has a fixed supply of 21 million coins. This limited supply makes Bitcoin a scarce asset, which can increase its value over time as demand grows.
• Halving Events: Bitcoin's halving events, which occur approximately every four years, reduce the rate at which new Bitcoins are created. These halving events can reduce the supply of Bitcoin and drive up its price. The next halving event is expected to occur in 2028.
• Macroeconomic Factors: Macroeconomic factors, such as inflation, currency devaluation, and geopolitical instability, can increase demand for Bitcoin as a safe haven asset.
Factors Invalidating the Bull Flag Pattern
While the bull flag pattern is a bullish signal, it is not foolproof. Several factors could invalidate the pattern and prevent Bitcoin from reaching $120,000:
• Breakdown Below the Flag: If the price breaks down below the lower trendline of the flag, the bull flag pattern is invalidated. This would suggest that the consolidation phase is not a temporary pause before another rally, but rather a sign of weakening momentum.
• Negative News and Events: Negative news and events, such as regulatory crackdowns, security breaches, or macroeconomic shocks, could dampen investor sentiment and trigger a sell-off in Bitcoin.
• Weakening Market Fundamentals: If Bitcoin's adoption rate slows down, network activity declines, or transaction volume decreases, it could indicate that the underlying fundamentals are weakening, which could invalidate the bull flag pattern.
• Profit-Taking: After a significant rally, some investors may choose to take profits, which could put downward pressure on the price of Bitcoin and prevent it from breaking out of the flag.
• Alternative Investments: The emergence of compelling alternative investments could divert capital away from Bitcoin, reducing demand and potentially invalidating the bull flag.
Bitcoin Retreats From $108K: A Temporary Setback?
As of June 26, 2025, Bitcoin has retreated from its recent high of $108,000. This pullback has sparked concerns among some investors, but Bitcoin bulls remain optimistic about the long-term prospects of the cryptocurrency.
The recent retreat could be attributed to a number of factors, including profit-taking after a significant rally, regulatory concerns, or macroeconomic headwinds. However, it is important to note that Bitcoin has experienced numerous pullbacks throughout its history, and these pullbacks have often been followed by even stronger rallies.
The key question is whether this pullback is a temporary setback within the bull flag pattern or a sign that the pattern is about to be invalidated. If the price can hold above the lower trendline of the flag and eventually break out above the upper trendline, it would confirm the validity of the pattern and increase the likelihood of Bitcoin reaching $120,000.
Trading the Bull Flag Pattern
Traders who are looking to capitalize on the bull flag pattern can consider the following strategies:
• Entry Point: Wait for a confirmed breakout above the upper trendline of the flag before entering a long position. This helps to avoid false breakouts and increases the probability of a successful trade.
• Stop-Loss Order: Place a stop-loss order below the lower trendline of the flag to limit potential losses if the pattern is invalidated.
• Target Price: Calculate the target price by measuring the length of the flagpole and adding it to the breakout point on the upper trendline of the flag.
• Risk Management: Always use proper risk management techniques, such as limiting the amount of capital you risk on any single trade.
Conclusion
Bitcoin's price chart is currently exhibiting a bull flag pattern, which suggests that the cryptocurrency could be poised for another significant upward movement. The potential target price for this breakout is around $120,000.
However, it is important to note that the bull flag pattern is not foolproof, and several factors could invalidate it. Investors should carefully monitor the price action, market sentiment, and underlying fundamentals to assess the likelihood of Bitcoin reaching $120,000.
The recent retreat from $108,000 is a reminder that Bitcoin is a volatile asset and that pullbacks are a normal part of the market cycle. Whether this pullback is a temporary setback within the bull flag pattern or a sign that the pattern is about to be invalidated remains to be seen.
Ultimately, the future of Bitcoin's price will depend on a complex interplay of technical factors, market sentiment, and fundamental developments. By staying informed and using proper risk management techniques, investors can position themselves to potentially profit from Bitcoin's continued growth and success. As always, remember to consult with a qualified financial advisor before making any investment decisions. The bull flag offers a tantalizing glimpse of potential gains, but prudent analysis and risk mitigation are essential for navigating the volatile world of cryptocurrency.
Final Shakeout Before BTC’s Last Leg Up?BTC Update
Well due update here...
Since my last forecast, price pushed higher without giving the pullback I was anticipating — instead sweeping liquidity above the prior ATH.
After taking that BSL, price stalled and has since been ranging, showing clear signs of bearish momentum creeping in. We're seeing bearish orderflow on the LTF and daily, and volume is thinning out up at these highs — not ideal for bulls.
USDT.D is also pushing higher and showing strength, which typically leans bearish for BTC in the short term. The structure on that chart is bullish and supports the idea of a BTC pullback being likely before any continuation higher.
That said, I'm still pro-trend bullish overall — as I mentioned in April — thanks to the clean bullish shift from the range lows and clear signs of accumulation. We’ve got textbook last points of support (LPS) and unmitigated demand sitting below current price, which are prime candidates for a reversal.
Right now I’m eyeing two key levels:
Upper demand zone / LPS — lining up with the top of the prior accumulation range. This has strong confluence as a breakout-retest zone.
Lower refined weekly/2W demand — valid if we see a deeper flush or capitulation leg, though less likely in the short term.
My focus is on the first level. I’ll be watching for reactions and reversal signals if price taps into it. Same logic applies to USDT.D as it approaches nearby supply zones.
Overall, I see this as a healthy correction — overdue after an extended leg — and expect BTC to push higher and break ATHs once demand is retested and confirmed.
Zooming out: the 4-year cycle is approaching its final stages, with data suggesting a cycle top could form around Q3/Q4 2025 — likely between August and October, if past cycles rhyme. I’ll be monitoring major assets against that timeline and will look to scale out and risk-off when the confluences begin aligning with that macro cycle window.
Just think...
1 last BTC leg up...
Final altseason hype to drag in latecomers...
Then the cycle ends — and the trap shuts as we re-enter bear territory.
Charts:
1D:
3D:
1W:
Extra:
1M:

BITCOIN SHORT TERM UPDATE!!! Recently we have seen a great price move from 100K to 110K. We got clear Change Of Character , which indicates a sign of strength. Also we got bearish cypher harmonic pattern formed. So now we can expect a slight pullback up to 106-103k region from there we may see price reversing. But price should hold 100.3K region to remain bullish in short term.

Is Bitcoin hearing for a ATHs, again?After reaching new highs around $112k, BTC has since retraced to support around $100k.
Currently reclaiming support around $105k, continued strength could see price reach ATHs in the coming days or weeks.
Losing support around $105k could signal a retest of $100k.
Referring to a previous post, my theory that we may not see sub $100k for the rest of the year is still in play, perhaps a signal of market strength despite the fear of the bull market ending.
Evidently, BTC is still holding up to all bullish expectations... Until proven otherwise.

BITCOIN REVERSAL INCOMING !!!! BUT WHEN????Currently we have seen a great move from 75k to new ATH 112k BUT now whole bullish momentum seems to be fading.
If we see charts, we clearly see ranges and recently Bitcoin has swept range high & reclaimed back into range, which indicates lose momentum. We may see BTC tapping 90K even 80'sK for next bullish move.
For all to maintain it's bullish momentum, Bitcoin have to stay above 74.5k and needs to break and hold above 109.5K.
Breaking below 74.5k would push BTC as low as 60-55k
STAY CAUTIOUS !!!!

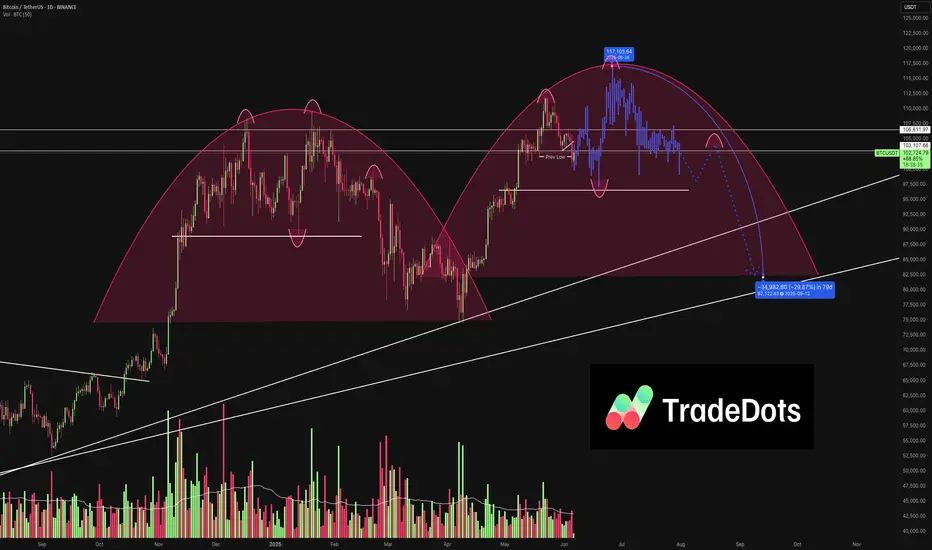
Is Bitcoin Repeating Its 2021 Price Action? | TRADEDOTSWe’ve observed that Bitcoin CME:BTC1! appears to be repeating a previous wave pattern. If it follows its historical price action yet again, here’s what we might expect:
2021 Comparison
Back in 2021, Bitcoin formed two large rounded wave structures where the second wave exceeded the first, forming two consecutive all-time highs followed by a huge drawdown. This year’s price action looks very similar to the beginning of the second 2021 waves. If it continues to unfold in the same way, we anticipate a new all-time high before the end of this year, followed by a notable pullback into early next year.
Key Support at $96,000
As long as BTC holds above $96,000, the bullish trend remains intact. This level has shown great demand and volume support, reinforcing its role as the floor for the short-term uptrend.
Upside Potential to $117,000
If buyers continue to support the market above $96,000, BTC could reach the $117,000 region, setting another all-time high. This expectation follows the earlier wave pattern seen earlier this year and completes a close parallel to the 2021 bull run.
Deeper Pullback Expected
After a potential new high, a larger correction is likely. Drawing on previous pullback price action, a 30% dip toward $82,000 could align with a higher-time-frame trendline and significant support area—mirroring the wave structure from 2021.
Final Thoughts
BTC remains structurally bullish above $96,000
A pullback to the $82,000 region could present a key buying opportunity if it occurs.
Bitcoin: What's next?BTC has lost local support around $107k and currently testing previous resistance around $104k.
If buyers are able to step in between $100k - $104k and reclaim $107k, it will signal strength.
If BTC experiences continued weakness, losing $100k as support, I would expect price to test the $95k - $97k region or 1D 200MA before signaling a reversal.

Bitcoin Correction or Trap? Watch This Support Zone CloselyExclusive #Bitcoin Update
I got lots of DMs, people are asking:
Do you think the bull trend is finished, or is it just a correction and pullback?
Guys, first stop panicking.
This is exactly what the shark wants you to do. Don’t let them shake you out.
Let’s get to the chart:
My previous chart got invalidated, and the current situation is that CRYPTOCAP:BTC is defending strongly around the $104.8K to $104.3K support zone.
According to the FIB level, we’re currently at the 0.383 level. This area has previously served as strong resistance, so it can now function as effective support.
If bulls manage to bounce from this area and push above $107K, we could trigger a sharp move toward the $112K–$113K liquidation zone,
where we have almost $12B in short liquidations acting as a strong magnet!
Let's talk about the worst-case scenario, in case we break down below this supportive area, then we have
200 EMA and a strong support around $101.4k to $101.8k.
I’ll keep you posted as things unfold. If you find my updates helpful, don’t forget to like and follow for more! #Bitcoin2025
CRYPTOCAP:BTC BITSTAMP:BTCUSD BINANCE:BTCUSDT

BTC Building Strength – Breakout Ahead?$BTC/USDT Weekly Analysis
Bitcoin continues to respect the 50 EMA on the weekly timeframe — a key dynamic support level that has consistently held throughout this bullish structure.
Each time BTC corrected, it found support near the 50 EMA before bouncing back with strength. The current structure mirrors past price action, with price again rebounding from the EMA after a consolidation phase.
We’re also seeing a pattern of lower highs forming a potential descending resistance line. A breakout above this trendline could trigger a fresh rally, possibly taking BTC to new highs.
As long as Bitcoin stays above the 50 EMA, the mid-to-long-term bias remains bullish. A confirmed breakout above the descending resistance could open the door for a strong upside continuation.
DYOR, NFA
Thanks for following along — stay tuned for more updates!
