$108K BTC ATH in Sight Despite ETF & Moody's HeadwindsBitcoin's Turbulent Ascent: Charting a Course Through Volatility, Institutional Embrace, and the $108,000 Horizon Amid Shifting Economic Sands
The world of cryptocurrency is once again fixated on its undisputed leader, Bitcoin (BTC). The digital behemoth is currently navigating a period of intense market activity, marked by dramatic price swings, a nuanced evolution in institutional engagement, and a striking resilience in the face of macroeconomic tremors. As Bitcoin flirts with the $102,900 threshold and repeatedly tests the crucial $104,000 psychological barrier, the air is thick with anticipation. Market analysts and enthusiasts alike are closely watching for a potential surge that could propel Bitcoin beyond its previous all-time high (ATH) to an ambitious $108,000 within the current month. This intricate dance unfolds against a complex global backdrop: a recent downgrade of US debt by Moody's, significant and strategic Bitcoin accumulation by institutional players like Japan's Metaplanet, and observable shifts in the open interest of Bitcoin Exchange Traded Funds (ETFs).
The narrative for Bitcoin in May 2025 is one of inherent strength and heightened expectation. While a recent, sharp pullback from the $107,000 mark was widely attributed to investors capitalizing on recent gains—a classic profit-taking maneuver—rather than a panicked reaction to Moody's revised outlook on US debt, the digital asset staged a swift and impressive recovery, climbing back towards the $105,000 level. This rapid rebound underscores a complex interplay of market forces, investor sentiment, and perhaps a growing perception of Bitcoin as an asset with unique characteristics. This resilience, buttressed by robust underlying network fundamentals and an increasingly confident institutional presence, paints a compelling and multifaceted picture of Bitcoin's current trajectory and its potential future.
Navigating Price Swings: Profit-Taking, Market Maturity, and a Dismissal of Moody's Downgrade
Bitcoin's recent price journey has been nothing short of a rollercoaster, a testament to its well-documented volatility. However, these fluctuations also hint at a market that is gradually maturing in its response to external economic shocks. The digital currency experienced a notable dip, with some initial commentary linking it to a broader "risk-off" sentiment ostensibly triggered by Moody's downgrade of US sovereign debt. Indeed, Moody's Investors Service adjusted the U.S. government's long-term issuer and senior unsecured ratings from the pristine AAA to Aa1. The agency cited mounting concerns over the nation's escalating debt burden and the sustainability of its interest payments, a move that traditionally sends ripples of caution through global financial markets, often prompting investors to reduce exposure to assets perceived as higher risk.
However, the narrative surrounding Bitcoin's reaction quickly evolved. The sharp sell-off from its recent high near $107,000 was predominantly identified by market observers as a consequence of profit-taking. Investors who had benefited from the preceding upward trend chose to realize their gains, a standard market dynamic in any asset class. This distinction is critically important. It suggests that the selling pressure was primarily an internal market mechanism within the cryptocurrency space itself, rather than a direct, sustained erosion of confidence directly attributable to the US debt downgrade.
In a remarkable display of this independent strength, Bitcoin demonstrated a robust recovery, rallying back towards the $105,000 mark. This price action was widely interpreted as Bitcoin effectively "ignoring" or "shrugging off" the downgrade's potential long-term implications for its own valuation. Some market analysts posit that this behavior lends further credence to Bitcoin's burgeoning role as a potential hedge against instability in traditional financial systems and a perceived decline in the long-term purchasing power of fiat currencies. While Bitcoin's price did exhibit a corrective phase around the time of the downgrade announcement, its capacity to swiftly regain lost ground suggests that the market may have either already factored in such macroeconomic developments or, more significantly, views Bitcoin's fundamental, long-term value proposition as increasingly detached from traditional economic indicators. The market's reaction, characterized by an initial dip followed by a spirited recovery, highlights Bitcoin's complex and evolving relationship with macroeconomic news. It behaves at times like a risk asset, sensitive to global liquidity and investor sentiment, and at other times, it exhibits characteristics of a safe-haven asset, sought after during periods of uncertainty.
The Alluring Prospect of a New Zenith: Is $108,000 Bitcoin's Next Landmark?
Amidst this characteristic volatility, a palpable undercurrent of optimism pervades the Bitcoin market. Strong suggestions and analytical forecasts point towards the possibility that Bitcoin could not only retest but decisively surpass its previous all-time high, potentially charting a course towards $108,000, and perhaps even higher, within the current month. Technical analyses, which scrutinize historical price patterns and market statistics to predict future movements, lend support to this bullish outlook. Some chartists and forecasters have identified take-profit targets for bullish positions clustering around the $109,158.98 region.
Currently, Bitcoin's price appears to be in a consolidation phase, hovering around the $102,957 mark after a retreat from a local peak of $107,115. Market participants are intensely focused on key resistance levels. The zone between $105,000 and $108,700 is viewed as a particularly critical hurdle. A decisive daily trading session closing above the $108,700 level could act as a powerful catalyst, potentially triggering a fresh wave of buying interest and propelling Bitcoin towards the $110,000 milestone. Should this momentum be sustained, a further ascent to $115,000 by the end of May is considered a plausible scenario by optimistic analysts.
This bullish sentiment is further amplified by what some market commentators describe as Bitcoin's "volatile liquidity run." This phenomenon, characterized by rapid shifts in market liquidity and price, is believed by some analysts to be capable of paving the way for new record highs. The market has recently observed unusual trading patterns, such as CME (Chicago Mercantile Exchange) Bitcoin futures contracts leading volatile price action, even during weekend trading sessions when traditional markets are closed. This indicates a dynamic and continually evolving market structure, increasingly influenced by institutional-grade trading venues.
Historically, Bitcoin's price has demonstrated a notable correlation with global liquidity conditions, particularly metrics like the M2 money supply. Expansions in M2, representing a broader measure of money in circulation, have often coincided with upward trends in Bitcoin's price. While current expansions in M2 could theoretically provide a tailwind for Bitcoin, the future trajectory of global liquidity is somewhat clouded by persistent inflation concerns and mixed signals from various economic sectors. Nevertheless, the potent combination of strong technical chart patterns, the potential for favorable liquidity conditions, and a resilient underlying market sentiment keeps the prospect of a new all-time high firmly within the realm of possibility. Analysts are keenly eyeing the $108,000 mark as a significant psychological and technical target. A convincing breakout above this level could potentially unleash further euphoric momentum, drawing in more retail and institutional capital.
The Institutional Equation: ETF Open Interest Moderates, While Metaplanet Intensifies Accumulation
The role and behavior of institutional investors continue to be a pivotal factor shaping Bitcoin's market dynamics and its journey towards mainstream acceptance. Recently, a noteworthy development was observed in the Bitcoin ETF space: open interest saw a 5% dip, settling at approximately $29.47 billion. This occurred even as Bitcoin itself maintained its price position near the $102,900 level. This decline in open interest, which represents the total number of outstanding derivative contracts that have not been settled, coupled with a discernible slowdown in weekly inflows into Bitcoin ETFs (which were reported as the lowest in a month, at $603.74 million for the period of May 12-16), suggests a degree of caution or perhaps a phase of consolidation among ETF investors. This follows a period of particularly heightened activity and significant inflows earlier in the year, often associated with the launch and growing popularity of spot Bitcoin ETFs in major markets. The relatively rangebound trading of Bitcoin, oscillating primarily between $102,711 and $104,971 during this period, likely contributed to this softer, more measured demand for ETF exposure.
However, it would be premature to interpret this dip in ETF open interest as a signal of a broader or sustained institutional retreat from Bitcoin. Activity in the derivatives markets, for instance, paints a more nuanced, and in some aspects, more bullish picture. Strong demand for call options, which give buyers the right but not the obligation to buy Bitcoin at a specific price in the future, indicates that a segment of sophisticated traders is actively positioning for an upward price movement, with some targeting levels around $110,000. In futures markets, when open interest rises in tandem with price, it typically signals that new capital is entering the market, reinforcing the strength and conviction behind the prevailing trend.
Contrasting sharply with the moderation observed in ETF flows is the aggressive and strategic accumulation of Bitcoin by corporate entities, most notably exemplified by Metaplanet. The Japanese investment firm recently captured headlines with its announcement of an additional purchase of 1,004 Bitcoin. This transaction marked its second-largest single acquisition of the cryptocurrency to date. This significant purchase, valued at approximately $104.3 million at the time of execution, increased Metaplanet's total Bitcoin holdings to an impressive 7,800 BTC. This substantial stash is currently worth over $800 million, fluctuating slightly with market prices but generally estimated between $806 million and $807 million. The company disclosed that its average acquisition price for this latest tranche of Bitcoin was around 15.13 million Japanese yen per BTC. Crucially, its overall average cost per BTC for its entire holdings now stands at approximately $91,340.
Metaplanet's Bitcoin strategy is notably ambitious and long-term in its orientation. The company has publicly stated its goals of accumulating 10,000 BTC by the end of 2025 and has even hinted at a more audacious long-term vision of potentially holding up to 1% of the total global Bitcoin supply. This proactive accumulation positions Metaplanet as a significant corporate holder of Bitcoin, particularly prominent within the Asian financial landscape. Its approach has drawn frequent comparisons to that of Strategy (formerly MicroStrategy), the US-based software intelligence firm renowned for its pioneering and substantial investments in Bitcoin as a primary treasury reserve asset.
Such large-scale corporate buying, as demonstrated by Metaplanet and Strategy, can exert considerable upward pressure on Bitcoin's price. By acquiring and holding substantial amounts of BTC, these corporations effectively reduce the freely circulating supply available on exchanges, a phenomenon sometimes referred to as exerting deflationary pressure, especially when corporate and even governmental buying activity is rapid and sustained. Metaplanet's actions, alongside those of other forward-thinking firms, underscore a growing and significant trend: the diversification of corporate treasuries into digital assets. These companies increasingly view Bitcoin not just as a speculative investment, but as a strategic reserve asset, a potential hedge against inflation, and a safeguard against the perceived long-term devaluation of fiat currencies. This movement has seen a notable surge in Bitcoin holdings by businesses globally, particularly since early 2024, signaling a paradigm shift in how corporations manage their financial reserves.
The Bedrock of Bitcoin: Network Health, Hashrate Resilience, and Expanding Mining Margins
Beneath the often-turbulent surface of price charts and the ebb and flow of institutional capital, the fundamental health and security of the Bitcoin network itself remain remarkably robust. Investment banking giant JPMorgan recently reported that the Bitcoin Network Hashrate experienced a slight but discernible rise in the first two weeks of May. The average hashrate during this period was noted at 88.5 Exahashes per second (EH/s), representing a 2% increase. Other data sources from the blockchain analytics community corroborate this trend, showing the daily hashrate reaching even higher levels, such as 831 EH/s as of May 1, 2025, and even peaking at an impressive 921 EH/s earlier in the month. This represents a significant increase from the lows observed in 2024. As of May 15, 2025, the Bitcoin Network Hash Rate was recorded at approximately 864.51 million Terahashes per second (TH/s), which translates to 864.51 EH/s. This continued upward trajectory in computational power dedicated to the network, even in the aftermath of events like the Bitcoin halving (which reduces the block rewards issued to miners), underscores the sustained confidence of miners and contributes directly to the network's formidable security.
Adding to this positive picture, mining gross margins have reportedly expanded sequentially throughout this month. JPMorgan's analysis highlighted that as Bitcoin prices appreciated, miners' gross profit margins also saw a month-on-month expansion, leading to improved economic conditions for those securing the network. The "hash price," a key metric representing daily mining profitability per unit of hash power, increased by a notable 13% when compared to April's figures. In the initial two weeks of May, Bitcoin miners earned approximately $50,100 per EH/s in daily block rewards (which includes both newly minted bitcoins and transaction fees). This figure is up 13% from the previous month and shows a 3% year-on-year increase.
This financial viability is crucial. It enables miners to continue investing in their operations, which includes covering significant energy costs and upgrading their specialized hardware (ASICs – Application-Specific Integrated Circuits) to maintain competitiveness and efficiency. Leading manufacturers like Bitmain and MicroBT continuously release more powerful and energy-efficient mining rigs. The fact that the market price of Bitcoin remains significantly higher than the average cost of mining (estimated by some analyses to be around $36,800 per BTC) indicates a healthy profit margin for the mining industry. These margins are comparable to those observed at the beginning of previous bull market cycles, further fueling optimism. Some publicly traded mining companies, such as LM Funding, have reported improved mining margins in the first quarter of 2025, successfully navigating the headwinds from the halving event through operational improvements, strategic power agreements, and in some cases, diversifying revenue streams like power sales.
The Untamed Frontier: Meme Coins and the Curious Case of BTC Bull Token
While Bitcoin, with its established infrastructure and growing institutional adoption, commands the lion's share of attention, the broader cryptocurrency ecosystem continues to be a fertile ground for innovation, experimentation, and, undeniably, speculation. One of the most prominent and often controversial manifestations of this is the meme coin phenomenon. The question frequently arises in online forums and social media: "Best Meme Coins like BTC Bull Token Next to Surge?" This highlights the persistent allure of these unique digital assets. Meme coins are a distinct category of cryptocurrency, typically inspired by internet memes, viral social media trends, or popular culture. Their value is often driven less by intrinsic utility or underlying technological fundamentals and more by community-generated hype, speculative fervor, and the quest for rapid, exponential gains. They are infamous for their extreme volatility, capable of producing meteoric price surges in short periods, but also equally susceptible to precipitous crashes.
BTC Bull Token ($BTCBULL) has emerged as a specific example within this highly speculative niche. It has positioned itself with taglines such as "the official Bitcoin meme coin" or a "Bitcoin-themed meme coin," attempting to leverage the brand recognition and market sentiment surrounding Bitcoin itself. Its core proposition appears to be a system of rewarding its token holders with airdrops of actual Bitcoin when BTC achieves certain predetermined price milestones (for example, when Bitcoin's price reaches $150,000, $200,000, or $250,000). Additionally, the $BTCBULL project outlines plans for token burn events. These events, designed to reduce the total supply of $BTCBULL tokens and theoretically increase their scarcity, are scheduled to occur when Bitcoin's price increases by specific increments (e.g., for every $25,000 increase in Bitcoin's price, starting from a baseline of $125,000). Currently reported to be in its presale phase, projects like BTC Bull Token aim to capitalize on the excitement and upward momentum of Bitcoin bull runs. They offer a highly leveraged, and therefore highly risky, way for speculators to potentially profit from Bitcoin's upside.
It is absolutely paramount for anyone considering an allocation to meme coins, including those linked thematically to Bitcoin, to thoroughly understand their inherent high-risk, high-reward nature. These assets are, by definition, intensely speculative. They are highly susceptible to "pump-and-dump" schemes, where coordinated buying inflates the price before early holders sell off en masse, leaving later entrants with significant losses. Many meme coins lack long-term viability, tangible real-world applications, or robust development teams. While the allure of quick, life-changing profits can be undeniably strong, the potential for substantial, and often total, financial loss is equally, if not more, significant. Prudent investors should approach such tokens with extreme caution, treating them more as a form of high-stakes gambling or digital entertainment rather than a serious, fundamentally-driven investment. Due diligence, a clear understanding of the risks involved, and an investment amount one can afford to lose are critical prerequisites.
Weaving the Narrative: A Complex Market of Resilience, Adoption, and Speculation
The current Bitcoin landscape presents a fascinating and intricate tapestry, woven from a diverse array of threads. We observe robust price action that seems increasingly capable of defying or quickly recovering from macroeconomic pressures. There is the steady, albeit sometimes fluctuating, march of institutional adoption, most visibly through products like ETFs, but also through direct corporate treasury allocations. The unwavering commitment of long-term corporate accumulators, exemplified by firms like Metaplanet, adds another layer of demand. Underpinning all of this is the fundamental strength and security of the Bitcoin network itself, evidenced by a healthy and growing hashrate. And, at the periphery, the ever-present speculative fervor of the broader crypto market, including the volatile world of meme coins, adds a unique dynamism.
Bitcoin's demonstrated ability to absorb the potential shock of Moody's US debt downgrade and subsequently rally, largely on the back of what was identified as profit-taking, indicates a growing maturity within its market. It also suggests a potential decoupling, at least to some extent, from the reflexive reactions often seen in traditional financial markets. The widespread anticipation of a new all-time high, with many eyes fixed on the $108,000 level, is not without foundation. It is supported by various technical indicators, ongoing positive sentiment, and a persistent bullish undercurrent in many segments of the market. However, the recent dip in ETF open interest serves as a salient reminder that institutional sentiment can be subject to caution and re-evaluation, and that the path to higher valuations is rarely a straight, uninterrupted line. Corrections and consolidations are natural parts of any market cycle.
Metaplanet's aggressive Bitcoin acquisition strategy highlights a different, perhaps more profound, facet of institutional interest. This is not just about short-term trading or exposure to a new asset class; it's about a long-term conviction in Bitcoin's potential role as a strategic treasury reserve asset. Such a trend, if it continues to grow, could have a more sustained and significant impact on Bitcoin's supply and demand dynamics over time. Meanwhile, the healthy hashrate figures and reports of improving miner profitability provide a solid and reassuring foundation for the network's continued secure operation and the confidence of its participants.
The emergence and popularity of meme coins like BTC Bull Token, while arguably peripheral to Bitcoin's core value proposition and its aspirations as a global financial asset, reflect the undeniable speculative energy that often accompanies bull markets in the cryptocurrency space. It serves as a reminder of the diverse and sometimes bewildering ecosystem that Bitcoin anchors – an ecosystem that now ranges from highly sophisticated institutional financial products and regulated investment vehicles to community-driven, high-risk, and often ephemeral digital tokens.
Gazing Forward: A Market Poised for Potentially Defining Movements
As May 2025 continues to unfold, the Bitcoin market stands at a fascinating and potentially pivotal juncture. The confluence of technical factors, institutional behavior, network fundamentals, and macroeconomic influences creates an environment ripe for significant moves. Several key elements will be crucial to watch in the coming weeks and months:
• Price Action Around Critical Levels: Bitcoin's ability to decisively breach and, more importantly, hold above the formidable resistance zone generally identified between $105,000 and $108,700 will be a critical determinant of whether a new all-time high is imminent. A strong breakout could ignite further momentum. Conversely, key support levels, likely around the $100,000 to $102,000 range, must hold firm to maintain the prevailing bullish market structure. A break below these supports could signal a deeper correction.
• Institutional Capital Flows: Continued monitoring of inflows and outflows from Bitcoin ETFs, as well as changes in their open interest, will provide valuable insights into shorter-term institutional sentiment and positioning. Simultaneously, tracking further corporate accumulation by entities like Metaplanet and Strategy will offer signals regarding long-term conviction and the adoption of Bitcoin as a treasury asset.
• Network Fundamentals and Security: Sustained growth in the Bitcoin network hashrate and the maintenance of healthy mining economics will continue to be vital indicators of the network's underlying security, resilience, and the confidence of its core infrastructure providers. Any significant disruptions or negative trends in these areas could impact broader market sentiment.
• Overarching Macroeconomic Influences: While Bitcoin has demonstrated a degree of resilience, the broader global economic climate will undoubtedly continue to exert an influence. Key factors to watch include inflation data from major economies, monetary policy decisions from central banks (particularly regarding interest rates and quantitative easing/tightening), and any further significant developments related to sovereign debt or geopolitical stability.
• Prevailing Market Sentiment: The overall sentiment within the cryptocurrency market, as reflected in metrics like the Fear & Greed Index, activity in derivatives markets (funding rates, options skew), and the tenor of discussions within online communities and social media, will play a significant role in driving short-term price movements. This is particularly true for the more speculative assets within the ecosystem.
Bitcoin's journey is one of perpetual evolution, marked by innovation, debate, and dramatic market cycles. The current phase, characterized by ambitious price targets, strategic institutional chess moves, and robust underlying network strength, suggests that the coming weeks and months could be particularly pivotal in shaping its longer-term narrative. While the prospect of Bitcoin surpassing the $108,000 mark and venturing into new price discovery territory excites many participants, the asset's inherent volatility, coupled with the speculative elements that froth at the market's fringes, necessitates a balanced and informed perspective. Acknowledging both the transformative potential of Bitcoin and the considerable risks that continue to define its unique position in the global financial landscape remains essential for anyone navigating this dynamic space.
Bitcoinpriceprediction

BTC still consolidates within a rangeIf you were like me, you got a little dose of hopium after BTC closed above last week's resistance around $105k.
Nonetheless, resistance was expected from $105k - $108k with price starting the week with a bearish engulfing candle, currently trading around $103.1k.
We will have to see if last week's support around $101.5k holds.
If the price continues with bullish momentum and does something like the period from 22 Apr - 6 May, a successful bull flag breakout could take BTC to $115k.
If support is lost, we could see retests of previous levels as low as $94.5k. However, my guess would be a test of $97.5k before going higher, creating a HHHL market structure.

BNB/USD Bullish Heist: Crack the Vault & Grab the Loot!🤑 BNB/USD Profit Chase 🤑
Chart explorers and wealth hunters! 🚀 Ready to dive into the Binance Coin vs. Dollar (BNB/USD) crypto market? 📊 This Rogue Trade Strategy mixes sharp technicals with market energy to pursue a bullish wave. Follow this guide, ride the momentum, and exit before the danger zone hits. Let’s stack those wins together! 💸🎯
📈 Trade Plan: BNB/USD
Market: BNB/USD (Crypto) 🌍
Outlook: Bullish Surge 🌠
Timeframe: 4h (Swing Trade) ⏳
Entry Zones 📡
Surge Entry (Entry 1): "Crack the code! Spot the MA breakout at 690.0 and jump in—bullish gains are calling!"
Smart Move: Set buy stop orders above the Moving Average or buy limit orders at the latest 15/30-min swing low/high for pullback entries. 📢 Add a chart alert to catch the breakout!
Retreat Entry (Entry 2): "The moment’s here! Wait for the MA pullback in the Market Makers’ Ambush Zone at 630.0, then strike—bold moves win big!" 📍
Pro Tip: Set a TradingView alert for the 690.0 breakout to stay ahead! 🔔
Stop Loss 🚨
Surge Traders: After breakout confirmation, place Stop Loss below the recent 4H swing low at (Entry 1) 660.0 & (Entry 2) 600.0 to shield against reversals. ⚡
Retreat Traders: Adjust Stop Loss to your risk level (e.g., 1-2% of account). Tweak based on lot size and multiple entries. 📏
Risk Note: This trade’s high-octane! Keep position sizes tight to safeguard your funds. 🔥
Profit Target 🎯
Target 735.0, near the Overbought Zone (ripe for consolidation or reversal). 🏁
Exit Play: Cash out early if bearish signals (e.g., high volume, reversal patterns) appear near 735.0. 💵
Scalpers 🔍
Focus on quick Long-side scalps with tight trailing stops. Team up with swing traders for the full plan or grab fast profits if your capital allows. 💰
📡 Why This Trade Shines (May 18, 2025)
BNB/USD is buzzing with opportunity, fueled by:
Technicals: A breakout above the ATR Line (~690.0), paired with higher lows on the 1D chart, signals strong momentum. 📈
Sentiment (May 17, 2025): Social media buzz on platforms like Reddit shows 70% positive sentiment for BNB, with traders hyping altcoin momentum. Fear & Greed Index at 74 (Greed), urging caution near overbought levels. 😎
Fundamentals: CFTC’s COT report (May 16, 2025) reports a 14% WoW increase in institutional long positions in crypto futures, showing big-player confidence. 🗳️
Seasonal Edge: Q2 historically lifts Bitcoin and altcoins, supporting our setup. 📆
Market Flow: USD weakness (DXY down 0.9% this week) and altcoin strength boost BNB’s upside. 🌐
⚠️ Risk Control: Protect Your Gains
News Alert: Skip new trades during major events (e.g., CPI, FOMC) to avoid volatility traps. 📰
Trailing Stops: Activate trailing Stop Loss as price nears 700.0 to secure profits. 🔐
Position Sizing: Cap risk at 1-2% per trade for a smooth ride. 🚦
💥 Kick Off the Chase! 💥
Join the Rogue Trade Strategy squad—like, comment, and follow for more exciting trade setups! 🚀 Your support drives our market missions, paving the way for precise wins. Let’s dominate BNB/USD together! 🤝🏅🎉
Stay Ready: Another trade plan’s coming. Keep your charts locked, traders! 🐱💻😉
🔔 Real-Time Data (May 18, 2025, UTC+1)
BNB/USD Price: ~685.0 (based on aggregated exchange data).
COT Report (May 16, 2025): Institutional long positions in crypto futures up 14% WoW, per CFTC.
Sentiment: 70% positive, Fear & Greed Index at 74 (Greed).
USD Index (DXY): Down 0.9% WoW, supporting altcoin strength.
Disclaimer: Grok is not a financial adviser; please consult one. Don't share information that can identify you.

Macro view of CRYPTOWhen congress passess laws for crypto in 25/26, Cryptocurrency is in for a massive upside (WAVE3).
IMO, "BITCOIN WILL SAVE THE WORLD" narritve will come out at the top of WAVE3.
"NOTHING STOPS BITCOIN" in GREEN WAVE5 for 'Retail" (your granny) to be the exit liquidity in 26/27 to start the ABC correction to retest the macro 1.618FIB for the great 85%-95% correction.
Let the games begin.

Bitcoin CME Futures Daily Trend AnalysisMarkets move in cycles, and different cycle durations help confirm trends ranging from short-term to long-term. Based on my analysis of the 5-day cycle, the Bitcoin CME Futures show a bearish signal. This suggests that the closing price on May 16, 2025, is likely to be lower than the opening price on May 13, 2025, which is 103100.
The current trend remains bullish, with a trailing stop-loss placed at 101059. A close below this level would confirm a sell signal.
Disclaimer: This is my personal market view and not a buy or sell recommendation. Traders should conduct their own technical analysis and follow sound risk management practices before taking any position.

Bitcoin Smashes $103K: Is $150K Just Around the Corner?Bitcoin's Resurgence: Navigating the $100K Breakthrough and What Comes Next
In a remarkable display of market resilience, Bitcoin has reclaimed the coveted $100,000 level, just three months after dropping below this significant psychological threshold. The flagship cryptocurrency's powerful comeback has sent shockwaves through financial markets, triggering a massive short squeeze and reigniting debates about Bitcoin's long-term potential. As the asset pushes beyond $103,000 and approaches its previous all-time high, traders and investors are scrambling to position themselves for what many believe could be the next phase of an extraordinary bull cycle.
The Historic Reclamation of $100K
Bitcoin's journey back to $100,000 represents more than just a numerical milestone—it's a testament to the asset's remarkable resilience in the face of significant headwinds. After briefly touching six-figure territory in early 2025, Bitcoin experienced a substantial correction that saw prices retreat below $90,000, triggering concern among market participants and no shortage of bearish predictions from skeptics.
What makes this recovery particularly impressive is the speed with which it occurred. Historically, Bitcoin has often experienced extended consolidation periods after major corrections, sometimes lasting months or even years. The rapid three-month turnaround suggests underlying strength in Bitcoin's market structure that distinguishes this cycle from previous ones.
On-chain data reveals fascinating dynamics behind the recovery. Throughout the correction, long-term holders continued accumulating Bitcoin, with wallet addresses holding more than 1 BTC increasing by 5.2% even as prices declined. This pattern of "smart money" accumulation during periods of retail fear often precedes significant upward price movements.
The reclamation of $100,000 also coincided with several favorable macro developments, including renewed expectations for central bank easing and diminishing concerns about regulatory crackdowns. These factors, combined with Bitcoin's post-halving supply dynamics, created ideal conditions for a powerful recovery.
The Massive Short Squeeze
A key accelerant in Bitcoin's surge beyond $100,000 was an extraordinary short squeeze that forced bearish traders to cover their positions at increasingly higher prices. Data from cryptocurrency derivatives platforms reveals that over $850 million in short positions were liquidated during a 72-hour period as Bitcoin broke above key resistance levels.
The mechanics of a short squeeze are particularly powerful in cryptocurrency markets due to the prevalence of leverage. Many platforms offer leverage ratios of 10x, 20x, or even higher, meaning relatively small price movements can trigger automatic liquidations. As these liquidations occur, trading algorithms automatically purchase Bitcoin to close the short positions, creating additional upward pressure on prices and potentially triggering more liquidations in a self-reinforcing cycle.
What made this particular short squeeze especially impactful was its timing relative to market sentiment. The Crypto Fear & Greed Index had been hovering in "Neutral" to "Fear" territory for weeks, indicating widespread caution among market participants. This cautious positioning resulted in a market structure where relatively few traders were positioned for upside, creating the perfect conditions for a powerful squeeze when momentum shifted.
Is $150,000 Now Conservative?
In light of Bitcoin's powerful resurgence, price predictions that once seemed ambitious are being reevaluated. Earlier this year, several major financial institutions and research firms issued year-end targets of $150,000 for Bitcoin—forecasts that were met with skepticism by many market observers. Now, with Bitcoin already above $103,000 and demonstrating strong momentum, these once-ambitious targets appear increasingly conservative.
Technical analysts point to several factors supporting the case for higher prices. The weekly Relative Strength Index (RSI), despite the recent surge, remains below extreme overbought levels that typically signal exhaustion. Additionally, volume profiles show relatively little resistance above the previous all-time high, suggesting potential for rapid advancement if that level is breached.
The most bullish analysts have begun floating targets of $170,000 to $200,000 for this cycle, basing their projections on Fibonacci extensions, comparative analysis with previous bull markets, and on-chain metrics indicating strong holder conviction. These projections represent a dramatic shift in market sentiment compared to just a few months ago when many were questioning whether Bitcoin would reclaim $100,000 within the year.
Is It Too Late to Buy Bitcoin?
As Bitcoin pushes beyond $103,000, the perennial question resurfaces: is it too late to buy Bitcoin? This query, which has appeared at virtually every significant price level in Bitcoin's history, reflects the challenge of evaluating assets in price discovery mode without extensive historical reference points.
Historical perspective offers valuable context for addressing this question. Investors who asked whether it was "too late" to buy Bitcoin at $10,000, $20,000, or $50,000 and chose to remain on the sidelines missed substantial returns. However, those who purchased at local tops often endured extended drawdowns before seeing their investments return to profitability.
On-chain data provides additional perspective for evaluating current price levels. The MVRV (Market Value to Realized Value) ratio, which compares Bitcoin's market capitalization to its realized capitalization, currently sits around 2.8—elevated compared to bear market conditions but significantly below the extreme readings above 4.0 that characterized previous market tops.
Similarly, the percentage of Bitcoin supply in profit currently stands at approximately 93%, approaching but not yet reaching the 98-99% levels typically seen at cycle peaks. These metrics suggest that while Bitcoin isn't in "bargain" territory, present valuations haven't reached the extreme overvaluation levels that preceded major corrections in previous cycles.
Bull Run Warning: Navigating the Path Forward
While enthusiasm surrounds Bitcoin's reclamation of $100,000, experienced market participants recognize the importance of maintaining perspective during periods of strong momentum. Several potential warning signs merit attention as traders navigate the current environment.
The rapid nature of Bitcoin's ascent to $103,000 has created technically overbought conditions on shorter timeframes, suggesting the potential for near-term consolidation or pullbacks. The daily RSI has reached levels above 80, a zone that has historically preceded at least temporary pauses in uptrends, even during the strongest bull markets.
Additionally, funding rates on perpetual futures contracts have reached extremely positive levels, indicating traders are paying significant premiums to maintain long positions. This condition often occurs near local tops as market participants become overly enthusiastic about near-term prospects.
Risk management becomes particularly important during such periods of strong momentum. Many professional traders reduce position sizes when volatility increases, recognizing that while potential returns expand during such phases, so do potential drawdowns.
Next Price Targets: From $106K to $1M
As Bitcoin pushes into record territory, analysts have begun identifying potential targets for the next phase of the bull cycle. The immediate focus remains on the previous all-time high around $106,000, which represents both a psychological and technical resistance level. Beyond this point, limited historical price action creates a potential vacuum that could allow for rapid advancement if bullish momentum continues.
Technical analysts have identified several key levels through Fibonacci projections and extension analysis. The 1.618 Fibonacci extension from the previous major correction projects a target around $122,000, while the 2.618 extension suggests potential toward $170,000. These levels represent natural points where the market might experience resistance or consolidation during continued uptrends.
More ambitious predictions extend considerably higher. The stock-to-flow model, which relates Bitcoin's scarcity to its market value, suggests potential long-term valuations approaching $1 million per Bitcoin. While such forecasts remain highly speculative, they illustrate the wide range of potential outcomes for this emerging asset class.
Support levels are equally important to monitor, particularly for traders managing risk in leveraged positions. The psychological $100,000 level now represents initial support, followed by the $94,000-$96,000 zone where significant buying emerged during the recent advance. The 50-day moving average, currently around $92,000 and rising, provides an additional technical reference point for potential support during pullbacks.
Market Sentiment: Fear and Greed Dynamics
Market sentiment indicators provide valuable context for understanding Bitcoin's current positioning. The Crypto Fear & Greed Index has shifted into the "Greed" zone after spending much of the previous month in "Neutral" territory, reflecting improved market sentiment following Bitcoin's reclamation of $100,000.
This transition marks an important psychological shift but also signals increasing risk of overexuberance. Historically, when the index reaches extreme readings in either direction, it has often served as a contrarian indicator. Extreme greed readings have typically occurred near local tops, while extreme fear has often presented buying opportunities.
Social media activity metrics reveal a significant increase in Bitcoin-related discussions, with sentiment analysis showing predominantly positive expressions. Google Trends data indicates search interest for "Bitcoin" has reached its highest level since January, suggesting renewed attention from retail participants who typically enter during periods of strong price performance.
Institutional sentiment provides a contrasting perspective to retail excitement. Surveys of professional investors indicate a more measured outlook, with many maintaining Bitcoin allocations but expressing concern about near-term volatility and the potential for consolidation after the recent surge. This divergence between institutional caution and retail enthusiasm creates an interesting dynamic that may influence price action in the weeks ahead.
Trading Strategies for the Current Environment
For traders navigating Bitcoin's volatile price action, adapting strategies to current market conditions is essential. Different approaches suit varying risk tolerances and time horizons, particularly during periods of expanded volatility and strong directional momentum.
Trend-following strategies have performed exceptionally well during Bitcoin's recent advance, with systematic approaches based on moving average crossovers or momentum indicators capturing much of the upside movement. These strategies typically involve entering positions when short-term momentum aligns with longer-term trends and using trailing stops to protect profits.
Countertrend strategies face greater challenges in the current environment but can still prove effective when applied with appropriate risk parameters. These approaches involve identifying potential exhaustion points where trends might temporarily reverse, typically using oscillators like RSI or Stochastic indicators to identify overbought or oversold conditions.
For longer-term investors, dollar-cost averaging continues to demonstrate effectiveness in navigating volatile markets without requiring precise timing decisions. This approach involves regularly purchasing Bitcoin in fixed dollar amounts regardless of price, mathematically ensuring better average entry prices during periods of volatility.
Conclusion: Navigating Bitcoin's New Era
Bitcoin's resurgence beyond $100,000 represents a significant milestone in cryptocurrency market development, potentially signaling the beginning of the next phase in this remarkable asset's evolution. The speed and magnitude of the recovery from below $90,000 to above $103,000 demonstrates both the volatility inherent in this emerging asset class and the powerful market forces that can drive prices when technical breakouts coincide with favorable fundamental catalysts.
For traders and investors, the path forward requires balancing enthusiasm about Bitcoin's demonstrated resilience with pragmatic risk management appropriate for an asset capable of significant price swings in both directions. While the backdrop appears favorable for continued strength, history suggests the journey will include both exhilarating advances and challenging retracements.
As market participants position themselves for what may come next, maintaining perspective on both historical precedents and the unique aspects of the current market cycle provides the most sustainable approach to navigating this dynamic landscape. Bitcoin's breakthrough beyond $100,000 creates both opportunity and risk—the traders who successfully balance these competing forces while maintaining disciplined execution will likely find the greatest success in capturing the potential of this extraordinary market.
The question is no longer whether Bitcoin can reach $100,000, but rather how far beyond this once-unimaginable milestone the current cycle might extend. For an asset that began trading at fractions of a penny, the reclamation of six-figure territory serves as a powerful reminder of cryptocurrency's capacity to challenge conventional financial assumptions and create paradigm-shifting returns for those willing to embrace both its potential and its risks.

#BITCOIN: $130,000 Is Where Price Headed To? BINANCE:BTCUSDT consolidated at 75k and reversed from the region as predicted in our previous chart. We now have strong confirmation that price will likely break through the daily bearish trendline. We can enter when it retests the identified area.
We have two major targets. Do your own research and analysis, and use this as secondary bias.
Good luck trading.
❤️
Hope you’re having a great weekend.
Team Setuspfx_

#BTCUSDT:Price Moving Well From $88,000 to $96,000,Next $128,000Bitcoin has moved well from our last idea of $88,000 to $96,000. However, a small correction is expected, which could be a good point to enter a swing trade. This could take the price to a new record high of around $128,000.
We have three targets, but each can be set based on your overview. The last three candles are not clear, so it’s best to wait for price to have a clearer indication of its next move.
We wish you the best and good luck in your trading journey. Thank you for your unwavering support! 😊
If you’d like to contribute, here are a few ways you can help us:
- Like our ideas
- Comment on our ideas
- Share our ideas
Team Setupsfx_
❤️🚀

New Bitcoin ATH Incoming? Key Bullish Signals & Decoupling AnalyBitcoin at the Precipice: Analyzing the Confluence of Bullish Signals, Decoupling Dynamics, and the Looming Question of a New All-Time High
The cryptocurrency market, and Bitcoin in particular, exists in a perpetual state of flux, analysis, and fervent speculation. In recent weeks and months, a compelling narrative has begun to coalesce, woven from disparate threads of technical indicators, on-chain data, market dynamics, and historical parallels. Bitcoin, after a period of consolidation and correction, appears to be sending signals that have historically preceded significant upward movements. Analysts are pointing to specific indicators flashing green, a potential local bottom seems confirmed, and intriguing shifts are occurring in mining difficulty and Bitcoin's relationship with the wider altcoin market. All this culminates in the tantalizing question echoing across trading desks and social media: Is a new Bitcoin All-Time High (ATH) incoming, perhaps even within the next year?
This article delves deep into the multifaceted factors fueling this speculation. We will dissect the analyst flags suggesting a major rally, examine the evidence for a confirmed local bottom, explore the significant decoupling of Bitcoin from altcoins, analyze the implications of the shifting mining difficulty, evaluate the compelling comparison to Gold's historical breakout, and assess the technical picture presented by indicators like the Stochastic RSI and Taker Buy/Sell ratio. By synthesizing these elements, we aim to provide a comprehensive overview of the forces currently shaping Bitcoin's trajectory and the arguments underpinning the bullish outlook for a potential new ATH, possibly targeting Q2 2025.
Part 1: Reading the Tea Leaves – Indicators Flagging a Potential Rally
Experienced market analysts often rely on a combination of technical and on-chain indicators to gauge market sentiment and predict future price movements. Recently, several reports have highlighted specific indicators whose current state mirrors conditions observed just before previous major Bitcoin bull runs. While the exact proprietary indicators used by every analyst vary, common themes emerge:
• On-Chain Metrics: These look at the activity happening directly on the Bitcoin blockchain. Key metrics often cited include:
o Supply Dynamics: Tracking the amount of Bitcoin held by long-term holders versus short-term speculators. An increase in long-term holding often suggests accumulation and reduced selling pressure. Metrics like "Supply Last Active 1+ Years Ago" reaching high levels can indicate strong conviction among holders.
o Network Activity: While not always a direct price predictor, sustained growth in active addresses or transaction counts can signal underlying adoption and utility growth.
o Profit/Loss Indicators: Metrics like Net Unrealized Profit/Loss (NUPL) or Spent Output Profit Ratio (SOPR) help gauge whether the market is overheated or potentially finding a bottom. A shift from capitulation (heavy losses) towards profitability can be a bullish sign.
• Technical Indicators: These are derived from price and volume data.
o Moving Averages: Crossovers of key moving averages (e.g., the 50-day moving average crossing above the 200-day moving average, known as a "Golden Cross") are classic bullish signals for many traders. The positioning of price relative to these averages is also crucial.
o Momentum Oscillators: Indicators like the Relative Strength Index (RSI) and the Moving Average Convergence Divergence (MACD) measure the speed and change of price movements. Emerging from oversold conditions or showing bullish divergences can signal strengthening momentum.
• Market Sentiment Indicators: While harder to quantify, tools analyzing social media sentiment, futures market positioning (funding rates, open interest), and options market data (put/call ratios) can provide clues about the prevailing mood among traders.
The core argument presented by analysts is that a confluence of these diverse indicators, many of which have strong historical track records in predicting Bitcoin rallies, are simultaneously aligning in a bullish formation. It's not just one signal, but a pattern across multiple datasets suggesting that the groundwork for a significant upward move is being laid. This historical resonance provides a powerful argument for those anticipating a break towards previous highs.
Part 2: The Confirmed Local Bottom – Building a Foundation for Growth?
Complementing the forward-looking indicators is the assertion that Bitcoin has successfully established a "local bottom." This implies that a recent period of price decline has concluded, and a new support level has been found from which price can potentially rebound. Confirmation of a bottom is often a multi-step process:
1. Price Action: A clear cessation of the downtrend, often marked by a specific low point that holds despite retests. This might involve candlestick patterns indicating reversal (like hammers or engulfing patterns) or the formation of a sideways consolidation range after a fall.
2. Volume: Capitulation volume (a spike in selling volume near the low) followed by declining volume during consolidation, and then potentially increasing volume on upward moves, can support the idea of a bottom.
3. Indicator Confirmation: Technical indicators like the RSI moving out of oversold territory (<30) or MACD showing a bullish crossover below the zero line often accompany bottom formations.
4. Holding Key Support: The price successfully defending a significant historical support level or a key Fibonacci retracement level adds weight to the bottoming argument.
The claim that "all indicators flash bullish" in conjunction with a confirmed local bottom suggests a powerful technical setup. It implies that the selling pressure that drove the price down has exhausted itself, buyers are stepping back in at these levels, and multiple technical measures are signaling renewed upward momentum. Establishing a firm bottom is crucial; without it, any rally attempt could be short-lived. This confirmed base provides psychological reassurance to bulls and a defined level for risk management (placing stop-losses below the confirmed low). The question then shifts from "Will it stop falling?" to "Where is the price headed next?"
Part 3: The Great Crypto Decoupling – Bitcoin Forges Its Own Path
One of the most significant market structure shifts observed over the past year is the growing divergence between Bitcoin and the broader altcoin market. Historically, Bitcoin often acted as the tide lifting all crypto boats; when Bitcoin rallied, altcoins typically followed, often with even greater percentage gains (and vice-versa). However, recent data points to a stark change:
• Record Market Cap Gap: The difference in total market capitalization between Bitcoin and the entire altcoin sector has reportedly reached its largest point ever. This signifies that capital inflows are disproportionately favoring Bitcoin.
• Performance Divergence: While Bitcoin has made significant strides, reclaiming substantial portions of its previous losses and challenging key resistance levels, many altcoins have lagged considerably. Some have even continued to trend downwards relative to both the US Dollar and Bitcoin itself.
• Shift from Tandem Movement: The lockstep correlation that characterized previous cycles appears broken, or at least significantly weakened. Bitcoin is charting a course influenced more by its own specific drivers than by the general sentiment across the entire crypto asset class.
•
Several factors likely contribute to this decoupling:
• Institutional Adoption & ETFs: The launch and success of spot Bitcoin ETFs in the US (and similar products elsewhere) have provided a regulated, accessible channel for institutional capital to flow directly into Bitcoin. This capital is often focused solely on Bitcoin as a digital store of value or portfolio diversifier, largely ignoring the more speculative altcoin market.
• Narrative Strength: Bitcoin's core narrative as "digital gold" – a decentralized, scarce, censorship-resistant store of value – has gained traction, particularly in environments of macroeconomic uncertainty or inflation concerns. This narrative is unique to Bitcoin and doesn't necessarily extend to most altcoins, which often have different value propositions (utility tokens, DeFi platforms, etc.).
• Regulatory Clarity (Relative): While regulatory landscapes are still evolving globally, Bitcoin generally enjoys a greater degree of regulatory clarity (often classified as a commodity in key jurisdictions like the US) compared to many altcoins, which face ongoing scrutiny regarding their potential classification as securities. This perceived lower regulatory risk can make Bitcoin more attractive to cautious investors.
• Flight to Quality: During periods of market uncertainty or following negative events within the broader crypto space (like exchange collapses or protocol exploits), investors may rotate capital from riskier altcoins into the perceived safety and established network effect of Bitcoin.
•
This decoupling has profound implications. For investors, it means diversification within the crypto space is becoming more complex; owning altcoins is no longer a guaranteed way to amplify Bitcoin's gains. For Bitcoin, it suggests a maturation of its asset class status, attracting capital based on its unique properties rather than just general crypto market sentiment. This potentially makes Bitcoin's price action more robust and less susceptible to negative developments in obscure corners of the altcoin market.
Part 4: Mining Difficulty Adjustment – A Breather for the Network's Backbone
The Bitcoin network's health and security rely on miners who dedicate vast computational power to validating transactions and adding new blocks to the blockchain. The "Difficulty" is a crucial network parameter that automatically adjusts roughly every two weeks (every 2016 blocks) to ensure that new blocks are found, on average, every 10 minutes, regardless of how much total mining power (hash rate) is connected to the network.
• How it Works: If blocks are being found too quickly (more hash rate online), the difficulty increases, making it harder to find the next block. If blocks are being found too slowly (hash rate has dropped), the difficulty decreases, making it easier.
• Recent Trend: The report notes that difficulty had increased in the four previous adjustments, indicating a sustained rise in the total hash rate competing on the network.
• Expected Drop: Now, on-chain data forecasts an almost 5% drop in difficulty for the upcoming adjustment. This implies that a noticeable amount of hash rate has recently come offline.
•
Why might hash rate decrease, leading to a difficulty drop?
• Profitability Squeeze: Mining profitability is determined by the price of Bitcoin, the miner's electricity costs, the efficiency of their mining hardware (ASICs), and the current network difficulty. If Bitcoin's price stagnates or drops while difficulty remains high (or energy costs rise), less efficient miners or those with higher operating costs may become unprofitable and shut down their rigs.
• Hardware Cycles: Older generation ASICs become obsolete as newer, more efficient models are released. A difficulty drop might reflect a temporary lull before newer hardware is fully deployed or older hardware being permanently retired.
• External Factors: Regional energy price fluctuations, regulatory changes affecting mining operations in certain areas, or even extreme weather events impacting large mining facilities can temporarily reduce the global hash rate.
What are the implications of a difficulty drop?
• A Break for Miners: For the remaining miners, a lower difficulty means they have a slightly higher chance of finding the next block with the same amount of hash power. This can improve their profitability, potentially reducing the need for them to sell mined Bitcoin immediately to cover operational expenses. Reduced selling pressure from miners is generally considered a positive market factor.
• Network Self-Regulation: It demonstrates the robustness of Bitcoin's design – the network automatically adjusts to maintain its target block time, ensuring consistent transaction processing regardless of fluctuations in mining participation.
• Not Necessarily Bearish: While a significant drop could signal miner capitulation in a deep bear market, a moderate drop after a period of sustained increases might simply be a healthy cooldown or consolidation phase in hash rate growth, allowing the ecosystem to adjust.
This expected difficulty drop, therefore, provides a welcome respite for miners, potentially easing selling pressure and showcasing the network's adaptive capabilities.
Part 5: Technical Signals and Historical Echoes – Stochastic RSI, Taker Ratio, and the Gold Fractal
Beyond the broader indicators and market dynamics, specific technical signals and historical chart patterns are adding fuel to the bullish fire:
• Bitcoin Stochastic RSI: The Stochastic RSI is a momentum indicator that uses RSI values (rather than price) within a stochastic oscillator formula. It ranges between 0 and 100 and is used to identify overbought and oversold conditions, but often more effectively in identifying strengthening momentum. A signal suggesting "brewing bullish momentum" likely means the Stochastic RSI is rising from oversold levels or showing a bullish crossover, indicating that underlying momentum (as measured by RSI) is accelerating upwards. Such signals often precede periods of strong price appreciation.
• Taker Buy/Sell Ratio (Binance): This ratio measures the aggression of buyers versus sellers executing market orders (takers) on a specific exchange (in this case, Binance, a major hub for crypto trading). A "sharp increase" in the Taker Buy Ratio (or Buy/Sell Ratio) signifies that buyers are aggressively hitting the ask price to acquire Bitcoin, willing to pay the market price rather than waiting for their limit orders to be filled. This indicates strong immediate demand and buying pressure, often interpreted as a bullish signal suggesting conviction among buyers.
• Bitcoin Mirroring Gold's Breakout Structure: This is a fascinating observation based on fractal analysis – the idea that chart patterns can repeat themselves across different time scales and different assets. The claim is that Bitcoin's current price structure (consolidation patterns, corrections, subsequent recovery) closely resembles the structure Gold exhibited before one of its major historical breakouts. If this fractal pattern holds true, it suggests Bitcoin might be in the final stages of consolidation before a significant upward move, mirroring Gold's past trajectory. This analysis leads to the specific, albeit highly speculative, prediction of a potential new ATH occurring in Q2 2025. While historical parallels are not guarantees, they provide a compelling narrative and roadmap for traders looking for historical context.
• Sandwiched Between Support & Resistance: This describes the immediate technical battleground. Bitcoin's price is currently caught in a range defined by a significant support level below (a price floor where buying interest has previously emerged) and a major resistance level above (a price ceiling where selling pressure has previously intensified). The outcome of this battle is critical. Can the bulls, bolstered by the positive indicators and dynamics discussed, muster enough strength to break decisively above resistance? Or will the bears successfully defend that level, potentially leading to another rejection or further consolidation? This price zone represents the current line in the sand.
Part 6: Synthesis and Outlook – Weighing the Evidence for a New ATH
Synthesizing these diverse factors paints a complex but potentially bullish picture for Bitcoin:
• The Bullish Case: Multiple historically reliable indicators are signaling conditions that preceded past rallies. A local bottom appears confirmed, providing a stable base. Bitcoin is increasingly decoupling from the riskier altcoin market, potentially attracting more focused institutional capital via ETFs. A looming drop in mining difficulty could ease selling pressure from miners. Specific technical indicators like the Stochastic RSI and Taker Buy/Sell Ratio point towards growing buying momentum and aggression. Furthermore, a compelling (though speculative) historical parallel with Gold's breakout structure offers a potential roadmap towards a new ATH, perhaps by Q2 2025.
• The Hurdles and Risks: Despite the bullish signals, significant resistance levels lie ahead, representing areas where sellers have previously overwhelmed buyers. Macroeconomic uncertainty (inflation, interest rates, geopolitical events) can always impact risk assets like Bitcoin. Regulatory developments, while potentially clarifying for Bitcoin, remain a source of potential volatility. The crypto market is inherently volatile, and unforeseen events ("black swans") can rapidly alter market sentiment. The Gold fractal is a historical observation, not a guarantee.
Conclusion:
Bitcoin currently stands at a fascinating juncture. The confluence of bullish indicators flagged by analysts, the apparent confirmation of a local bottom, the significant decoupling from altcoins driven partly by institutional flows, the potential easing of pressure on miners via a difficulty drop, and specific technical signals like the Stochastic RSI and Taker Buy Ratio collectively build a strong case for optimism. The comparison to Gold's historical breakout adds another layer of intrigue, offering a specific (though speculative) timeline for a potential new All-Time High.
However, optimism must be tempered with caution. Major resistance levels loom large, representing the immediate challenge for bulls. The broader macroeconomic and regulatory environments remain key variables. While the indicators suggest brewing momentum and historical patterns offer encouraging parallels, breaking through established resistance and embarking on a sustained rally towards a new ATH is never a certainty in the volatile world of cryptocurrency.
The coming weeks and months will be crucial in determining whether the bullish signals translate into decisive price action. Can the bulls overcome the resistance that currently sandwiches the price? Will the decoupling trend continue to funnel capital into Bitcoin? Will the mining landscape stabilize favorably? The answers to these questions will likely determine if the whispers of an incoming ATH, potentially mirroring Gold's path towards Q2 2025, become a roar or fade back into the market noise. The stage seems set, the indicators are aligning, but the final act is yet to be written.

$100k Bitcoin IMMINENT? Price Ignites After Major Surge!The cryptocurrency market is once again crackling with energy, and at the heart of the storm stands Bitcoin (BTC). The world's largest and original cryptocurrency is staging a remarkable comeback, shattering recent resistance levels and reigniting fervent speculation about its potential to not only revisit but decisively conquer the psychologically potent $100,000 milestone. Following a period of consolidation and downward pressure, a powerful surge has propelled Bitcoin to its highest price point in over ten weeks, signaling a potential paradigm shift in market sentiment and trading behavior.
The Breakout: Shaking Off Recent Slumber
The recent price action has been decisive. Bitcoin climbed as much as 3.1% to achieve a weekly high of $97,483. This marks the most robust price level observed since February 21st, representing a significant break from the sideways and sometimes downward trajectory that characterized parts of the preceding weeks. The memory of Bitcoin crossing the $100,000 threshold on February 7th is still fresh, adding weight to the current push towards that level.
This upward momentum provides a stark contrast to the market conditions seen earlier. There is downward pressure attributed to geopolitical factors and economic policies, such as potential tariff implementations, which had previously triggered sell-offs impacting both traditional stock markets and the digital asset space. Furthermore, the market had to digest a significant correction following Bitcoin's earlier peak. While the specifics of past peaks can be debated based on different exchange data, the narrative of a significant pullback followed by the current strong recovery is clear. Bitcoin weathered a period where it seemed momentum might stall, but the bulls have evidently returned with renewed vigor.
Shifting Market Dynamics: From Macro-Driven to Momentum-Fueled
Perhaps one of the most crucial insights from the current rally is the apparent shift in what's driving price action. For much of the past year or two, Bitcoin's price movements often seemed heavily correlated with macroeconomic factors – inflation data releases, central bank interest rate decisions, geopolitical tensions, and regulatory pronouncements. While these factors undoubtedly still play a role, the current surge suggests a transition towards a market more heavily influenced by internal dynamics: spot market demand and trading momentum.
There are traders who are increasingly reacting to price action itself, buying into strength and potentially creating a self-reinforcing cycle. The focus is less on predicting the next Federal Reserve move and more on the immediate supply and demand dynamics visible on exchanges.
Bitcoin isn't entirely decoupled from macro trends, but its internal market structure, particularly the influence of new financial instruments like ETFs and strong spot buying, is asserting greater influence on short-to-medium term price discovery.
The ETF Factor: Opening the Floodgates for Capital
The launch and subsequent success of spot Bitcoin ETFs in the United States have been a game-changer, and their impact is arguably a primary catalyst for the current bullishness. These regulated investment vehicles provide traditional investors and institutions with a familiar and accessible way to gain exposure to Bitcoin without directly holding the underlying asset. The result has been a torrent of new capital flowing into the market.
There has been a staggering inflow of over $3.2 billion entering Bitcoin and Ethereum tracking ETFs in the preceding week alone. BlackRock's Bitcoin Trust ETF (IBIT), a major player in the space, recorded nearly $1.5 billion in inflows during that period, marking its highest weekly intake for the year according to Bloomberg data.
These inflows are not just numbers on a spreadsheet; they translate directly into buying pressure in the spot market. ETF issuers must purchase actual Bitcoin to back the shares they issue to investors. This sustained, large-scale buying provides a powerful tailwind for the price, absorbing sell orders and driving the market upwards. The success of these ETFs also lends legitimacy to Bitcoin as an asset class, potentially encouraging further adoption and investment from previously hesitant institutional players. The "demand" aspect of the current rally is heavily underpinned by this ongoing ETF phenomenon.
Options Market Signals: Betting Big on $100,000
Further evidence of the bullish sentiment surrounding Bitcoin, particularly the $100,000 target, comes from the derivatives market, specifically options trading. Options contracts give traders the right, but not the obligation, to buy (call option) or sell (put option) an asset at a specific price (strike price) before a certain expiration date.
According to data from Coinglass and the major crypto options exchange Deribit, demand for upside options has surged. Notably, call options with a $100,000 strike price exhibit the most significant open interest across various expiration dates. Open interest represents the total number of outstanding contracts that have not yet been settled. High open interest in $100k call options indicates that a large number of traders are positioning themselves to profit from Bitcoin reaching or exceeding this level. While options data reflects expectations rather than guarantees, such concentrated betting on a specific upside target underscores the powerful psychological pull of the $100k mark and the conviction held by a significant segment of the market.
Warming Up: Reading the Technical and On-Chain Pre-Rally Signals
Beyond the ETF flows and options market sentiment, analysts are pointing to various technical and on-chain indicators suggesting Bitcoin is indeed "warming up" for a potentially larger move, exhibiting signals seen before previous major breakouts. This aligns with the theme of "Bitcoin Flashing Pre-Rally Signals Seen Before Major 2024 Breakouts."
• Technical Analysis:
o Breaking Resistance: The surge above the 10-week high ($97,483) was a critical technical breakout, overcoming a level that had previously capped price advances. Holding above this level turns former resistance into potential support.
o Moving Averages: Traders watch moving averages closely. A "Golden Cross" (where a shorter-term moving average, like the 50-day, crosses above a longer-term one, like the 200-day) is often considered a strong long-term bullish signal. While specific configurations vary, bullish alignment of key moving averages often precedes sustained rallies.
o Momentum Indicators: Indicators like the Relative Strength Index (RSI) and Moving Average Convergence Divergence (MACD) can signal building momentum. An RSI breaking above key levels without yet reaching extremely overbought territory, or a bullish MACD crossover, can suggest further upside potential.
o Volume Confirmation: Crucially, significant price breakouts should ideally be accompanied by strong trading volume, indicating conviction behind the move. Analysts look for volume confirmation to validate the strength of the rally.
• On-Chain Analysis: On-chain data provides insights into the behavior of Bitcoin holders and network activity.
o Exchange Outflows: Sustained periods where more Bitcoin is withdrawn from exchanges than deposited often suggest investors are moving coins to private wallets for long-term holding ("HODLing"), reducing the immediately available supply for sale.
o Accumulation Trends: Metrics tracking the behavior of large holders ("whales") and long-term holders can reveal accumulation patterns. Increased buying from these cohorts is typically seen as bullish.
o Supply Dynamics: Indicators looking at the supply held by short-term versus long-term holders, or metrics like the Long-Term Holder Spent Output Profit Ratio (LTH-SOPR), can gauge whether significant profit-taking is occurring that could stall a rally. A low LTH-SOPR might suggest long-term holders are not yet selling aggressively.
o Funding Rates: In the perpetual futures market, positive funding rates generally indicate that traders holding long positions are paying those holding short positions, suggesting a bullish bias in the derivatives space.
When multiple technical and on-chain indicators align, as some analysts suggest is happening now, it builds a stronger case that the market is preparing for a significant move, lending credence to the "pre-rally signals" narrative.
Mapping the Path to $100k and Beyond: Three Potential Scenarios
While the current momentum is palpable, the path forward is never certain. Analysts are mapping various possibilities, acknowledging both the bullish potential and the inherent risks. Here are three broad scenarios that could unfold:
1. The Momentum Continuation Scenario: Fueled by continued strong ETF inflows, positive market sentiment amplified by the $100k narrative, and potentially favorable (or at least neutral) macroeconomic developments, Bitcoin continues its ascent relatively unimpeded. It decisively breaks the $100,000 barrier, potentially triggering a wave of Fear Of Missing Out (FOMO) from retail investors and further institutional interest. In this scenario, the market quickly looks towards higher targets, exploring price discovery in uncharted territory above $100k (or above its previous ATH depending on the data source used). Key challenges would be maintaining buying pressure and overcoming psychological resistance levels beyond $100k.
2. The Consolidation and Recharge Scenario: Bitcoin's rally meets significant resistance near or just below the $100,000 level. Profit-taking increases, and early ETF buyers might look to secure gains. Instead of a sharp rejection, the price enters a period of consolidation – trading sideways within a defined range or experiencing a moderate pullback. This phase allows the market to digest recent gains, build a stronger base of support (potentially around the recent breakout level near GETTEX:97K or slightly lower), and allows moving averages to catch up. If support holds and buying demand re-emerges (perhaps triggered by fresh ETF inflows or positive news), this consolidation could form the launchpad for the next sustained leg up towards and beyond $100k. This scenario tests the resilience of the buyers.
3. The Macro Headwind or Correction Scenario: Despite the strong internal dynamics, external factors reassert control. An unexpected negative catalyst emerges – perhaps significantly worse-than-expected inflation data forcing a hawkish central bank response, a major geopolitical escalation, unforeseen regulatory action against crypto, or a sharp downturn in traditional markets triggering widespread risk-off sentiment. Alternatively, the rally could simply run out of steam, hitting a "sell wall" at $100k that overwhelms buying pressure, leading to a sharper correction back towards lower support levels ($90k, $85k, or even lower). This scenario underscores the ever-present volatility and risk in the crypto market, reminding investors that parabolic runs can face abrupt reversals.
The Crucial Question: Can BTC Buying Demand Meet the Challenge?
Ultimately, whether Bitcoin successfully retests and surpasses $100,000 hinges on the sustainability of the current buying demand. Several factors support continued demand:
• Ongoing ETF Flows: As long as institutions and retail investors continue allocating capital to spot Bitcoin ETFs, this provides a consistent source of buying pressure.
• Growing Adoption Narrative: Each price surge and new institutional product launch reinforces the narrative of Bitcoin's growing acceptance and potential role as a store of value or portfolio diversifier.
• Halving Effect (Long-Term): While the Bitcoin Halving (reduction in new supply issuance) is a past event, its long-term supply-constricting effects are believed by many to contribute to price appreciation over time.
• Potential Retail FOMO: A decisive break above $100k could capture mainstream media attention and trigger a wave of buying from retail investors fearing they might miss out on further gains.
However, potential headwinds exist:
• Profit-Taking: Investors who bought at lower levels, including early ETF participants, may look to lock in substantial profits as the price approaches major milestones.
• Regulatory Uncertainty: While ETFs marked progress, the broader regulatory landscape for crypto remains complex and subject to change globally.
• Macroeconomic Risks: Inflation, interest rates, and potential recessionary fears haven't disappeared and could resurface to dampen risk appetite.
• Market Saturation/Exhaustion: Rallies can lose momentum if buying power becomes exhausted without fresh catalysts.
The interplay between these forces will determine if the current buying wave has the strength and endurance to overcome sell pressure and propel Bitcoin into six-figure territory sustainably.
Conclusion: A Critical Juncture for Bitcoin
Bitcoin stands at a fascinating and potentially pivotal juncture. The recent surge, breaking a 10-week high and pushing towards the $100,000 horizon, is fueled by a powerful combination of factors unlike those seen in previous cycles. The institutional validation and massive capital inflows brought by spot Bitcoin ETFs represent a fundamental shift, seemingly driving a transition towards momentum and spot-demand-based trading. Bullish signals from the options market and various technical/on-chain indicators add fuel to the fire, painting a picture of a market "warming up" for potentially significant further gains.
Yet, the path to $100,000 and beyond is fraught with challenges. Market history teaches that parabolic advances often face corrections, and the ever-present risks of macroeconomic shifts and regulatory developments cannot be ignored. The sustainability of the current buying frenzy, particularly the crucial ETF inflows, will be rigorously tested as Bitcoin confronts the immense psychological and technical resistance clustered around the six-figure mark.
Whether Bitcoin achieves a swift breakout, undergoes a period of consolidation, or faces a pullback remains to be seen. However, the current price action and underlying market dynamics have undeniably reignited excitement and placed the $100,000 target firmly back in the spotlight, marking a critical chapter in Bitcoin's ongoing evolution within the global financial ecosystem. Investors and observers alike will be watching intently to see if the current surge has the power to meet the demand challenge and etch a new all-time high into the history books.
Disclaimer: The information presented in this article is for informational and educational purposes only. It is based on the analysis of the provided source material and general market knowledge. It does not constitute financial advice. Investing in cryptocurrencies involves significant risk, including the potential loss of principal. Readers should conduct their own thorough research and consult with a qualified financial advisor before making any investment decisions.

Bitcoin Testing 95k as Resistance TRENDLINE #Bitcoin at a CRITICAL juncture! Testing the downward trendline (double yellow) at 95K as resistance, originating from 107K in Dec.
This trendline has repeatedly rejected BTC, with multiple tests at 95K this week. Historically, rejections have led to drops to 82K support (tested 4x) or even the uptrend line at 77K (Mar/early Apr).
If BTC fails to break & hold above 95K by week's close, we may retest 82K on the 2023 uptrend (red line). BUT, if we break 95K and hold, we could target 109K, with a potential range of 125K-140K for new highs!
#Crypto #BTC #TechnicalAnalysis

Bitcoin's Next TargetBTC starts the week with a 4H doji, potentially signaling a reversal of the short term retracement from local Hs around $95.4k.
Reclaiming those Hs can easily lead to a retest of Feb's resistance around $98.7k - or even surprise us with a test of $102k.
A loss of momentum and close below GETTEX:92K could signal weakness.

BTCUSDT Long-Term Projection – Accumulation Before Breakout?BINANCE:BTCUSDT.P is currently in an accumulation phase, following historical liquidity grabs and retracements. The chart highlights key liquidity zones, Fibonacci levels, and potential price movements.
🔑 Key Observations:
Possible Accumulation Phase between $88,000 - $97,000 before a bullish move.
nPOC ($97,148) is a critical level—price may revisit before moving higher.
Liquidity Zones: 1-week, 1-month, and 3-month liquidity targets identified.
Fibonacci Levels: Watching the 0.618 ($96,965) and 0.786 ( $93,422 ) retracement levels for a potential dip-buy opportunity.
Long-Term Target: $120,000+ by the end of 2025.
💡 Will BTC accumulate before making a strong push to new highs? Let me know your thoughts in the comments! 🚀📈

#Bitcoin update , 100K or 88k?#Bitcoin has moved exactly as we anticipated over the past 36 hours.
The real test comes: BTC must break above $95,700 to target the $100K milestone.
This level also marks a major distribution zone on the lower timeframes, making it a tough but not impossible barrier to overcome.
⚡ If BTC gets rejected here, expect a potential revisit to sub-$90K levels.
I’ll keep updating this chart as the price action unfolds.
If you found this helpful, bookmark this post and smash the like button to stay in the loop!
Thank you
#PEACE

Bitcoin Cycle Update – Are We Nearing the Peak?Check out this BTCUSDT chart – we’re at GETTEX:92K today, and seems like things are heating up!
▸We’ve seen a Cycle Bottom in late 2022 - early 2023, followed by strong Bull runs in 2023 and 2024.
▸Those Consolidation phases (sideways channels) gave us the perfect setup for massive pumps!
▸Right now, we’re in a Pause Triangle after a big rally – but the Cycle Top could be just around the corner in mid-2025.
▸After that? A potential Bear phase – time to plan your moves!
💡 What’s your strategy? Are you riding this wave to the top, or preparing for the next dip? Let’s discuss 📨

Bitcoin Is Following Our Trading Plan Hello, Skyrexians!
As we told you new impulsive wave to the new ATH has been started below 80k for BINANCE:BTCUSDT and now price found some resistance. Next 2-4 weeks will be very difficult for traders and holders and we will explain you why.
On the 4h time frame we can see the new impulse which shall consists of 5 waves. Awesome oscillator tells us that this is the wave 3 inside this impulse and it can be over because of target area according to Fibonacci. The wave 4 can retrace to FWB:88K and it can happen very soon, but this time altcoins promised to remain strong. The next growth will happen to $94-95k in the wave 5. Dominance can reach our final target at 66%. The further correction to 0.61 Fibonacci below $85k will cause the atlseason and after that altcoins will grow in the very short period of time with the growing Bitcoin.
Best regards,
Skyrexio Team
___________________________________________________________
Please, boost this article and subscribe our page if you like analysis!

BLOODY FEBRUARY TO GREENY SUMMERFrom my initial Technical analysis from 100k down to 74k last february where we at now? so we have filled the CME gap and grabbed some liquidities. Price broke out from the trendline and now we goin to see some green daily/weekly candles to retest the 100k levels. If this fails to make an all time high. 2026 might be the bear market so hold your horses. and ready your capital bois.

BTC Update... What To Expect Now??Currently BTC is facing resistance of major trendline (Blue line)+ wedge resistance+ bearish OB resistance...
For bullish trend, currently Bitcoin have to break above all these resistances along with 89k level for confirmation of bullish trend....
If it fails and retraces back inside Monday high range, then we can expect price dropping below Monday lows where major support level is present+ Bat Harmonic Potential Reversal Zone+ 61.8 Golden Fib Level around 72000-70500 levels.

MAJOR BULL RUN RALLY INCOMING !!! Starting From MAY 2025 !!!On Big Picture starting from 2020....
Inverse H & S was formed... after breakout we got pull back & then it started 8 months rally from September 2020 To April 2021.
Then after deep bear market, we got Inverse H&S... after breakout, we got pull back & then it started 8 months rally from September 2023 To April 2024.
Now. we got big H&S... after breakout, we are getting pull back & now we are almost near at support level of H&S. From around 74-66K region, reversal bull run rally is expected which will most probably start from next month ( May 2025) and around after 8 months (October-December) we would be roaming ATH around 300K !!! which tags exactly at major resistance line. By copy pasting 2021 rally's candles pattern on current scenario, we can see exactly how things are going to shape in upcoming months.
Lets Hope For The Best !!!

Time Has Came For Bitcoin NOW!!!As Updated previously on Macro, We have reached at crucial zone. According to Elliott wave count on big picture, BTC formed ending diagonal and now approaching at it's reversal points. From this area of 75-69k region, there's high probability of trend reversal and we will soon see shorters getting rekt

BITCOIN SEEMS TO FOLLOW THIS PATH TOWARDS 120k !!!According to elliott wave count, If BTC has completed it's macro wave (IV), then we can expect it moving to complete it's macro wave (V).
In this case if recently impulse move is counted as micro wave (i), then we can expect reversal from 81-79K region very soon.
Otherwise, if micro count gets Invalid, then reversal can be expected from up to 76-70k .
Important key level is breakout of 95k which would confirm reverse in trend.

Bitcoin Technical AnalysisFenzoFx—BTC/USD trend outlook is bearish below $88,650.
A break below the immediate support of $81,160 can trigger a new bearish wave, targeting the next support area at $77,850.
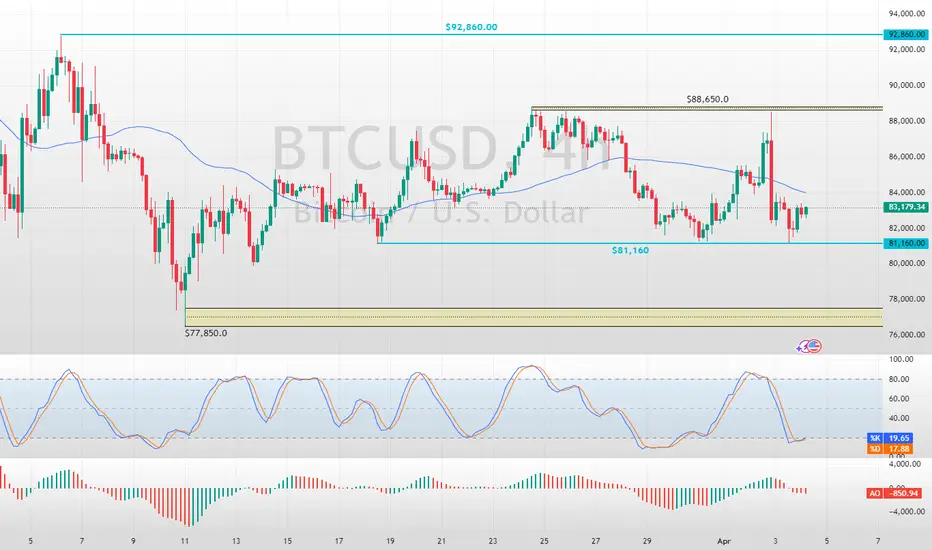
Navigating BTC Volatility Storm: Buy, Hold, or Flee?Bitcoin's recent price action has been reminiscent of a rollercoaster, leaving investors grappling with a whirlwind of conflicting signals. From sharp drops mirroring stock market turmoil to the looming "death cross," the cryptocurrency's trajectory is shrouded in uncertainty. Is this a prime buying opportunity, a warning to retreat, or simply another bout of the volatility that defines Bitcoin?
The past few days have been a stark reminder of Bitcoin's inherent volatility. Reports of an 8% drop, coupled with the US stock market shedding $2 trillion in value, sent ripples through the crypto sphere. The catalyst? Concerns surrounding potential US tariffs and their impact on the global economic outlook. This sudden shift in market sentiment triggered a sell-off, reminiscent of the COVID-19 crash in 2020, during which Bitcoin’s pre-pandemic gains evaporated.
Adding to the unease is the looming "death cross," a technical indicator that occurs when the 50-day moving average crosses below the 200-day moving average. Historically, this pattern has signaled bearish momentum. The 2022 death cross, for example, precipitated a significant price drop of nearly 20%. Conversely, "golden crosses," where the 50-day moving average crosses above the 200-day moving average, have historically signaled bullish momentum, triggering rallies of over 500% in 2020 and 2021.
Currently, Bitcoin's 50-day moving average is edging closer to this critical crossover, prompting widespread speculation. Is this a repeat of 2022, or will the market defy historical patterns? The answer, as always, is complex and contingent on a confluence of factors.
One significant factor is the strength of the US dollar. While the dollar's strength can often negatively impact Bitcoin, the current increase in the money supply could potentially counteract this effect, creating a bullish flag pattern. The dollar's inflation may become a catalyst for Bitcoin as a store of value. The global market dynamics are currently shrouded in uncertainty, making it difficult to predict the long-term impact of these factors.
The recent price drops have pushed Bitcoin towards the $80,000 mark, with some analysts predicting a potential fall to $71,000. However, this level could also represent a "sizeable bounce," acting as a strong support zone for Bitcoin. The concept of an "oversold bounce" also comes into play. After a period of intense selling pressure, markets often experience a relief rally as traders capitalize on discounted prices. Whether this materializes remains to be seen.
Is it a Good Time to Buy Bitcoin?
The decision to buy, hold, or sell Bitcoin depends on an individual's risk tolerance, investment strategy, and understanding of the market. Here's a breakdown to consider:
• For the Long-Term Investor:
o Bitcoin's long-term potential remains a compelling narrative. Its decentralized nature, limited supply, and growing adoption continue to attract institutional and retail investors.
o Price volatility is an inherent part of the Bitcoin journey. Historically, periods of sharp declines have been followed by significant rallies.
o Dollar-cost averaging (DCA) can mitigate the impact of volatility by investing a fixed amount at regular intervals, regardless of the price.1
o The strength of the US dollar may become a catalyst for Bitcoin as a store of value.
• For the Short-Term Trader:
o The current volatility presents opportunities for skilled traders to profit from price swings.
o Technical analysis, including monitoring moving averages and support/resistance levels, is crucial for identifying potential entry and exit points.
o However, short-term trading is inherently risky and requires a deep understanding of market dynamics.
o The "death cross" should be monitored carefully.
• For the Cautious Investor:
o The current market uncertainty may warrant a more conservative approach.
o Diversifying investments across different asset classes can help mitigate risk.
o Staying informed about market developments and avoiding emotional trading decisions is essential.
The Death Cross: A Warning or a False Alarm?
The "death cross" is a significant technical indicator, but it's not a foolproof predictor of future price action. Historical data show that while it can signal bearish trends, it's not always accurate. Market conditions, investor sentiment, and macroeconomic factors can all influence Bitcoin's trajectory.
Ultimately, the Bitcoin market remains highly speculative. The current volatility, driven by a confluence of factors, underscores the importance of careful research, risk management, and a long-term perspective. While the "death cross" and market fluctuations may cause short-term panic, the long-term potential of bitcoin, and it's reaction to the weakening dollar, may still produce long-term gains.
