Big profit - done! BTC/USDT (CME FUTURES)Hello dear traders.
Yesterday's analysis and recommendation gave a good profit.
There is no magic here, only numbers and only CME.
See how exactly the price hit the CME lows!
I expect a fall further, since there are global CME targets, We have a non-closed gap, and the preponderance of the price movement up / down - 29/15
Update $ 10,000.
Yes, I have one negative position.
All my statistics are in the public domain, and here each of my positions is confirmed - both its goals and achievements.
I am not describing the whole analysis of my positions here.
After all, here, I cannot quickly react and describe my every action.
Bitcoinpricetrendanalysis

BTC 4h The last meters to the finish line of insane growth.Steadily and confidently buyers broke the range $15,700-15,800 and continued the movement of the BTC price to $16,480.
Even with increased volumes, sellers cannot change the current situation. The price rises in an unusual manner (impulse, consolidation - impulse).
The critical point of the growth trend has moved from $15,400 to $15,960. Given the slow price growth with local rollbacks, sellers may test this mark. And at this mark the future trend will be solved:
Will there be buyers recharging and whether they will test for strength the level $16,775.
Or they will break down on larger volumes, than with high probability, will begin the trend change.
This weekend is a chance for sellers to seize the initiative. And most likely sellers will try. It is evidenced by the uncertain exit of the price from the 4-day consolidation below $15,800.
On the dominance chart, the figure reached 65.99%. But yesterday's daily candle closed at 65.23%, which began to hint that interest in BTC may sharply fall from next week.
For altcoins , it is important that possible BTC correction occurs without sudden movements. In this case, there will be a possibility of continued growth. Otherwise, we doubt that frightened BTC investors, in a panic, will start buying other coins instead of sitting out in fiat.
And how do you see the current situation?
Is it time for BTC to take a break from such a growth marathon?
Write your opinion in the comments and leave your charts!
___________________________________
Since 2016 , we have been analyzing and trading the cryptocurrency market.
We transform our knowledge, trading moods and experience into ideas. Each " like under the idea" boosts the level of our happiness by 0.05% . If we help you to be calmer and richer - help us to be happier :)

Bitcoin Price Analysis: BTC Bulls Regain Control
Bitcoin renews the uptrend after settling above the 50-day SMA.
BTC is accorded with immense support according to on-chain analysis.
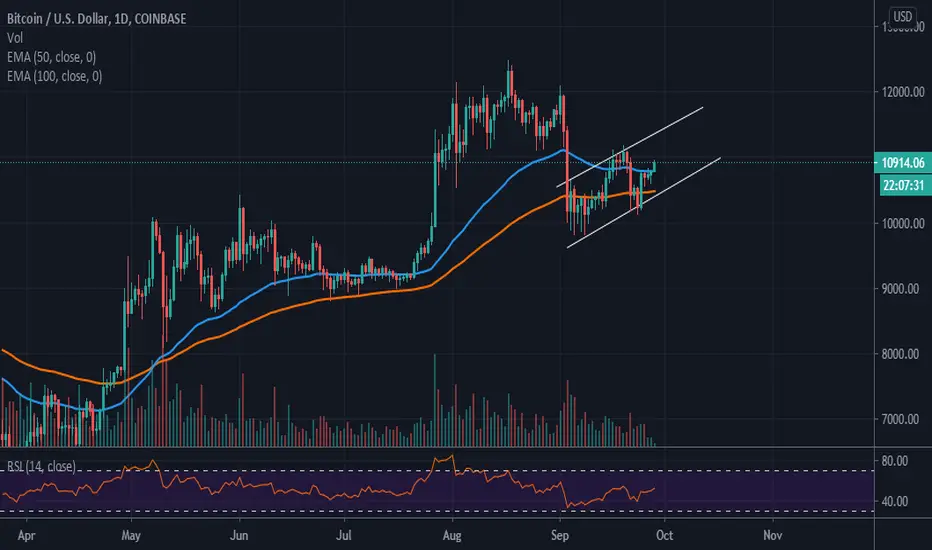
The flagship cryptocurrency is gradually closing in on the coveted $11,000 critical level. Immediate support has been established above the 50-day Simple Moving Average. As Bitcoin settled above the 50 SMA, gains above this vital level are also becoming apparent.
From a technical perspective, the Relative Strength Index (RSI) suggests that the trend is in the hands of the bulls. The RSI has stepped above the midline. Moreover, it is pointing upwards, signaling the potential BTC has in the near term.
It is important the Bitcoin holds above the moving averages. Otherwise, if the parallel ascending channel confirms a bear flag pattern, BTC could succumb to another selloff before recovery takes precedence again. The low trading volume experienced hints that a sizeable number of buyers are not convinced that Bitcoin has the ability to sustain the uptrend.
Consequently, IntoTheBlock's IOMAP model reveals that the road to $12,000 is bound to be a challenging one. However, the toughest resistance lies between $11,586 and $11,914. Here, 1.05 million addresses previously bought 737,540 BTC. A break above this zone would give Bitcoin a quick boost past the psychological resistance at $12,000.
On the downside, the bellwether cryptocurrency is sitting on an area of immense support. For instance, the demand pressure between $10,582 and $10,910 is strong enough to absorb most of the selling pressure in the event of a rejection from current price levels. Here, 1.42 million addresses previously purchased 1.03 million BTC.
Therefore, Bitcoin has a challenging path towards $12,000 but support is also strong enough to hold the price from plunging massively. Consolidation will most likely take precedence in the near term, to set the ground for more gains above $11,000.
Bitcoin Intraday Levels
Spot rate: $10,901
Percentage change: 1.15
Relative change: 124
Trend: Bullish bias
Volatility: Low
Let's Flip a Bitcoin: Bullet Proof Let's see how stable that bottom really is.
As always, this is your signal analyst, Krewbacca_xR.
Shutting down fake analysts left and right with these two hands.

Let's flip a Bitcoin (Mini Series) The DivisionHere again folks, the diamond reversal formation at play.
Two stops, one clear winner, bulls are off to a rough start. Let's see who takes this win home!

Let's Flip a Bitcoin (mini series): Wykeoff's NightmareThere's a lot of analysts supporting this Wykeoff strategy. Perhaps a bit of a clickbait?
Trade Tag: Wykeoff's Nightmare
Position Type: Short
Margin: 1%
Leverage: Cross
Entry: @7950
Exit: @7156

BTC-XBT/USD If you haven't been following me...Hey there Crypto Lovers,
This is another post up by Crypto Gavin. Hope you are all doing well, cause Bitcoin is. If you haven't seen my first post with the next many months worth of predictions in it you need to go back and check that out and look at the difference between then and now with the graphs.
I have removed a lot of the text bubbles as we all know what exactly they are. They are the time markers corresponding to the key dates in 2017's bull run and bubble pop. As you can see we bottomed our downward trend just before Christmas, and as of the 5th of January (which would mark the confirmation of the bubble pop in 2018) has signified the bullish strength that i have been looking for in this market for quite some time now. And look at what we have had, 3-4 days worth of Solid Green Candles launching Bitcoin from the $6750 all the way to the top of $8450!
I had my longs in and i hope you did too. Trust me 3x-5x leverage is plenty when you consider the gains you see overall. DONT OVER-LEVERAGE YOURSELF AND GET STOPPED OUT EARLY OR WORSE... LIQUIDATED.
The Trend is your friend until the end. My Trends have been i would say damn near perfect for 6 months straight. Drops down to the $8050 mark which would be the low end of support that we would like to see and that hold strong and this trend is looking EXTREMELY BULLISH.
Drops down to the $7750-$7950 range would indicate some weakness in the volume and market overall as it would show almost all purchases and trades are being done by HFT bots.
Seeing that we are sticking above the $8300 range for now is holding very nicely but do note that our RSI is overextended now sitting at around the 79-80 mark, 70 indicating overbought.
What i would like to see is this trend cool off a slight bit, give the RSI a chance to come back down into a neutral level while going sideways for a while allowing any profits to be taken by bigger investors plus new orders or dollar cost averaged orders to be filled before a next leg up. I have 3 long orders set from the $8050 mark to the $8300 mark to be filled if we do decide to dip that low that will give me a roughly 3.5x Leverage on the trade and a liquidation point at about -$4k below current market price.
Dont be left out riding that Short Position all the way to Liquidation Town next to whiners-ville. Close it up and Put that Long in because we are in for the next Bull Run!
I will attempt to get another post out every week to keep an updated chart going for you guys.
All the Best,
CryptoGavin
(Remember all of these statements are to be used as educational content and not to be used in any way shape or form as financial advice. I am not a financial advisor, although i do most likely know more about Technical analysis and cryptocurrency than your financial advisor haha)

Let's Flip A Bitcoin Issue #5 DuckTapeTwo trades
Long Entry: $7200
Target: $8100
Short Entry: $ 8300
Target: $5888
Trade Signal: Bearish Inverted Cup and Handle
Trade Time Range: 1 or 2 Months Maturity
Indicator Satoshi's Kode SK

BITCOIN CAN GO DOWN AGAINIf this weekend BTC falls below the threshold of 6200 EUR, most likely, it will continue to fall further and the most important supports are at much lower historical values. Today we are in a test of the demand, but I believe that the market demands a lower price.
Let's see how it goes on the weekend.

BITCOIN CAN GO DOWN AGAINIf this weekend BTC falls below the threshold of 7000USD, most likely, it will continue to fall further and the most important supports are at much lower historical values. Today we are in a test of the demand, but I believe that the market demands a lower price.
Let's see how it goes on the weekend.

BTCEUR - Bear Flag, Short Position (7.150 to 6.080 EUR, -14,56%)BTCEUR - Into Bear Flag, Previsione for a Short Position from 7.150 EUR to 6.080 EUR, (-14,56%)
BTC comes out of a very marked flag of about 73 days.
The output, about the movement that took place later, clearly defined a FLAG POLE and a fairly marked BEAR FLAG is emerging which is now 26 days.
By performing the FIBONACCI tracing on the flag pole and reporting the values on the output FLAG PATTERN you can highlight the TARGET LEVELS of the SHORT POSITION in ENTRY and EXIT.
In the forecast, an imminent exit from the BTC BEAR FLAG is simulated at around 7,150 Eur.
1. Entry into SHORT at 7,150 EUR.
2. Monitoring of historical support at EUR 6,774.
3. Target 1 to 6.080 EUR ÷ Target 2 to 5.611 EUR.
The FIBONACCI tracing signals the target level around EUR 6,080 equal to - 14.56%. Also possible a second target at EUR 5.611 defined by the width of the FLAG POLE.
#surfthetrend #trendsurfer #gabrielestampa #bitcoinpredictions #bitcoinprevision #btceur #bearish #bitcoinbearish #shortposition #bitcoinshort #shortposition

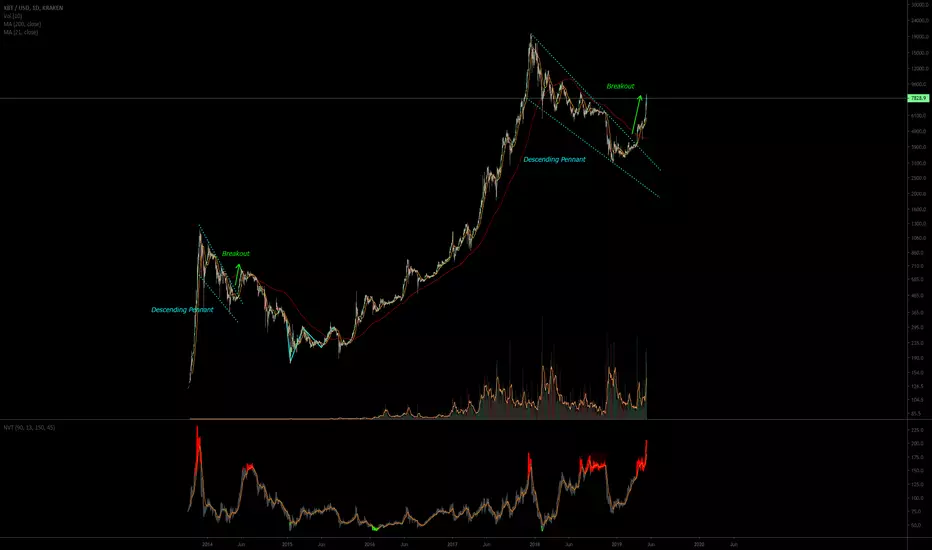
This is why Bitcoin went Parabolic - Technical Analysis Prevails"History repeats itself", as they say - especially in the case of a market as predictable, albeit volatile, as Bitcoin.
During the recent parabolic move in Bitcoin, most indicators have been screaming overbought and calling for a selloff. Despite these warnings, BTC has continued to move higher leaving most people scratching their heads and saying that technical analysis is "broken" and "doesn't work for crypto markets". What is the reason for it? Manipulation by whales? FOMO? Moon bois? Ironically, we can find the answer if we are vigilant and follow the most basic of technical teachings.
As you can see back at the beginning of the 2014 bear market, Bitcoin was in a descending pennant formation, indicated by the dotted blue line. It then broke out as expected, only to give back the entire move and continue forming new lows.
Similar to what happened in 2014, but on a larger scale, Bitcoin has been in a descending pennant formation since January 2018 - though this time the price has been "manipulated" in a way to conceal the descending pennant pattern that was forming. It's my hypothesis that BTC was artifically held up around the $6200 level during the second half of 2018, until it finally collapsed in November. This would also create "fake" resistance around the $6200 level, which would allow BTC to easily pass through it on the way back up. But I digress.
Breakout of the pennant formation around $4000 saw Bitcoin explode upwards in a parabolic move to complete the technical pattern.
So where do we go from here?
Similar to the 2014 bear market, I expect Bitcoin to give back the entire parabolic move to revisit $4000 to $4400. As you can see, the NVT indicator is screaming for a sell off and I believe it will come swiftly.
I do not know where the top is but I would say we are relatively close to it. I do NOT think Bitcoin will continue on as the 2014 bear market did to reach new lows, as we are too far into the bear market cycle.
I am not trading at the moment and awaiting further confirmation of market direction before I enter into any trades.
**WARNING - This is only speculation and does not constitute investment advice. Make trades based on your own analysis and opinions**
UPDATE: Revised Lazy Trader for #Bitcoin profit $11,126,800.14Here are the NEW rules
1. We only use Weekly chart for buy and sell signals
BUY:
Weekly candle must be above the 20MA
Stochastic RSI upward but not above 80
MACD at least 3 histogram bars in a reverse swing buyers momentum
if all rules are met buy on the week start
Sell:
Sell 50% if Stochastic RSI has been above 80 and drops below - sell into the 2nd week of it being triggered
this changes the outcome to $11,126,800.14 from $8,299,810.26
(buy back in if ALL BUY RULES ARE MET)
if the candle closes below the 20MA sell the rest of the 50% or all
#NOTE this can be highly more profitable with a bit of tweakingChanging

Bitcoin testing $3500 , Bullish or Bearin long term trend line it is getting support around $3500 - $3600 , It tested it 3 times in last one month, Tried to break but bounced back if it holds here then we can see quick bounce back if not then we can se downfall to $100 to $200 more from here & we can see it to $3400 - $3200
Again $3750, it is facing resistance in long term trend line , tried to break but couldn't able to sustain thr for long term and felt, Now its like a Ping Pong game or a kind of spring, getting more and more squeezed to the end.
$4000 is a resistance in short trend line and whenever it go thr then get rejected. So need to watch this also and trade, If it breakout after $4k then $4400 - $4850 will be the next resistance
It just broke short trend line and felt from there which is not good sign but if compare to the long trend line BTC getting support which is quite bullish.

Bitcoin Next move, Support, Resistance & Trend ReversalIn this we tried to find out Bitcoin double bottom and what will be the major resistance & support and what will be the point of trend reversal.

BTCUSD been repeating the downtrend retracement at 61.8% fiboFrom the chart, the 61.8% fibonacci level on the downtrend has been acting as the major resistant for bitcoin for the entire year so far. The next 61.8% fibonacci level will be at 6910 which is just around the current downtrend trendline, breaking this resistant could signal a major uptrend move.
Currently strong support at 6000 USD so watch out for the entry around there and HODL if it manages to break the next 61.8% fibo at 6910. Breaking below ~6000 USD could signal a continuation for downtrend, but a failed break low could be a signal for a long position.
I'll remain neutral at the moment and wait to see the price action for either side which should happen pretty soon.

BTC Daily Printed Inverse CandleDaily candle printed an inverse hammer which is a bullish candle.
Could be the start of a reversal back up, to test the upper overall trend line.

Bitcoin might just be relaxing a bit, to continue down further..Bitcoin has shown some strength in the recent days, but it also has no reason to go up, except for a Short Squeeze. Why wouldn't I call it a reversal yet? Cuz we still need to cross previous resistances (as high as 10k) to say we're in bullish territories. Also, the strength if the green candles is quickly sizzling off, and the bears are probably just resting for sometime... I'd look to short in the range of 7800 - 8250.
