COINBASE - My rules say: Down with high probabilityI don't elaborate too much here, because I want to give you a chance to learn something!
As for the Trade, my rules say that it is a good Short.
The Short is not valid anymore, if price open and close above the Upper Extreme!
So, what are the rules?
Well, that's exactly what you will learn today ;-)
Go to my previous post which I will link, and you find everything you need to jump on the Steam-Train if you like.
As my old Mentors always said: "Larn To Earn"
Happy Profits Guys & Gals §8-)
Bitcoinshort
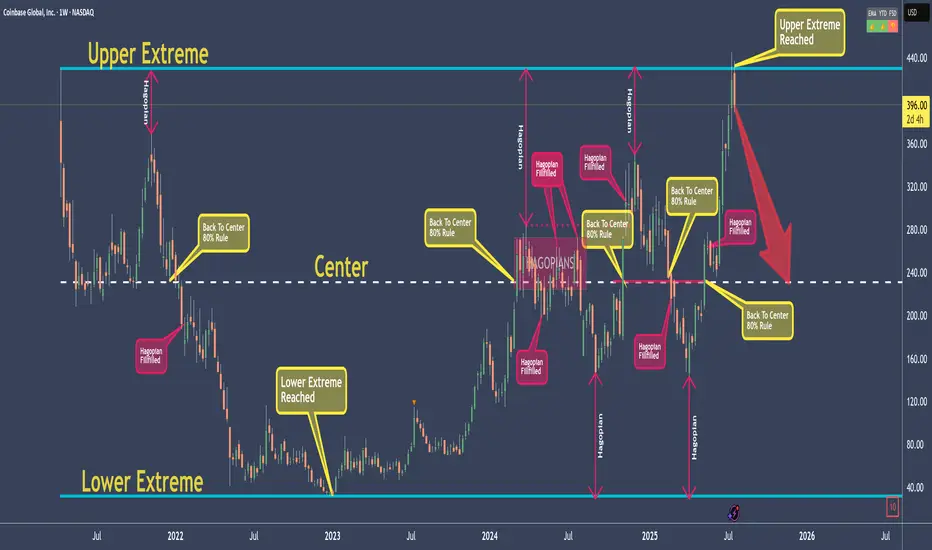
MSTR - Microstrategy Short...for now.The White Fork is created by choosing point A, which must be the lowest price before the swing.
B and C are the natural high and low of the swing we want to measure.
What this gives us is a Pitchfork that projects the most probable path of price.
Additionally, with the three lines that make the Fork, we have the natural extremes above, below, and the center—the mean.
We can see that price started to rise in March 2025.
The 80% rule states that price will reach the Centerline around 80% of the time.
And as we see, it did this time as well. Price reached the CL (Center Line), and immediately the big whales dumped positions.
Then price fell—only to be picked up before reaching the Lower Line, also called the L-MLH or Lower Median Line Parallel.
When price can't make it to this (or any of these) lines, we call this a 'Hagopian,' because it follows 'Hagopian's Rule.' This rule says that if price can't reach 'the line' (the L-MLH in this case), there is a high chance that price will reverse in the previous direction (up in this case), and even go further than where it came from (the Centerline).
And as we see, price indeed traded upwards—beyond where it came from—and overshot the Centerline (CL).
Unfortunately for long-positioned traders, the gas in the goose was empty, and price now starts to head south again, missing the target, which would have been the U-MLH (Upper Median Line Parallel).
So, the open happened below the CL!
If we also see a close this week, I'm ready to initiate a short trade.
Why?
Well, as before, Hagopian’s Rule applies—an indication that price will trade further down than where it came from, which is below $361.
And since we know that the natural target is the Centerline about 80% of the time, we have a heck of a good chance that we’ll be happy campers in a couple of weeks. :-)
With a risk/reward of about 2 to 3, and such a high chance of a profitable trade, I’ll sleep like a baby in the coming weeks.
The trade idea would be cancelled if price closes above the CL this Friday.
Let’s stalk it closely...

USDT.D Showing Troubling Signs of a Market Top SoonIn this video, I revist the USDT.D study I've talked about a few times before showing that when Tether Dominance comes down to this multi-year trendline support (since 2018), that's typically the beginning of a correction.
It's inversely related for obvious reasons. Money flowing out of Bitcoin and crypto flows into stablecoins (Like Tether), so when one is up and peaking, the other is down and correcting.
This video shows the relationship between both, and how we are likely setting up for a near term correction in the coming weeks.
My best guess is we continue to rally hard into early to mid-August, potentially getting close to $150k, followed by a 20-25% correction into September.
The BIG question is...
Will that mark the top, or will get a 2nd (and maybe 3rd) pump to $200k - $245k as my other models have been showing.
Let me know what you think!

BTCUSD - Exhausted? Second time rejected, now down.BTCUSD got rejected at the Centerline the second time. This is super bearish. If it's closing below yesterdays low, that's a clear short signal to me.
Taking 50% gains off the table is never bad. Because then you still have 50% if it's going up further. Otherwise, you got 50% booked.
Don't let gree eat your brain §8-)

BITCOIN CRASH INCOMING!!! (Brace Yourself Now???) I am breaking down MARKETSCOM:BITCOIN and the potential completion of the 4th wave on an leading diagonal which might work as an early warning of a crash towards $93k!
Wait for the confirmations, and play the market with a proper trading strategy that you have backtested enough to be able to say that you will be long-term profitable. That means make sure your trading system is good enough that you always have an edge and a great enough money management system to make sure that you are giving your edge enough space to play out in the long run and be robust against losing streaks!

SHORT ON BITCOINBITCOIN has continue to create lower highs at a major resistance zone.
I will be selling bitcoin looking to make over 8000 to 20,000 points.

BTCUSD 4-Hour Analysis – Sell Setup IdeaCurrently, the trend on BTCUSD is bearish. On the 4-hour chart, I’m watching for a reaction at the Balanced Price Range (BPR) zone. This area aligns with a daily Rebalanced Breaker (-RB), adding higher time frame confluence.
In addition to the BPR, there’s an Order Block (OB) within the same region, and a nearby swing high, which strengthens the case for a bearish reaction. If price respects this zone, I expect continuation to the downside targeting the 98,000 and the 96,000 price level.

Bitcoin Crash to $93k is Progressing Well! But be Careful Now!I have explained the price action of Bitcoin, shared my insights on what will happen next, and updated my previous idea on $BTC!
Smash the rocket button if you feel the Bitcoin bearish vibe!

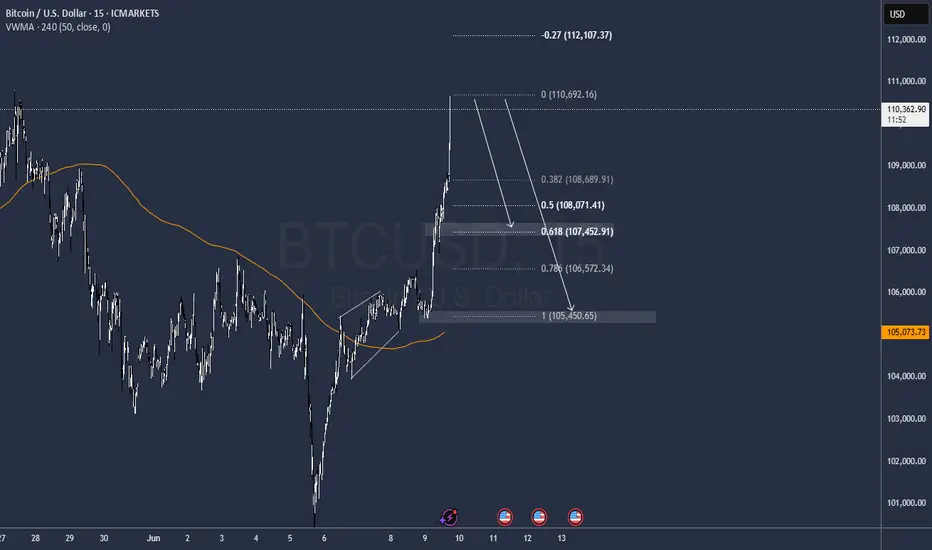
Do technical signals show Bitcoin’s path to $130K? Do technical signals show Bitcoin’s path to $130K?
Bitcoin briefly pushed above $110,000 for the second time this month, before pulling back slightly to trade around $109,500. The market consolidating just below the 61.8% Fibonacci extension level could be suggesting strong resistance is being tested near current levels.
Bitcoin remains within reach of its all-time high at $111,965, set on May 22.
The latest upward move may have been supported by comments from U.S. Commerce Secretary Howard Lutnick, who said trade talks with China in London were progressing well and likely to extend for a third day.
CNBC analyst Todd Gordon expects a breakout toward $130,000 according to his weekly chart analysis. According to our chart, A breakout above 111,897 could open the path to the 78.6% extension around $122,093, followed by the 100% extension target at $135,081

Full Cycle BTC Trendline Mid-2023 to Bull 2025Trendline stretching from mid-2023 lows through the entire bull structure into 2025.
Unbroken since inception
Touched 3+ times
Currently being retested from above
BTC is retesting the primary uptrend
Price dipped below it in April → false breakdown
May-June recovery has reclaimed it
Now sitting right at the trendline, testing it as resistance-turned-support
This is the ultimate decision zone
A daily or weekly close above $110K confirms the trend resumed
Rejection here → opens the door for retrace to $98K–$100K

BTCUSD Breakdown Incoming? 4H Chart Flags Key Bearish Entry🔵 Entry Point (Sell Limit / Market Entry)
• Around $104,600 – $104,700
This area aligns with the retest of the descending trend line and a weak resistance zone. Price is reacting negatively after hitting this level.
🟥 Stop Loss
• $107,060
Placed just above the weak resistance. This protects the trade in case price breaks structure and invalidates the bearish setup.
🟩 Take Profit Targets
1. TP1: $101,818 (Support 1)
o First major support zone; price has bounced here previously.
2. TP2: $98,020 (Support 2)
o Deeper support and more aggressive target. Aligned with previous wick lows.
🔺 Chart Observations
• Trend Line: Still intact and respected. Price rejected it on the latest retest.
• Structure: Lower highs and lower lows show bearish momentum.
• Volume/Volatility: Tapering candles around resistance indicate weakening bullish attempts.
• Risk-to-Reward
o TP1 R:R ≈ 1.3:1
o TP2 R:R ≈ 2.5:1+
⚠️ Scalper Note
If you’re trading this as a scalp, consider securing partial profits at TP1 and moving SL to breakeven to protect gains. Volatility around macro events or news (like the red event icons near June 3–5) could trigger wicks.
Would you like me to add RSI, MACD, or EMA confluence to strengthen the setup further?

BTCUSD SMC Short Play | Fair Value Gap Rejection Ahead?Bitcoin (BTCUSD) Smart Money Sell Opportunity | Liquidity Sweep Setup
Here’s a surgical-level BTCUSD bearish setup unfolding on the 30-minute chart, giving pro traders and learners a textbook SMC opportunity. Let’s break it down:
🔍 1. Trade Idea Summary
This move is a retracement into a premium zone, reacting off a:
✅ Fair Value Gap (FVG) between ~104,300 and 104,600
✅ Strong High at ~105,100 acting as liquidity
✅ Perfect Sell-Side Liquidity Target at ~102,200
Expecting a short retracement play with a clean 1:4+ RRR.
📊 2. Key Zones Marked on Chart:
FVG Zone: 104,259 – 104,600
Strong High (Liquidity Trap): 105,104
Entry Zone: Watch rejection inside FVG or after sweep of Strong High
TP Zone (Sell Side Liquidity): 102,200
SL: Above 105,200
🧩 3. Smart Money Logic Behind This Setup:
Price is in distribution phase, moving within a descending channel
Impulse down created imbalance (FVG) ➝ market now retracing to fill it
Expecting:
Liquidity grab above recent highs
Rejection from FVG zone
Strong push down toward sell side liquidity
⚙️ 4. Trade Execution Plan
Wait for price to enter FVG
Look for:
M5/M15 CHoCH (Change of Character)
Bearish OB or breaker block for sniper entry
Target liquidity zone marked on chart
Trail SL once price breaks below 103,000
📉 5. Market Bias + Risk Tip
HTF Bias: Bearish
Mid-Term Target: 101,800–102,200
❌ Don’t jump early — wait for structure break or FVG reaction
📍 Drop a “🔥” if you’re learning
🧠 Comment “SMC ENTRY” if you caught this setup
📲 Save for later & follow @ChartNinjas88 for daily breakdowns

BTCUSD Trendline Trap? Smart Money Short at FVG
🔍 1. Trade Idea Summary
Trendline gets violated ➝ retail panic
Price retests Fair Value Gap at a premium level
Confluence:
✅ Trendline break liquidity
✅ FVG mitigation
✅ Bearish order block zone
✅ Lower high structure formation
Targeting the weak low sweep around $100,773.
📊 2. Key Chart Levels
Entry Zone: $104,800 – $105,200 (FVG)
Stop Loss: Above $105,209
Take Profit: $100,773 (Weak Low / Sell-side liquidity)
RR: ~1:3+, textbook sniper setup
🧩 3. Smart Money Concept Breakdown
Trendline Break = Liquidity Grab
Price taps into a premium zone FVG + OB
Expecting:
Rejection candle formation
Lower time frame BOS
Sell-side liquidity target @ weak low
This is a setup you can replay again and again — pure institutional footprint.
⚙️ 4. Execution Plan
Monitor retest reaction near FVG zone
Look for M5 or M15 bearish BOS/CHoCH
Refine entry on confirmation
Lock partials near midpoint, TP at weak low sweep
⚔️ 5. Pro Tips:
Trendline breaks are often traps — always check where the liquidity hides
FVGs act like magnets — price often returns to fill the imbalance before real moves
Volume dying into FVG = 🔥 clue for rejection
📉 Comment "BTC Trap Sniper 🎯" if you saw this setup too
🔁 Save this chart for future reference
⚔️ Follow @ChartNinjas88 for more SMC breakdowns & fib-paired traps

BTCUSD Bearish Signal | Technical + Custom AlgoSmart Trend Signal | Technical Analysis + Custom Algorithm
This signal is the result of a combination of classic technical trend analysis and a proprietary software I personally developed.

BITCOIN Bearish Signal | Technical + Custom AlgoSmart Trend Signal | Technical Analysis + Custom Algorithm
This signal is the result of a combination of classic technical trend analysis and a proprietary software I personally developed.

BTC/USDT Analysis. Local Scenario Has Changed
Hello everyone! This is CryptoRobotics trader-analyst with your daily market update.
Yesterday, Bitcoin failed to confirm the bullish scenario above $105,000 and instead entered a natural correction. The volume zone at $104,000–$103,000 mentioned yesterday still hasn't shown any clear positioning.
Currently, the local scenario has shifted. On the 1-hour timeframe, we’ve seen a break in the trend structure. The cumulative delta indicates weakness on the buyers’ side, and just above the current price, there is a zone of absorbed market buys.
Main scenario: a decline toward the nearest support at ~$100,000 (absorbing volume), from where we can consider rejoining the global bullish trend.
Sell Zones:
$105,000–$105,700 (absorption of market buys),
$107,000–$109,000 (volume anomalies).
Buy Zones:
~$100,000 (absorbing volume),
$98,000–$97,200 (local support),
$93,000 level,
$91,500–$90,000 (strong buying imbalance),
$88,100–$87,000 (absorption of market sells),
$85,500–$84,000 (accumulated volume),
$82,700–$81,400 (volume zone),
$74,800 level,
$69,000–$60,600 (accumulated volume).
What do you think — which scenario will play out?
Share your thoughts in the comments — it’s always interesting to compare perspectives!
This publication is not financial advice.

Will it fall? Yes. The reasons are HERE!Reasons why it will drop:
1. hypurrscan.io
This is an insider — take a closer look.
2. Selling pressure during the first attempt to rise.
3. Selling pressure is still ongoing.
4. Very low liquidity ahead. It's easy to push the price down because the rise happened with almost no consolidation.
5. Whoever is applying pressure needs to accumulate cheaper.

Downside for bitcoin around the cornerLooking for a retrace to between 96-97.5k
-Hourly closure above red horizontal line = idea invalidated
-Drop will increase in volatility below red box zone marked on chart
Happy trading!

Bitcoin Short Setup | 30m SMC OB Rejection + Clean RR💣 Bitcoin (BTCUSD) 30-Min SMC Short | May 9, 2025
We just caught BTC’s premium tap into a 30m bearish Order Block, followed by a strong rejection candle. This is a classic Smart Money play, where price fills inefficiency and instantly rejects the institutional footprint.
🔍 KEY CONFLUENCES:
📦 Bearish Order Block tapped at $101,752
📈 Strong bullish impulse followed by hard rejection
🎯 Short from premium into discount zone (~$99,114 target)
🔺 Clean Risk-to-Reward: ~1:5+
💰 High-probability Smart Money setup
📊 Setup Specs:
Timeframe: 30min
Direction: Short
Entry Zone: $101,752
TP: $99,114
SL: ~$102,000
RR: Approx. 1:5+
💡 Trade Logic:
Price made a liquidity grab + FVG fill before tapping a 30min Order Block. The sharp red engulfing candle at the top confirms SMC presence and intention to sell-off. This zone represents premium pricing, ideal for institutional distribution.
🎯 Chart Ninja Note:
“Smart Money never chases price… they wait for the retest where the fear begins.”

BTCUSD | Bearish Rejection from Order Block Zone | Choch Confirm📉 BTCUSD – 30M SMC Breakdown | April 30, 2025
Bitcoin just printed a clean bearish reaction from a high-probability supply zone, aligned with Smart Money tactics.
📍 Technical Breakdown:
Order Block (OB) marked clearly near 95,474 – 95,756, sitting in a premium price zone.
Price returned to this OB after a previous Change of Character (Choch) to the downside — a clear signal of distribution.
The Strong High remains intact — no structural break = institutional control still active.
Rejection wicks and slow momentum near the OB confirm buyer exhaustion.
🎯 Setup Breakdown:
Entry Zone: 95,474 – 95,756
SL: Above 95,800 (invalidates OB)
TP Zone:
TP1: 94,600
TP2: 94,000
TP3: 93,480 (next liquidity pool near the Weak Low)
Risk:Reward ~ 1:3.5+
🧠 Smart Money Insight:
This is where retail traders start buying the breakout — but Smart Money knows better.
They set traps in the OB, then reverse price for maximum stop hunts.
🔁 Market Psychology:
Choch = shift in sentiment
Price retesting OB = liquidity hunt
Weak Low = magnet for future price sweep
This short setup aligns with mitigation + manipulation + distribution.
📌 What to Watch:
If price fails to break Strong High → short bias remains
If we break below 94,600 → hold for full TP at 93,480
Re-entry possible on LTF pullbacks into new internal OBs
🧠 Execution Note:
Be patient — price might dance in OB before melting. Let it reject, confirm, and flow.
🔥 Final Word:
This setup is clean, logical, and follows institutional flow. If you missed the first touch, wait for a lower-timeframe pullback entry.
Smart traders don’t chase price — they let it come to them. 🧘♂️📉
🗣️ Comment “BTC BEAR ZONE” if you caught this short setup.
📥 Save this post — real case study for Smart Money traders.
📡 Share this with your trading group — gems like this don’t show up daily.

$BTC back to $59-62kAs you can see from the chart, BTC is rejecting from the range highs which sets up the next (and final) leg lower before we continue the bull run.
Despite the bounce over the last few weeks, all we've done is retested the area which we broke down from back in February.
Now this sets up a large move lower down to the lower support levels at GETTEX:59K -$62k.
After we tag those levels, we'll continue our next move higher into 2026-2027.

Invert Scale - Bitcoin Expectation at HTFBelieve we go to 81-85K first and then to 106K
Either we take this route through touching 97K or directly from here.
My posisiton is short and I believe we go down directly from here.
