$11,948 in 5 days - 5/05/22According to the VIX Cheat Sheet Indicator the Nasdaq will lose around 2.64% within the next 5 candles.
NASDAQ has broken through the ceiling of a falling trend channel in the medium long term. This indicates a slower falling rate initially, or the start of a more horizontal development. There is no support in the price chart and further decline is indicated. In case of a positive reaction, the index has resistance at 12600 points. The index is assessed as technically negative for the medium long term
Bitcoinshort

BITI - Inverse ETF to short BITCOINThis inverse ETF allows you to short bitcoin. Bitcoin is breaking down from weekly pennant.
You don't need to know what's going to happen next to make money ~Mark Douglas
Lose like a pro and keep trading, or lose like a novice and quit ~Mark Ritchie

In 5 days $18590 Vix Cheat SheatAccording to Vix cheat sheet indicator we are headed down to 18,590 by September 5th.

Bitcoin sell the previous support.Bitcoin - Intraday - We look to Sell at 20769 (stop at 21211)
Our short term bias remains negative.
Preferred trade is to sell into rallies.
Previous support at 20800 now becomes resistance.
50 4hour EMA is at 20840.
Broken out of the channel formation to the downside.
Our profit targets will be 19731 and 19231
Resistance: 20000 / 20800 / 21500
Support: 19500 / 19000 / 18500

$BTCUSD (Bitcoin / USD) - Bear Flag within A Bear Flag$BTC (Daily) vs $BTC (Weekly)
$BTC -9.10% broke down further from the highlighted mini bear flag within its 2nd successive bearish flag formation. $BTC short term MAs have transited to a declining mode, provoking a intraday sell off after resisting price penetration on 26/8/2022

BTC Short Trade Setup - Head and Shoulders Pattern!BINANCE:BTCUSDT INDEX:BTCUSD BYBIT:BTCUSD
This is my short trade setup that I have just taken.
If you missed the trade, wait for a retrace to get in.
Head and Shoulders pattern on the 30m chart with TPO and CVD confirming the trade. CVD looks to be leading price bearish and we have had a failed auction on the TPO chart
Open interest also indicating this is a high probability trade.
All the details in the video
Not Financial Advice. DYOR. Papertrade before trading with real money.
If you liked this idea, please give it a thumbs up and follow. Comment on how you are trading BTC right now.
Safe trading!
Shawn

Bitcoin forecast and ideaPlease write any advice or suggestions.
Dear friends, request any cryptocurrency pair, currencies pair for forex, and any index that you want to be analyzed and ask any questions.
Thanks for your attention

$btc leading diagonal complete? slight truncation here, but feels like we topped.
this is the potential swing macro bullish thesis, which has this most recent move off the bottom as a leading diagonal wave 1.
would lead to abc wave 2 down towards the yearly bottom.
really like this count for now.
short to the lows, anon.

$bear $btc | long way up.finally flipping back to support. the real pump (btc dump) hasn't even started yet.
all shorts are comfy. this should retest the high.
long bear. short corn.


$BTCUSD (Bitcoin / USD)$BTC signs of breakdown from the earlier highlighted bearish flag. 22,500 breached with -6.03% move.
further intraday break at 20,700 will see a an accelerated sell off through the day similar to 9/5/22 (-11.59%) and 13/6/22 (-15.55%)

Bitcoin Analysis 1HBitcoin analysis in 1 hour
Suitable for sale transaction and correction process
Target 22030 and 21153
Stop Loss 25350
BINANCE:BTCUSDT

$btc continued failure at daily cloud topbitcoin with some bruuutal weekend pa. continued attempts at swing high, wiping out stops.
just cant seem to break through the daily cloud. adding confluence to our bearish bias here.

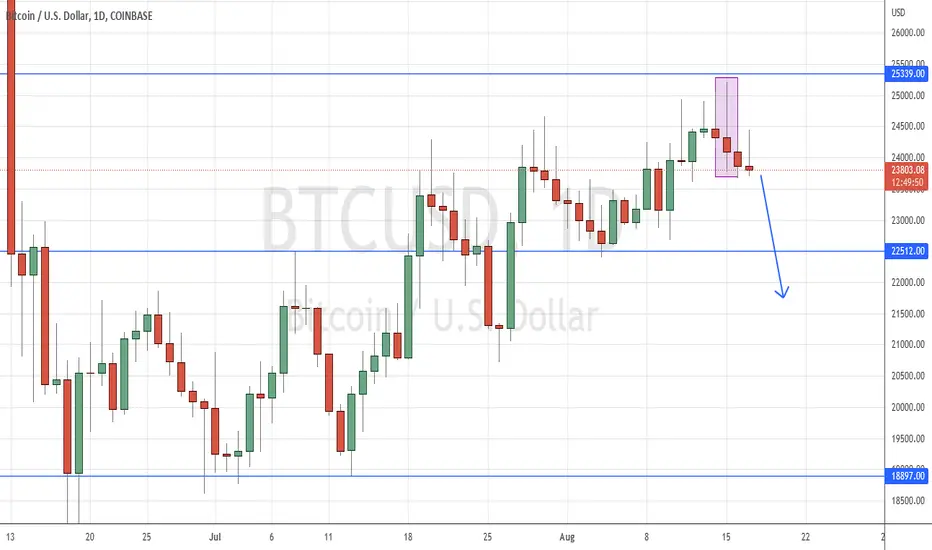
BITCOIN (BTCUSD): Bearish Pin BarBITCOIN (BTCUSD) – Cash
(WARNING ON CRYPTO: TRADING BITCOIN AND CRYPTO IS HIGH RISK, CONSIDER A REDUCED POSITION SIZE AND LOWER LEVERAGE UNTIL YOU ARE FAMILIAR WITH THESE MARKETS).
Price Action: Price formed a Bearish Pin Bar Signal just under the $25339 key resistance level, earlier this week.
The Bearish Pin Bar Signal that had formed on Sunday, August 14th has failed (We did not consider trading this signal, nor did we mention it).
The Bearish Pin Bar Signal that had formed on Thursday, August 11th has failed (We did not consider trading this signal and hopefully saved some members on this market).
Idea: We are considering selling on a retracement higher whilst price remains below the most recent Bearish Pin Bar Signal that had formed just under the $25339 key resistance level, earlier this week.

BTCUSD [BITCOIN USDT]Bitcoin Analysis:
After price drop to strong level of support 24172 level we see bulls take the control and push price to upside toward the strong key level of resistance also hit 25k high where 200EMA restest on Weekly timeframe and in short time frame candle close below 25k and also respect its resistance trend line 24936.
What next in #bitcoin?
Price of bitcoin retest its 200 EMA on weekly time frame and close below the trend line in short timeframe this show bearish market structure also important bearish chart pattern triple top formation show some kind of selling pressure in bitcoin. Also evening star candle stick show bearish sign.
ENTRY SHORT 24800$
TAKE PROFIT 24509$
TAKE PROFIT 24131$
TAKE PROFIT 23667$
STOP LOSS 25300$

#Bitcoin short 12k 🧡💲 Niebawem promocja na #BTC#Bitcoin short 12k 🧡💲. Poszortujemy troszkę. #BTC 12000 USD. Niebawem czas na zakupy :)

Bitcoin Nearing Triple Resistance Bitcoin is nearing a Triple resistance. The Three resistances that it is nearing are:
Resistance 1: Channel Top Resistance of 26766.
Resistance 2: Horizontal Resistance of 29609.
Resistance 3: 200 Days Exponential Moving Average at 31288.
Major Support will be at: 50 Days Exponential Moving Average at 23351.

BTC/USDI'm watching that BTC can come into the demand zone as soon as possible, there's a high chance to BTC will come into the strong demand zone and make a good high again, connect with me for updates.

BITCOIN (BTCUSD) (HIGH PROBABILITY BUY SETUP SOON)Hello traders,
Here we can see clearly the next move for BTCUSD, were using LTF for a clearer view of our analysis, while baring in mind its going to be a BULLISH move (uptrend) BUT were still in a BEARISH market, so we have to keep that in our mind while we trading this BULLISH move,
Keep a close eye on BTCUSD today,
Happy PIP hunting traders

Making a million - wedge on 15M!The price is in a rising wedge. Points 1-4 are formed. Unless the price breaks through the lower ascending black trend line, the price will rise towards point 5. Point 5 is in the orange triangle. Inside the triangle, it it plausible to look at a potential reversal and an entry point to the downside. Thereafter, I will be looking to take TP at point 6.

BTCUSD short ideaSell setup at Fibo retracement golden zone resistance levels towards sell-side liquidity/support level. GL

Bitcoin Sell NowAccording to my chart analysis , bitcoin show strong signal to sell , sell btcusd Now
