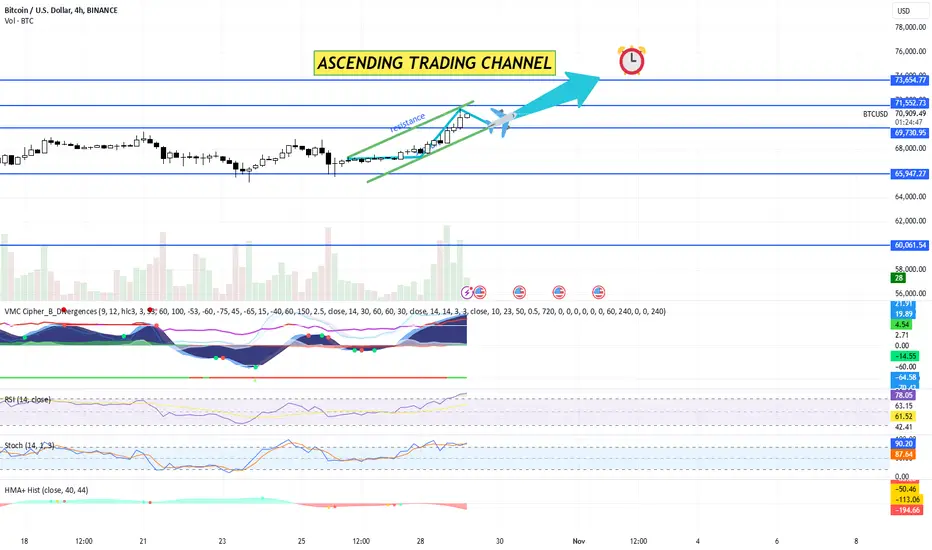
BITCOIN TODAY - STILL THE KING OF THE CEREMONY (TA+TRADE PLAN)Price Levels and Resistance Zones:
The chart shows several key resistance and support levels marked by blue horizontal lines.
Major Resistance Levels:
$73,654.77
$71,552.73
$69,730.95
Support Levels:
$65,947.27
$60,061.54
$52,774.45
Bitcoin is currently trending upward, with price action near $70,734.95, approaching the resistance zone at $71,552.73.
VMC Cipher B Divergences:
The VMC Cipher B indicator shows bullish momentum with green dots, signaling possible upward continuation.
The RSI and Stochastic lines are also above mid-levels, suggesting continued bullish momentum.
RSI (Relative Strength Index):
RSI (14, close) is at 77.25, indicating overbought conditions. This could mean a possible retracement or consolidation in the short term. However, a strong uptrend may continue if Bitcoin maintains support levels above 70.
Stochastic Oscillator:
Stochastic (14, 1, 3) is also at a high level, around 86.19, indicating overbought conditions. This aligns with the RSI and could signal a need for caution on long positions until the oscillator moves back to a neutral or oversold region.
HMA+ Histogram:
The histogram indicates some bullish divergence, but recent bars are turning red, signaling a potential pullback or pause in momentum. Monitoring this for further bearish signs is essential, especially if it crosses below zero.
Trading Plan
Short-Term Strategy:
Entry: Consider entering a long position on a pullback to support around $69,730.95 if bullish signals persist.
Stop-Loss: Place a stop-loss below the $65,947.27 support level to limit potential downside risk.
Take-Profit: Target $71,552.73 as the primary take-profit level. If momentum remains strong and BTC breaks above $71,552.73, consider holding for $73,654.77.
Medium-Term Strategy:
Entry: Buy on confirmation of a breakout above $71,552.73 with strong volume.
Stop-Loss: A stop-loss slightly below the breakout level at $69,730.95.
Take-Profit: Set a take-profit target around $73,654.77. If Bitcoin breaches this, reassess the position for potential gains towards higher levels.
Risk Management:
Position Sizing: Risk no more than 1-2% of the trading account on each trade.
Trailing Stop: Implement a trailing stop if Bitcoin strongly surpasses $71,552.73, to lock in gains while allowing for additional upside.
Monitoring Indicators:
Keep an eye on RSI and Stochastic Oscillator for any signs of bearish divergence or weakening momentum.
Monitor VMC Cipher B for any shift in green dots to red, which could indicate potential retracement.
Overall Market Sentiment:
Given the current uptrend and approach to resistance, Bitcoin shows bullish sentiment. However, indicators suggest overbought conditions, so caution is advised.
Bitcoinsignals
BITCOIN All indicators aligned for an incredible 12-month rallyBitcoin (BTCUSD) broke last week above its 7-month Bearish Megaphone pattern, which was essentially the pattern that absorbed via a relief pull-back the incredible rally that the market had since October 2023, fueled at large by the ETF speculation and then launch.
** Bearish Megaphones inside 7-year Channel Up **
This pattern is, as you can see, part of a greater 7-year Channel Up that encompasses the last two Cycles of BTC. Halfway through the 2018 - 2021 Cycle, the market also had a Bearish Megaphone, a little larger, lasting for 12 months before the price broke above it.
** The importance of the 1W MA50 **
That bullish break-out came when the price regained the 1W MA50 (blue trend-line) as Support and until the Cycle Top, it was never compromised again. In an amazing display of Cycle symmetry, Bitcoin is also being supported by the 1W MA50 right now (has been since the March 13 2023 weekly candle), in fact it was successfully tested and held 3 times since August 05 2024.
** MACD Bullish Cross **
The Megaphone break-out and the 1W MA50 support aren't the only bullish indicators that point to a heavy price increase next. Perhaps the most important of all is the (L) MACD Bullish Cross on, also on the 1W time-frame, the first such formation in a whole year (since October 23 2023). This is a huge development as it comes after 7 months of non-bullish price action, indicating a shift in trend.
** Can the top be at $200k or above? **
When all those indicators were aligned in mid 2020, BTC kick started the 2nd, final and most aggressive Rally of its Cycle. It was +65% stronger than the 1st Rally. As a result, we may experience in the next 12 months a rally of +615% (65% greater than the +373% 1st Rally).
But if this seems too great without a catalyst like the ETF launch was in January, even if BTC replicates the bullish price action of November 2022 - March 2024, it will still hit the $200k mark. What history has shown at least, is that we can stay bullish, until a 1W candle closes below the 1W MA50, whether that's at 100k, 150k or 200k and above.
So what do you think about this triple bullish combo? Is it enough to initiate a 12-month rally? And if so, what is your target? Feel free to let us know in the comments section below!
-------------------------------------------------------------------------------
** Please LIKE 👍, FOLLOW ✅, SHARE 🙌 and COMMENT ✍ if you enjoy this idea! Also share your ideas and charts in the comments section below! This is best way to keep it relevant, support us, keep the content here free and allow the idea to reach as many people as possible. **
-------------------------------------------------------------------------------
💸💸💸💸💸💸
👇 👇 👇 👇 👇 👇

Bitcoin Buy and Sell SignalBitcoin Buy and Sell Signal. Here you see where to buy where to sell bitcoin with stoploss and Takeprofits

BITCOIN This 1D Golden Cross can push it to the ATH ($73800).Bitcoin (BTCUSD) is ahead of a major bullish formation as most likely by next Monday, it will form a Golden Cross on the 1D time-frame, the first such formation since October 29 2023. As we've analyzed before, it is no coincidence that exactly 1 year later a new 1D Golden Cross emerges as seasonality and long-term Cycles play a pivotal role for BTC.
On top of that, the price made a major re-test (and so far bounce) at the top of the former Channel Down that broke upwards last week. If this re-test holds, it is the best short-term signal for a new High. In fact the price has been making Higher Highs since the August 05 bottom, forming a double Channel Up pattern, and those Higher Highs are the reason why the market got behind this rally and supported it to break above the 7-month Channel Down.
So the Higher Highs along with the 1D Golden Cross are the bullish combination that the market needs to look (much) higher. The first technical target now is naturally the 73800 All Time High (ATH). It is very possible to see it get tested by the election day.
But what do you think? Do you expect the ATH to break aggressively after the elections, just like the October 2023 1D Golden Cross did? Feel free to let us know in the comments section below!
-------------------------------------------------------------------------------
** Please LIKE 👍, FOLLOW ✅, SHARE 🙌 and COMMENT ✍ if you enjoy this idea! Also share your ideas and charts in the comments section below! This is best way to keep it relevant, support us, keep the content here free and allow the idea to reach as many people as possible. **
-------------------------------------------------------------------------------
💸💸💸💸💸💸
👇 👇 👇 👇 👇 👇

Bitcoin Analysis ==>> Bearish Pennant Pattern!!!Bitcoin ( BINANCE:BTCUSDT ) moved and filled the CME Gap as ✅I expected from the previous post .
Bitcoin was able to move itself below the Important Resistance Line and Resistance zone($70,080- $68,250) .
Regarding Elliott wave theory , Bitcoin seems to have completed the main wave 5 as I expected with the Ending Diagonal . Currently, Bitcoin has completed 5 bearish (small) waves and is completing corrective waves .
In terms of Classical Technical Analysis , Bitcoin has the ability to form a Bearish Pennant Pattern or Head and Shoulders Pattern . ( I drew the pattern separately for you so that the chart is not busy .)👇
I expect Bitcoin to continue its decline to at least $65,500 , and if the Support zone($66,500- $64,480) is broken, we should expect more Bitcoin declines .
⚠️Note: If Bitcoin can break the Resistance zone($70,080-$68,250) and Resistance lines, we should wait for a new All-Time High(ATH) for Bitcoin.⚠️
Bitcoin Analyze (BTCUSDT), 1-hour time frame⏰.
🔔Be sure to follow the updated ideas.🔔
Do not forget to put Stop loss for your positions (For every position you want to open).
Please follow your strategy and updates; this is just my Idea, and I will gladly see your ideas in this post.
Please do not forget the ✅' like '✅ button 🙏😊 & Share it with your friends; thanks, and Trade safe.

Bitcoin Analysis==>>Ending Diagonal!!!Let's update the Bitcoin chart .
Bitcoin( BINANCE:BTCUSDT ) is in the Resistance zone($70,080- $68,250) .
According to Elliott's wave theory , Bitcoin seems to be completing the main wave 5 . The structure of the main wave 5 is Ending Diagonal .
I expect Bitcoin to FALL again and fill the first CME Gap($67,250- $67,050) .
What is your idea Bitcoin can make a New All-Time High(ATH)?
⚠️Note: If Bitcoin can break the Resistance zone($70,080-$68,250) and Resistance lines, we should wait for a new All-Time High(ATH) for Bitcoin.⚠️
Bitcoin Analyze (BTCUSDT), 1-hour time frame⏰.
🔔Be sure to follow the updated ideas.🔔
Do not forget to put Stop loss for your positions (For every position you want to open).
Please follow your strategy and updates; this is just my Idea, and I will gladly see your ideas in this post.
Please do not forget the ✅' like '✅ button 🙏😊 & Share it with your friends; thanks, and Trade safe.

BITCOIN When the 4 year Cycles do the talking..It's been some time since we last used the Mayer Multiple Bands (MMB) on Bitcoin (BTCUSD) but the timing is just right to bring you an update, only 2 weeks before the U.S. Presidential Elections with the market ahead on an imminent bullish break-out.
This time we look into how the price was trading on this date every 4 years. As you know BTC is trading roughly within 4 year Cycles that keep a high degree of symmetry and tend to repeat a lot of dynamics each time.
Right now, towards the end of October (2024), the price is trading within the Mean MM (black trend-line) and the 1st SD above (grey trend-line). It has already started rising off the Mean MM. Based on the 4-year Cycle Theory, it is no surprise then that the price was within the exact same range in October 2020, October 2016 and October 2012. The degree of symmetry is remarkable and is yet again showcased by this indicator.
We can also see that by this time every 4 years, the price had already started rising off the Mean MM, just as it is doing now. With the green Rectangles we display the date range between these 4-year intervals and the peak of the Bull Cycle. For October 2012 it took 58 weeks (406 days) until it topped, October 2016 was 60 weeks (420 days) while October 2020 was 55 days (385 days). So time-wise the Cycle tends to peak roughly the same period.
As a result, if we take the minimum scenario of 55 weeks, we can expect the Cycle to top by mid November 2025. As far as targets are concerned, the first two Cycles hit (and broke) the 3 SD above (red trend-line), while the last one the 2 SD above (orange trend-line). Again assuming a 'worst case scenario' hitting 'just' the 2 SD trend-line, we can set a Target Range of 190k - 250k, depending on whether the price hits it halfway through the 55 week range or towards its end. Nevertheless, an exciting rally appears to be starting for Bitcoin.
So what do you think? Is this October MMB fractal about to break to a parabolic rally? And if so, will it hit the orange trend-line? Feel free to let us know in the comments section below!
-------------------------------------------------------------------------------
** Please LIKE 👍, FOLLOW ✅, SHARE 🙌 and COMMENT ✍ if you enjoy this idea! Also share your ideas and charts in the comments section below! This is best way to keep it relevant, support us, keep the content here free and allow the idea to reach as many people as possible. **
-------------------------------------------------------------------------------
💸💸💸💸💸💸
👇 👇 👇 👇 👇 👇

BITCOIN 'Angle Theory' unlocking this Cycle. Is $140k the top?Exactly 1 year ago (October 02 2023, see chart below), we published a renewed approach on Bitcoin (BTCUSD) historic Cycles, using the 'Angles Theory' on the logarithmic curve to make a more accurate roadmap of the current Cycle:
Back then, the price was 'just' $28000 and a few months later it catapulted to almost $74000. Below we present again the basics of that analysis, in order to refresh your memory.
** Cycle Peaks and angles **
BTC's Cycle peaks in historical order have been $32, $1250, $19800, $69800. They all made contact with the Logarithmic top Growth Curve, a historic pattern that is holding since BTC's inception.
Every peak-to-peak measurement appears to be roughly half of the previous peak. The automatic angle measurements on the (red) dotted lines may differ based on the screen's display and how the horizontal/ vertical axis move but on ours (and the screenshot of the idea) goes like this: 42°, 22°, 11°. We estimate a 7° angle for the new Cycle peak on the log Growth Curve.
** Next Cycle peak? **
If we take all previous Cycles and apply them to fit the new price action towards the top of the Log Growth Curve, that 7° line gives a projected Cycle peak within $140000 - 160000 (slightly updated from our study a year ago). It is also interesting to apply the same angle principle to the Cycle bottoms. We can see that those (green dotted lines) can also roughly be half of what the previous bottom was (though the variations are higher). The new bottom is estimated to be on a 8° angle.
Remarkably the angles of the tops and bottoms of each Cycle have approximately the same measurements, indicating that despite being logarithmic within a curve, they can be viewed separately in Channels.
** Last year compared to now **
So how has this Theory worked out compared to last year? Well beyond doubt, the Cycle was much more aggressive that the previous two (blue and orange) due to mainly the Bitcoin ETF launch, and is certainly more similar to the first Cycle (black). That suggests that it will top by January 2025 but the Sine Waves Tops, which have caught Bitcoin's cyclical peaks with incredible accuracy, indicate it will be around November 2025. As you can see, this is exactly where the projection of the blue and orange fractals show.
But what do you think? Will the current Cycle peak at the end of 2025 and if show will it be at a minimum of $140000 and a maximum of $1600000, as the 7° angle on the Log Curve suggests? Feel free to let us know in the comments section below!
-------------------------------------------------------------------------------
** Please LIKE 👍, FOLLOW ✅, SHARE 🙌 and COMMENT ✍ if you enjoy this idea! Also share your ideas and charts in the comments section below! This is best way to keep it relevant, support us, keep the content here free and allow the idea to reach as many people as possible. **
-------------------------------------------------------------------------------
💸💸💸💸💸💸
👇 👇 👇 👇 👇 👇

Bitcoin Roadmap!!!==>>Falling!!!Bitcoin ( BINANCE:BTCUSDT )is currently hovering near the Resistance zone($70,080-$68,250) , Potential Reversal Zone(PRZ) , the Upper line of the Ascending Channel , and Important Resistance lines(Bitcoin is attacking important resistance lines for the fifth time.) .
According to Elliott's wave theory, Bitcoin seems to be completing the main wave 5 . The structure of the main wave 5 can be Ending Diagonal .
Also, Regular Divergence (RD-) between Consecutive Peaks .
I expect Bitcoin to fail again on the 5th attack to the important resistance lines , and to break the lower line of the descending channel and decline to at least the first target on my chart. We should expect more Bitcoin dumps if Bitcoin loses the Support zone($66,500-$64,480) .
⚠️Note: Tension between Iran and Israel could increase in the coming days, causing a sharp drop in Bitcoin.⚠️
⚠️Note: Open interest in futures markets has reached its highest level in 2024, while Volume Trading has decreased.⚠️
⚠️Note: If Bitcoin can break the Resistance zone($70,080-$68,250) and Resistance lines, we should wait for a new All-Time High(ATH) for Bitcoin.⚠️
Bitcoin Analyze (BTCUSDT), 1-hour time frame⏰.
🔔Be sure to follow the updated ideas.🔔
Do not forget to put Stop loss for your positions (For every position you want to open).
Please follow your strategy and updates; this is just my Idea, and I will gladly see your ideas in this post.
Please do not forget the ✅' like '✅ button 🙏😊 & Share it with your friends; thanks, and Trade safe.

BITCOIN One year later, the pattern is repeated and leads to 88kThis is not the first time we make a case for October being the start of an aggressive rally for Bitcoin (BTCUSD) and lately we have presented you the evidence on the long-term 1W time-frame.
This time we want to focus on the 1D chart, where a more detailed analysis can be made on the fractals that lead to this rally. It was the very same pattern that helped us catch last year the amazing October 2023 - March 2024 rally, as you can see on our September 28 2023 post (see chart below):
As you can see both fractals (2023 and 2024) traded initially within a Triangle pattern that bottomed on an Inverse Head and Shoulders (IH&S). The bottom took place at the same time of the 1D Death Cross formation. Throughout the whole process, they were supported by the 1W MA50 (red trend-line).
Right now on the October 2024 fractal we are at the point where BTC just broke above the top (Lower Highs trend-line) of the Triangle. On the 2023 fractal that led to a brutal rise that only took a 'break' after reaching the 2.0 Fibonacci extension, right after forming a 1D Golden Cross.
As a result, it is possible to see $88000 (Fib 2.0 ext) in December, before the market 'cools' again. Much of course will depend upon how the markets will digest the November U.S. elections but as we've shown you in analytical charts here, the result of event tends to make little difference.
So what do you think? Can this break-out lead to 88k? Feel free to let us know in the comments section below!
-------------------------------------------------------------------------------
** Please LIKE 👍, FOLLOW ✅, SHARE 🙌 and COMMENT ✍ if you enjoy this idea! Also share your ideas and charts in the comments section below! This is best way to keep it relevant, support us, keep the content here free and allow the idea to reach as many people as possible. **
-------------------------------------------------------------------------------
💸💸💸💸💸💸
👇 👇 👇 👇 👇 👇

Bitcoin Ready to Pump!!!Bitcoin ( BINANCE:BTCUSDT ) managed to break the Upper line of the Descending channel and 200_SMA(Daily) .
Bitcoin is attacking the Heavy Resistance zone($67,400-$64,740) .
In terms of Elliott wave theory , Bitcoin seems to be completing microwave 5 of the main wave 3 in the 15-minute time frame , so main wave 3 seems to be extended .
I expect Bitcoin to rise again from the Potential Reversal Zone(PRZ) after the correction .
Bitcoin Analyze (BTCUSDT), 15-minute time frame⏰.
🔔Be sure to follow the updated ideas.🔔
Do not forget to put Stop loss for your positions (For every position you want to open).
Please follow your strategy and updates; this is just my Idea, and I will gladly see your ideas in this post.
Please do not forget the ✅' like '✅ button 🙏😊 & Share it with your friends; thanks, and Trade safe.

Its Time , Bitcoin 160k by March or September 2025?We are in the early stages of the next bull market. The question was never "if" but rather "when." The probability has shifted significantly to the upside in the last two months. Really, nothing much has been going on, and I’m waiting for my confirmation markers to trigger before making a technical analysis.
In my view, we are in a pretty large bull flag, and a mirror move like the one we saw from September 2023 to March 2024 could push Bitcoin to $160K by March 2025.
There are two major dates I’m focusing on: March/April 2025 and September 2025.
The clearest sign of a change in trend is that we stopped putting in lower lows and formed a triple bottom with bullish divergence on the daily chart.
The puzzle for the rest of 2024 and 2025 is not whether we will have a bull market but where and when the cycle top will occur. It's more of a question of timing, and that’s what I’m focusing on.
**March/April 2025 - Possible Top**
As you can see, since 2019, the average duration of major Bitcoin rallies has been 147 days. Even the longest rallies of 196 days would reach May 2025.
Looking at my time cycles, we also have a hit around March 2025.
The USDT dominance chart is currently in a bear flag. A mirror move similar to September 2023 to March 2024 would bring dominance levels down to the November 2021 cycle top, around April 2025.
**September 2025 - Possible Top**
For those who don’t know, Bitcoin’s last two cycles took exactly the same time from cycle low to top, 1064 days. If we overlay 1064 days from this cycle's low, it puts the cycle top in early October 2025, which is very close to my Fibonacci time date in September 2025.
I know there’s a lot on this chart to digest, but just focus on the red and yellow circles. Do you see the pattern? Every other sine wave peak is a cycle top. The next sine wave peak falls between September and December 2025.
The Chainlink fractal from last year is still playing out. If it continues, the top is projected for August 11, 2025, again very close to that September 2025 date.
KDA is also an interesting chart for me because it’s mirroring the last cycle closely, which again puts the cycle top in September 2025.
**Conclusion**
USDT dominance is in a bear flag, which is a clue. I’ve been in this position many times before, and USDT dominance has often signaled the way. If this bear flag follows through, it will trigger the first wave of the bull run.
**So, March/April 2025 Cycle Top:**
- 147-day average Bitcoin rallies
- USDT dominance chart mirror move
- A time cycle hit
**September 2025 Cycle Top:**
- Chainlink fractal
- KDA fractal
- Sine line peaks
- 1064 days from cycle low to top
If it’s March/April 2025 and we get a PI cycle cross, we’re out, that’s for sure , we most definitely not taking that chance that "this time its different"
Euphoria Blindness

Bitcoin Needs Correction!!!As I had expected in the ✅ previous post ✅, Bitcoin started to pump after a Bear Trap .
Bitcoin is currently moving in the Resistance zone($63,470-$62,340) and near the upper line of the Descending Channel , and 200_SMA(Daily) .
I expect Bitcoin to drop to at least the Support zone($61,840-$61,450) .
⚠️Note: The probability of forming a Bull Trap and breaking fake the descending channel.⚠️
⚠️If Bitcoin can break the Descending Channel and 200_SMA(Daily), we can expect Bitcoin to rise again to at least $66,000.⚠️
Bitcoin Analyze (BTCUSDT), 1-hour time frame⏰.
🔔Be sure to follow the updated ideas.🔔
Do not forget to put Stop loss for your positions (For every position you want to open).
Please follow your strategy and updates; this is just my Idea, and I will gladly see your ideas in this post.
Please do not forget the ✅' like '✅ button 🙏😊 & Share it with your friends; thanks, and Trade safe.

BITCOIN Channel Up starting the new Bullish Leg!Four months ago (June 07, see chart below) we published a post on Bitcoin (BTCUSD) calling it an 'Unpopular opinion' as despite a on ongoing rebound in May, we signaled a correction as, based on the long-term Channel Up since November 2022, it was technically possible to see a pull-back below the 1D MA50 (blue trend-line) and then extended consolidation until a potential bottom on the 1D MA100 (green trend-line):
Even though the Channel Up had to be readjusted, the price action delivered the exact pattern of the previous 6-month (April 11 - October 16 2023) consolidation and almost tested the 1D MA100, forming a bottom on August 04 2024.
The similarities between those two fractals are more evident on their 1D RSI sequences. This shows that right now we could be before a break-out similar on the October 16 2023 candle. Regardless of that, it appears that the new Bullish Leg of the 2-year Channel Up is accelerating and a new High above 66500 would confirm it.
We have had 3 major Bullish Legs so far, more or less around the same levels (+92.27% to +101.57%). So a bad case scenario would be to see a +92.27% rally from the August 04 Low, which would still give us a $94500 Target.
So what do you think? Is the Channel Up just heating up and can the new Bullish Leg reach 94.5k? Feel free to let us know in the comments section below!
-------------------------------------------------------------------------------
** Please LIKE 👍, FOLLOW ✅, SHARE 🙌 and COMMENT ✍ if you enjoy this idea! Also share your ideas and charts in the comments section below! This is best way to keep it relevant, support us, keep the content here free and allow the idea to reach as many people as possible. **
-------------------------------------------------------------------------------
💸💸💸💸💸💸
👇 👇 👇 👇 👇 👇

BTC's situation+next targets and expected movements.(Daily)I still stand by my opinion and haven’t changed my mind that Bitcoin should reach $73,000. Now let’s analyze this technically. Recently, Bitcoin managed to break this triangle strongly and rose to above $66,500. However, The price has now been corrected and it can go up to 67k, and then breaking the head and shoulders pattern, and finally reach the megaphone top.
✨We spend hours finding potential opportunities and writing useful ideas, we would be happy if you support us.
Best regards CobraVanguard .💚
_ _ _ _ __ _ _ _ _ _ _ _ _ _ _ _ _ _ _ _ _ _ _ _ _ _ _ _ _ _ _ _
✅Thank you, and for more ideas, hit ❤️Like❤️ and 🌟Follow🌟!
⚠️Things can change...
The markets are always changing and even with all these signals, the market changes tend to be strong and fast!!

Bitcoin Analysis==>> Short term!!!In the previous posts ✅, we found the Top and Bottom of the rally , which started at $59,830 and continued up to $64,470 .
Bitcoin ( BINANCE:BTCUSDT ) is currently moving near the Support zone ($60,000-$59,100) and Potential Reversal Zone(PRZ) .
I also expect Bitcoin to make Regular Divergence (RD+) after touching the Support zone ($60,000-$59,100) .
According to Elliott's wave theory , Bitcoin seems to be completing wave 5 .
I expect Bitcoin to rise above the Support zone ($60,000-$59,100) at least to my First target as shown on the chart( around $61,000 ).
⚠️Note: If Bitcoin breaks the Support zone($60,000-$59,100), we can expect Bitcoin to go down more=first step will be $58,000.⚠️
Bitcoin Analyze (BTCUSDT), 1-hour time frame⏰.
🔔Be sure to follow the updated ideas.🔔
Do not forget to put Stop loss for your positions (For every position you want to open).
Please follow your strategy and updates; this is just my Idea, and I will gladly see your ideas in this post.
Please do not forget the ✅' like '✅ button 🙏😊 & Share it with your friends; thanks, and Trade safe.

BITCOIN below the 60k again! Is this alarming??Bitcoin (BTCUSD) broke today below the $60000 market again for the first time since September 18. The first headlines are already hitting the market calling for more downside. We highly doubt that as no only has the priced formed the first Higher High on September 27 in 6 months, but more importantly the uptrend since the August 05 bottom is supported by a Higher Lows trend-line.
Also, the 1D MA50 (blue trend-line) may have been broken, but as long as the price holds the 1W MA50 (red trend-line), which has held twice already on August 05 and September 06, the chances of a break-out above the 7-month Lower Highs trend-line are high.
In fact, the pattern since the August 05 bottom appears to be an Inverse Head and Shoulders (IH&S). The standard technical target on such occasions is the 2.0 Fibonacci extension, which gives us a $80000 price tag. As long as the 1W MA50 holds, this is the most likely scenario in our opinion.
-------------------------------------------------------------------------------
** Please LIKE 👍, FOLLOW ✅, SHARE 🙌 and COMMENT ✍ if you enjoy this idea! Also share your ideas and charts in the comments section below! This is best way to keep it relevant, support us, keep the content here free and allow the idea to reach as many people as possible. **
-------------------------------------------------------------------------------
💸💸💸💸💸💸
👇 👇 👇 👇 👇 👇

Bitcoin Analysis==>>Risk-To-Reward:4.40Bitcoin started to rise after the UAE exempted cryptocurrency transactions from Value Added Tax (VAT) .
The UAE exempts crypto transactions from VAT starting November 15, aiming to attract more investments and solidify its position as a crypto hub.
Bitcoin is currently moving near the Resistance zone($67,400-$65,000) , the Potential Reversal Zone(PRZ) , and above the ascending channel .
Regarding Elliott wave theory , Bitcoin has restructured a bit since my previous post . Bitcoin seems to be completing wave C inside the ascending channel.
Also, Regular Divergence (RD-) between Consecutive Peaks .
I expect Bitcoin to decline to at least the Support zone($62,860-$62,110) again, and because there is still a high possibility of tension between Israel and Iran , it is very likely that Bitcoin will come back below 21_SMA(Weekly) and 200_SMA(Daily) .
⚠️Note: This analysis is valid until Bitcoin does not touch $66,500.⚠️
-------------------------------------------
My position: Of course, I manage this position with price changes.
BTCUSDT
🔴Position: Short
✅Entry Point: 64347.0 USDT (Limit Order)
⛔️Stop Loss: 65283.0 USDT [ You can open a Short position where the Stop Loss(SL) is $66,500 ]
💰Take Profit:
🎯62493.0 USDT ===>>>Risk-To-Reward: 1.98
🎯60229.0 USDT ===>>>Risk-To-Reward: 4.40
Please don't forget to follow capital management ⚠️
Please pay attention to the style of opening the position.⚠️
-------------------------------------------
Bitcoin Analyze (BTCUSDT), 1-hour time frame⏰.
Do not forget to put Stop loss for your positions (For every position you want to open).
Please follow your strategy and updates; this is just my Idea, and I will gladly see your ideas in this post.
Please do not forget the ✅' like '✅ button 🙏😊 & Share it with your friends; thanks, and Trade safe.

BITCOIN fractal alert! Happening exactly like last October!We talked a while ago regarding the 'October effect' (August 28, see chart below) on Bitcoin (BTCUSD). But today we need to make an urgent analysis as it appears that the market is repeating almost the exact sequence of a year ago (October 2023).
The similarities are more obvious on the 1D time-frame where the price is currently ranged within the 1D MA50 (blue trend-line) and the 1D MA200 (orange trend-line). The most recent time it traded like this was exactly one year ago, back in the first two weeks of October 2023.
As you can see, during that time BTC also made a marginal break above the 1D MA200 before quickly pulling back below it. After it tested and held the 1D MA50 (as it did no on October 01 2024), is started the long-term aggressive rally of the Channel Up that peaked on March 14 2024.
As long as the 1W MA50 continues to hold as the long-term Support, there are high probabilities of seeing 100k, even before the end of 2024.
But what do you think? Do you see realistic the scenario of repeating the post October 2023 rally? Feel free to let us know in the comments section below!
-------------------------------------------------------------------------------
** Please LIKE 👍, FOLLOW ✅, SHARE 🙌 and COMMENT ✍ if you enjoy this idea! Also share your ideas and charts in the comments section below! This is best way to keep it relevant, support us, keep the content here free and allow the idea to reach as many people as possible. **
-------------------------------------------------------------------------------
💸💸💸💸💸💸
👇 👇 👇 👇 👇 👇

Bitcoin is Ready to Crash Again!!!Bitcoin is currently moving near the Resistance zone($62,860-$62,110) and 21_SMA(Weekly) and 200_SMA(Daily) .
According to the Elliott wave theory , Bitcoin seems to be completing main wave 4 . The structure of the main wave 4 appears to be an Expanding Flat Correction(ABC/3-3-5) .
I expect Bitcoin to break down to the Support zone($60,000-$59,100) once again.
⚠️Note: Considering that the Trading Volume is usually low on Saturday and Sunday, it is more reasonable to expect the Support zone($60,000-$59,100) to break at the beginning of next week. Of course, the tension between Iran and Israel can change the scenario at any moment, and the support zone will be broken.⚠️
⚠️Note: If Bitcoin breaks the Resistance zone($62,860-$62,110) and 21_SMA(Weekly) , we can expect the BTC pump to near $65,000.⚠️
In previous posts , I tried to show you the Bitcoin roadmap step by step; I hope it was useful.
Bitcoin Analyze (BTCUSDT), 4-hour time frame⏰.
Do not forget to put Stop loss for your positions (For every position you want to open).
Please follow your strategy and updates; this is just my Idea, and I will gladly see your ideas in this post.
Please do not forget the ✅' like '✅ button 🙏😊 & Share it with your friends; thanks, and Trade safe.

Bitcoin Ready to Pump==>>Falling Wedge==>>Shot termBitcoin moved as I expected in the previous post .
According to Elliott's wave theory , Bitcoin completed wave 5 , and we should expect upward corrective waves .
Regarding Classic Technical Analysis , Bitcoin seems to have formed a Falling Wedge Pattern .
Also, Regular Divergence (RD+) between Consecutive Valleys.
I expect Bitcoin will go up after breaking the upper line of the falling wedge pattern and touch my targets in my chart.
⚠️Note: Tensions between Iran and Israel can still have an impact on Bitcoin and other assets. If Israel wants to react to Iran's attacks, we should expect a further drop in Bitcoin, so in these days, more than ever, observe capital management.⚠️
Bitcoin Analyze (BTCUSDT), 1-hour time frame⏰.
Do not forget to put Stop loss for your positions (For every position you want to open).
Please follow your strategy and updates; this is just my Idea, and I will gladly see your ideas in this post.
Please do not forget the ✅' like '✅ button 🙏😊 & Share it with your friends; thanks, and Trade safe.

BITCOIN Cup and Handle on full motion looking for the break-out.Bitcoin's (BTCUSD) full Cycle since the November 2021 High can be illustrated as nothing more than a Cup and Handle (C&H) pattern with the Channel Down since March 2024 being the Handle of the formation.
Simple yet a technical reality, the Handle found support both in early August and September on the 1W MA50 (blue trend-line), keeping the bullish trend valid. In fact, the 1D MA200 (red trend-line) and the 1W MA50 have been the bottom formation zone during its previous 6-month consolidation in August - September 2023.
All Bullish Legs since the November 2022 bottom have been within +90% and +100%. Even if the minimum (+91.68%) of the last rally is followed, we can expect Bitcoin to reach at least $94000 during that run by the end of the year.
But what do you think? Will this Cycle-long Cup and Handle serve its purpose and break-out aggressively? Feel free to let us know in the comments section below!
-------------------------------------------------------------------------------
** Please LIKE 👍, FOLLOW ✅, SHARE 🙌 and COMMENT ✍ if you enjoy this idea! Also share your ideas and charts in the comments section below! This is best way to keep it relevant, support us, keep the content here free and allow the idea to reach as many people as possible. **
-------------------------------------------------------------------------------
💸💸💸💸💸💸
👇 👇 👇 👇 👇 👇

Bitcoin Roadmap!!!==>>Short termAfter the tension between Iran and Israel , Bitcoin started to fall and once again fell below 21_SMA(Weekly) and 200_SMA(Daily) .
In previous posts , I warned you about the fall of Bitcoin , and I hope it was useful.
Bitcoin is currently approaching the Resistance zone($62,860-$62,110) and 21_SMA(Weekly) .
According to Elliott's wave theory , Bitcoin is completing wave 4 . The main wave 4 structure is most likely a Zigzag Correction(ABC/5-3-5) . If Bitcoin breaks the support lines , we can confirm the end of wave 4 .
I expect Bitcoin to break down to at least the Support zone($60,000-$59,100) in the coming hours.
Fundamental analysis : On-chain data shows that the number of active Bitcoin addresses has recently dropped sharply . This decrease started in March 2024 and is the biggest drop since 2021 . This trend could be a bearish sign for Bitcoin .
⚠️Note: If Bitcoin can break the Resistance zone($62,860-$62,110) and go above $63,460, we should wait for Bitcoin to rise again.⚠️
⚠️ Note: Tensions between Iran and Israel can still have an impact on Bitcoin and other assets. If Israel wants to react to Iran's attacks, we should expect a further drop in Bitcoin, so in these days, more than ever, observe capital management.⚠️
What is your idea about Bitcoin, more dump or, again, pump❗️❓
Bitcoin Analyze (BTCUSDT), 1-hour time frame⏰.
Do not forget to put Stop loss for your positions (For every position you want to open).
Please follow your strategy and updates; this is just my Idea, and I will gladly see your ideas in this post.
Please do not forget the ✅' like '✅ button 🙏😊 & Share it with your friends; thanks, and Trade safe.
