BTC 313 K $ Target - Satoshi is same Messias , the survivor Everything is visible on chart
Satoshi is same Jewish promisen survivor
Yahadút
Bitcointrading

BNBUSDT | ABC Pattern - Pullback Entry & Target Mega BullflagA bullish scenario for long-term view after a confirmed descending triangle breakout with a potential pullback entry position targeting ABC pattern at 100% - 161.8% Fib extension upper resistance of the mega bull flag.
S1/S2: pullback descending triangle support / ema20w zone
T1: 100% fib extension +50%
T2: 161.8% +90%
Indicator: RSI week - tapping into OB area with no sign of bearish divergence.

BTCUSD: $150k is next and may come faster than you think.Bitcoin is vastly overbought on 1W (RSI = 88.615, MACD = 6893.200, ADX = 74.337) as it is running an incredible second phased rally since the start of the year. The 1W MACD is starting to diverge and it is a similar situation as on November 16th 2020. Bitcoin was still at the early staged of the new rally. If we place that rally fractal on today's action, we see that it feeds a pattern that goes all the way to 150,000. That is very close to the top of the six year Channel Up.
See how our prior idea has worked out:
## If you like our free content follow our profile to get more daily ideas. ##
## Comments and likes are greatly appreciated. ##

BITCOIN trading advise... hi guys I'm msnp..
bitcoin is going up today and I wonder that what are you doing in this time?
buying? selling? hodl? happy? worried? sad?
so first of all lets see what happening on technical side :
in last post about bitcoin we said everything you need when you sell and buy and now i see a channel , last move speed was so high and i think its unstable so be careful.
if you are in the market:
1. you can hodl but be careful.
2. you can sell a little bit and wait for next opportunity.
it's all on your strategy and personality if you fell fear or greed
if you are waiting for 100k bitcoin or 20k bitcoin I have to say sorry pall market don't care about our idea, about our wishes (new home, new car ....)
market a place without any sense, so OfCourse he can't understand our feelings.
ok next if you are in cash don't worry you miss nothing just avoid of FOMO and be ready for another opportunity.
im here for any questions and problems
follow me and be happy

Bitcoin Price UpdateThe possibility of further price drops depends on whether #Bitcoin finds support above $63,696.83. If it does, we can expect a positive day. Otherwise, we might see more price declines

Bitcoin Confirm M Pattern ,great scalping timeplease check my previous analysis warning people about this area level and we are not in correction phase , please follow me to get my analysis notifications

I think we're going straight to 80k!Traders,
The demand for BTC from these ETFs has been insane. The last I read on this about 2 weeks ago was that ETFs were demanding over 12x what miners could supply. And this is still pre-halving. Add to this the facts that only 24% of BTC remains liquid and there is continued institutional demand in other countries opening up and you can quickly understand from some simple math that Bitcoin is in the beginning stages of a massive supply shock.
Even multi-year resistance levels are blown up like they are nothing. I honestly have not seen technicals rekt to the degree they are recently. Fundamentals far outweigh technicals at this point. However, we are still going to chart, observe and denote technicals where they may be of use to support current fundamentals.
In this case, I wanted to demonstrate what the technicals are showing more recently. We have here an inverse H&S pattern. Our target ends up being 80k which intersects exactly with another ascending TL I have mapped here. Honestly, I think we could go straight to 80k without any sort of pullback at this point.
We did not pullback at our multi-year support/resistance from 2019. If we were going to pullback, that is where we might have done it. Another point of possible pullback is 70k. We're almost there rn and there is no signs that we are going to stop. I think 80k is in the cards and we didn't even get a pullback and retest of our 48k neckline! I am absolutely amazed by this. Then again, I have never really witnessed a supply shock in real time.
Stewdamus

$BTC Bitcoin Bigger Picture $100K in 2024 Here's a complete shot in the dark, dart at the dartboard, projection of what #bitcoin is going to be up to in the coming months with the previous BTC/USD chart trends.

BITCOIN - March Highier Timeframe Breakdown - 01/03/24'Hello everyone,
lets jump in..
So bellow you can find screenshots, with every relevant timeframe to be looked at, to make a better educated guess at least in my opinion.
First of all, I need to say, that this Idea DO NOT have to play out immediately, IF ALL!
BUT Since Highest Timeframe we operating with is 3Month, there is still like 60Days window in which this CAN play out.
3M
2M
1M
15D
10D
5D
So this Whole IDEA, is Based on 3M candle/timeframe (basically quarter outlook), which still follow my Q1+FED outlook as next.. --> In which I ment there is higher chance of continuing Higher with time UNTIL FED start cutting Interest Rates... and in the mean time we Rallied.. BUT since we are reached Price targets close to ATHs' I think is needed to be even more carefull.. and this due to --> If we take a look at 3M chart, we can see that prior times in History, when we reached Closing price of 3M candle, IT WAS THE TIME WHEN WE PEAKED WITH PRICE FOR PROLONGED PERIOD OF TIME. (And we already did it!) but there is still almost 2month to next FED meeting.. So Main Question is IF we will go Above ATHs' in this period of time, or We will follow what happend prior Cycles and thats correction... AND My honest answer is that I DONT KNOW, BUT if I HAVE TO pick one, I REMAIN EXTREMLY CAUTIOUS, since Right Now I see this more as "fake bull market"
BECAUSE , and this "Because" have two aspects- Micro/Macro economy and then what Charts are saying..
Firstly, if we check out Charts, we can see on EVERY SINGLE ONE, that we reached with Closing Price close to where ATHs Closes are, BUT we dont Close above them.. Which In my understanding of Market Increasing chances for revisiting Lower prices "when correct time come" BUT, in the meanwhile, there is still "TREND" which I would say is still "bullish" and for that Reason we can "be trying" to reach or break ATH.. and only "time shows and chart tell" if we will go there.. BUT , as I ment.. there is other factor and thats..
Micro/Macro economy outlook at things, And I would say.. "ITS NOT THE BEST ONE"! --> Inflation is STILL HIGH (due to FED) and it looks like it slowly starting to elevate again, Unemployment is STILL relative close to all time Lows, and Interest Rates are STILL HIGH.. on top of that, from last reports it looks like economy start Slowing down a little bit BUT Markets still looks like "they dont care". Which In my opinion is BIG Mistake, and for that reason, Im trying to evaluate things on Daily basis when New Important Market/Economy News happen.. especially, in time "Where people believe only way of going is Highier!"...
AND THATS BECAUSE - if we again, come back to our 3M chart, we can see there is 30D left on it.. and in those 30days market can change a LOT, AND We already reached price where In history was our "turning point" chart wise.. So, in my opinion, being a buyer right now is more risky then being seller.. , but I still label this IDEA as Neutral, since there is still lot of time remaining for Price to behave irational.
Hopefully, this helps some of you with your perception of market.
If YES, please consider liking or sharing this post, it would mean a lot for me. Thanks
Joe

What can we expect in the cryptocurrency market in 2024-2026Today we have a rather interesting article with a lot of food for thought
Let's talk about the total capitalization of the crypto market.
In 2021, when the BTC price peaked at $ 69K, the total capitalization of the crypto market was $3 trillion
Yesterday, the BTCUSDT price touched $ 64K, almost reaching ATH, and the total capitalization of the crypto market is $2.25 trillion, which means that it is roughly speaking "behind" by 30%.
This can only mean that altcoins are just beginning to "break out" and the real "Bull run" is still ahead.
We have been in the cryptocurrency market since the end of 2016 and have "survived" many cycles in the market, and believe me, there will come a time when altcoins will shoot 30-50-100% per day in dozens, not just a few as it is now, and your eyes will run away in not understanding what to buy next, because everything is growing) Now we are just warming up.
What can happen next?
Further, the price of BTC can, for example, go into a broad consolidation in the range of $30-70k.
The "small money" will say wow, consolidation with a corridor of 100+%, and the "big money" will meanwhile take Bitcoin from the "weak hands" on fluctuations and accumulate their reserves.
Since the big money will not sell their BTC, they have a very effective tool to pump coins - buying altcoins in pairs with BTC. At this point, the price of altcoin/usdt will skyrocket exponentially.
If we look at the chart of the total capitalization of the crypto market, you can clearly see one pattern: from the moment of BTC halving to the maximum value of the total capitalization of the crypto market, 183 3-day candles pass. That is, roughly speaking, a confident bull run in the crypto market has already lasted for 550 days twice.
You might say that we can't compare these periods because big money is now entering the cryptocurrency market, and they will continue to drive the market.
But most likely, you have not been in the crypto market for long and do not remember what the narratives were in the previous cycles:
- In 2017, the market was mainly "rocked" by ICOs and pioneering venture capital funds entered the crypto market. If I'm not mistaken, ETH was sold at ICOs at either $0.30 or $0.50, and today it has reached $3500 - and this is probably the "most tenacious" project from this period.
- The entire 2018-2019 Internet space was teeming with reports that Bakkt would enter the cryptocurrency market and revitalize the crypto market and push for ATH updates. But no!) The crypto market was revived only in 2020, and then at the expense of retail buyers, at the expense of cash payments to the population to combat Covid-19. By the way, check out the movie Dumb Money, which reflects the events of the time when retail buyers punished hedge funds that were shorting the growing market! As they say, you can't go against the masses)
- Then in 2020-2021, there were the narratives of IEO, Defi, NFT, Elon Max with tokens and tweets that drove the market. There was something else, please add to the comments.
- And now it's 2023 and a new growth cycle with the main narrative at the moment - BTC ETFs and the entry of large funds like BlackRock into the crypto market.
By the way, at the end of 2022, we released the two ideas that this is probably the bottom and it is definitely worth buying:
1. How much can the Crypto market capitalization grow by 2025 at Nov. 2022
2. Bitcoin & Cryptocurrency results of 2022 and plans for 2023-2025 at 30.12.2022
Despite the mega rise in the price of BTC in 2024, Google trends suggest that the peak rush for search queries like in 2017 and 2021 is still very, very far away.
We also have a personal gut feeling, comparing to previous periods, that "strong hands", as they like to call themselves, who have sat for 2 years with a mega deposit drawdown of -60-80% and are now selling their assets at entry points.
And the "fresh and new money" is still "little" in the cryptocurrency market, perhaps it is already expensive?
Also, it's been a long time since the market has been nightmarized by news like possible large sales of BTC: Silk road, which was confiscated by the United States, MT Gox payments, FTX payments, and so on. As they say, let's be careful!)
If we believe the blue fractal that we have depicted on the idea's chart, the cryptocurrency market may soon begin to correct with a decline in the total capitalization of the crypto market.
But not super deep, only -30% to $1.5-1.6 trillion . Moreover, this does not mean that the entire crypto market will fall "like a stone down." Alternatively, the price of BTC, which now accounts for more than half of the crypto market capitalization, may show the largest proportional correction. Meanwhile, altcoins will adjust quite adequately in price, and then may be sharply "pumped" by pouring BTC or ETH into them.
Also, according to this fractal, this time the growth cycle may take longer than 550 days and last until the end of summer 2026.
Well, write in the comments what you think will happen to the crypto market in the coming months?
You can also put "like" the idea to subscribe to it and watch it develop together. And we will write our comments as the price moves.

Bitcoin $30000 (Forget to publish this a few days ago however, this is not investment advice. I am just sharing my opinion. The long-term scenario is bullish. I will update once it reaches the expected target.)
The recent approval of spot Bitcoin ETFs by the U.S. Securities and Exchange Commission (SEC) is indeed a significant development in the cryptocurrency market, marking a milestone for crypto adoption. This decision, which came after more than 10 years of anticipation and several rejected proposals, has been met with a mix of reactions from the crypto industry. On one hand, it has been celebrated as a historic moment that could lead to a substantial influx of capital into Bitcoin, with estimates predicting upwards of $100 billion flowing into Bitcoin ETFs in the U.S. this year alone. The approval is seen as a nod towards the increasing market size and institutional interest in Bitcoin, with the market cap nearing $1 trillion and institutional giants like BlackRock joining the ETF race.
On the other hand, there's a discussion within the crypto community about the immediate impact of this approval on Bitcoin's price. Some analysts and industry observers are contemplating a "sell the news" event, where the price might experience short-term sell-offs as the ETF news might already be priced in. This sentiment is based on the theory that traders often capitalize on market movements by trading on rumors and tend to sell once the actual news is released, potentially at a profit. However, the price of Bitcoin before and after the approval has remained largely unchanged, suggesting that significant movements had already been anticipated by the market.
The overall market sentiment seems to be that while the approval is a positive step for the legitimacy and accessibility of Bitcoin, it may not necessarily result in an immediate dramatic price surge. This is partly because such significant events are often anticipated by the market, and their impact is reflected in prices before the actual event occurs. However, experts also note that the long-term implications of the ETF approval could still be bullish for Bitcoin, drawing parallels to the introduction of gold ETFs and their subsequent impact on gold prices.
The introduction of these ETFs has also highlighted the importance of collaboration within the industry to ensure robust safeguards against fraud and market manipulation, which is crucial for the continued growth and maturation of the crypto market.
In the context of the trading chart and the broader market dynamics, the negative momentum and declining volume in the face of such a significant event could suggest that larger market players may be waiting for more favorable entry points. This could be part of a broader strategy to accumulate at lower prices, which is a common practice among investors with substantial capital at their disposal. However, it's important to remain cautious and consider that the market can be influenced by many factors, and the actions of large investors are just one piece of the puzzle.

Say hello to $92KWhen the image becomes reality!!
Search the entire trading view, see which trader can analyze like me and predict the price jump of Bitcoin to 61,000, with only one scenario!!
So, this is a very good reason for you to follow me, if you want to be added to my special channel (monthly fee of 110 dollars) send me a private message.
Well, as you can see in the new analysis, we are now at a major resistance, so we can consider that Bitcoin can move a little lower to the sema, but this should not cause you fear, because it is still at my target, which is $92. It will move (sooner or later) hopefully don't miss this great profit.

BITCOIN, Massive Bullish Breakout, Wave-Extension Objection!Hello There!
Welcome to my new analysis of Bitcoin in the middle to larger timeframe perspective. Within recent times Bitcoin developed a determined bullishness from where on it continued to form several new highs and establish a solid uptrend also supported by events such as the BTC ETFs (Exchange-Traded-Funds) that were confirmed for acceptance. Now Bitcoin also completed a major pattern which is a huge bull flag formation, Bitcoin completed such patterns several times within history and now the wave C expansion is ready to move into new all time high spheres.
With the current bullish dynamic holding on and more and more volume moving into the market as well as with the bullish sentiment building a strong technical support bitcoin is on the way to reach the full potential wave C target zones. Once the bitcoin price action bounced into the new all time high this will be an appropriate price move when the BTC ETFs trading volume also supports the price action and confirms the ability to lead to further bullish volume determination increases within the next times.
Thank you everybody for watching my idea about BITCOIN! Support is greatly appreciated.
VP

BITCOIN, Massive Broadening Wedge, Targets Active + ETF Volume.Hello There!
Welcome to my new analysis of BITCOIN in the daily timeframe perspective. The current bull run is still holding on and BITCOIN does not back off and is printing one hew high after the other. This uptrend is backed by real events that support the bullish case such as the Bitcoin ETFs release which is the preliminary fundament of new and fresh volume moving into the whole cryptocurrency market.
When considering the developing dynamics in my technical chart perspective now it has to be pointed out that BITCOIN since it bounced several times within the 50-EMA established the ability to form this gigantic broadening wedge formation. Recently BITCOIN formed the crucial breakout above the upper boundary of the formation above which it is now developing a main bullish triangle continuation formation.
There is also a major wave count ongoing which is supporting the broadening wedge development as the major waves A and B already formed the fundament of the broadening wedge BITCOIN is now continuing to form the wave C simultaneously with the bullish expansion wave. What is also an important factor that is stabilizing the bullish trend here is the horizontal support marked in orange.
Taking all these factors into consideration the most meaningful insight here is that BITCOIN now activated the main target zones with the initial target zone to be reached once the bullish continuation triangle has completed with the continued extensive bullish breakouts. Once the initial target zone has been reached and the bullish BTC ETF volume is holding on together with bullish technicals the final target zone will be reached.
Thank you everybody for watching my idea about BITCOIN! Support is greatly appreciated.
VP

Bitcoin Update | Alt Coin Update | 28 Feb 2024Hello Traders,
Check out the latest update on Bitcopin , Ethereum and Alt Coin. Also a signal in Alt Coin which can give good returns

Bitcoin 📢 NO MORE DUMPS... but NO PARABOLA either📉Hi Traders, Investors and Speculators of Charts📈
More and more institutional buyers have recently admitted to investing in BTC, as we see Grayscale and BlackRock (to name a few) all invest massive amounts into this digital currency.
This could mean a few things for this bullish cycle, including:
📢 More reach (more retail investors)
📢 Higher market cap (more wallets being created)
📢 Less volatility than previous cycles (institutional trading and holding)
📢 More reach (more retail investors)
Recent news headlines have made almost anyone with a access to the internet aware of Bitcoin, if they haven't heard before. BTC promises great returns and is generally more stable than altcoins, making it a great start for newcomers who may want to try their luck with cryptocurrencies.
📢 Higher market cap (more wallets being created)
The market capitalization increases as more liquidity (cash) is invested into BTC. As more and more institutions are buying and more and more people are buying, new wallets are being created at and more money is converted to Bitcoin.
📢 Less volatility than previous cycles (institutional trading and holding)
Usually when large institutions enter the market, the volatility reduces. We see this clearly with most-traded commodities such as gold and silver. It becomes a safe haven for investors as they see brokers and other institutions give the nod of approval to Bitcoin.
These are a few reasons as to why I'm not expecting a parabolic increase towards a new ATH, and neither a correction bigger than 30%.
If you found this content helpful, please remember to hit like and subscribe and never miss a moment in the markets.
_______________________
📢Follow us here on TradingView for daily updates📢
👍Hit like & Follow 👍
CryptoCheck
BINANCE:BTCUSDT

BITCOIN - 27/02/24' - Weekly Update Hello everyone,
hope you guys doing great..
Firstly I would like to adress something from *Last update*, since some of you may been confused..
When I ment in update, that I expecting *Bearish Sentiment for 0-48hours* - IT MEAN, I EXPECT BEARISH SENTIMENT FOR 0-48 - Not for 5D, Week, Month etc..
and as far as Im concern, thats exactly what happend, before market continued remaining bullish to this day..
Secondly, since is close to end of month, and I would like to break down Market from Top to Bottom, I decided to wait With Update till Friday, when Monthly and other Highier time frame candles will close..
Meanwhile, I would just like to point out THAT -->
Previously, when we reached closing price of 3M candle(either went slightly above or under), both times after that in upcoming days to weeks to MONTHs, we got some type of correction..
I will get deeper to it Friday...
Until then, be carefull guys, and dont forget to use PROTECTION while you wildin out there ^^
Joe

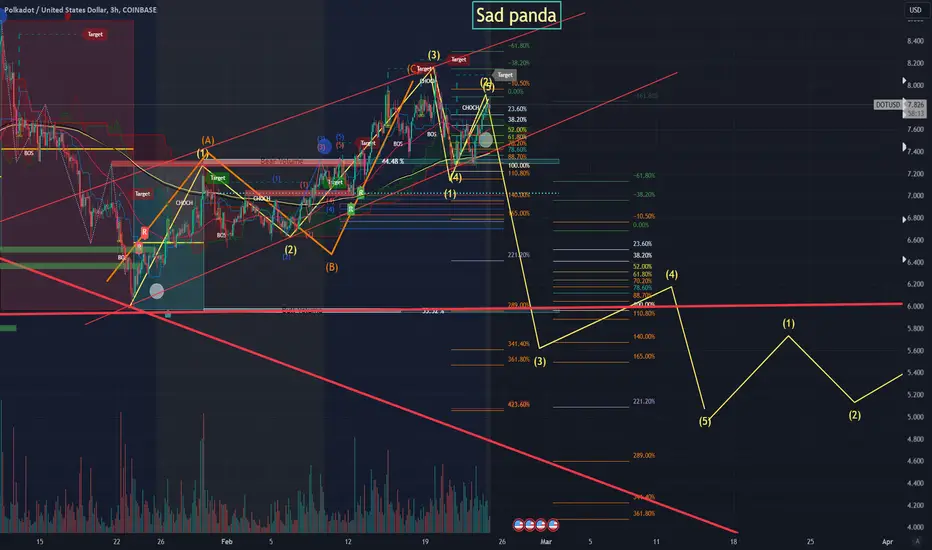
PolkaDot is about to make some sad pandasIf this rolls over you might be lucky to get out at $6.90.
I am looking to buy back in near $4.30
Bull run in a bear market...
NOT FINANCIAL ADVICE!!!!!
BTCUSDPair : BTCUSD ( Bitcoin / U.S Dollar )
Description :
Completed " 123 " Impulsive Waves
Rejection from Fibonacci Level - 161.8% and Daily Resistance Level
Break of Structure
Rising Wedge as an Corrective Pattern in Short Time Frame with the Breakout of Lower Trend Line and Retracement

BITCOIN - 4h breakdown Update to Weekly Outlook 20/02/24'Hello everyone,
just a quick update to Yesterday Weekly outlook..
4h Idea Breakdown chart:
Reasons WHY Short in next 0 to 48 hours:
1 - is Lower Close then 2
2 - is Highier Close then 3, BUT it have Lower Candle High
3 - have Lower Close then 2 and Last Green Candle,
BUT in the same time have Highier Candle High
__________________________________________________
These are Reasons WHY I believe we are about to Short in next 0-36(48) hours at least
& WHY I was yesterday slightly more bearish then bullish, but since it developed as it did, it gave me more confirmation and confidence that we are about to go Lower (Short market).
Aswell, if you decide to take a trade, DONT FORGET TO USE STOP LOSS, for your own good.
Hopefully, this helps some of you with your perception of market.
If YES, please consider liking or sharing this post, it would mean a lot for me. Thanks
Joe

BITCOIN - Weekly Outlook 20/02/24'Hello everyone,
just a quick Weekly update..
I believe that not much changed Price wise since last week, BUT we got some developments and news from Macro Economy perspective...
So, Im still somewhat alerted we are RIGHT now possibly "around" or "not so far" from High, before of "reversing" at for week/two..
WITH still having in mind, that ONLY ONE TIME in History, when Market conditions was closest to similar as we are today, Market didnt find its TOP until FED started cutting rates...
So there is still possibility of going Highier with time (March,April), even tho Price wise we already elevated a lot... and thats the reason Why is Executing a Trade Correctly right now difficult...
So AGAIN, I would suggest EVERYONE to use STOP LOSS, if you decide to trade...
cause, PROTECTING CAPITAL should be your Number 1 object every time!!!
-- I would like to state, that due to everything ment above and previously - I Labeled this Idea NEUTRAL - but, my bias is slightly more bearish, that bullish as for Right Now. --
Hopefully, this helps some of you with your perception of market.
If YES, please consider liking or sharing this post, it would mean a lot for me. Thanks
Joe

Bitcoins the King of Crypto Currency to Hit $54k+In the kingdom of crypto, BTC makes a decree and others follow, Lots of ranging market experienced over the past few days / week is not strange as the momentum to push upwards needs to be gathered,
That seems to have been completed,
The bulls are ready for a new ride......
At DANCOLNATION CAPITAL, We shall be monitoring candlesticks formations and chart pattern with other tools for confluence purposes and refining of our entry as the market acts

Bitcoin Update | Alt Coin Update | AICoin Update | 14 Feb 2024Hello Traders ,
Checkout the latest update on Bitcoin , Alt Coin and Our Super JHackpot Signal AI Coin
