BTC Bitcoin Santa Claus RallyBTC Bitcoin tends to follow the stock market in price movement.
U.S. stocks tend to rise during the Santa Claus rally period.
The Santa Rally is considered the last five trading sessions of the year and first two of the new year.
Since 1950, the S&P 500 has traded higher 78% of the time during the Santa rally period for an average gain of 1.3%.
My price target for BTC Bitcoin is $17340.
Looking forward to read your opinion about it.
Bitcointrading

Bitcoin BTC Price TargetThis week I predict another selloff in the stock and crypto market after the CPI report on January 12.
My price targets for Bitcoin BTC are:
BTC/USDT short
Entry Range: $17100 - 17300
Price Target 1: $16400
Price Target 2: $15990
Price Target 3: $14990
Stop Loss: $18550

Bitcoin - Short Term ReviewToday you can review the technical analysis idea on a 1D linear scale chart for Bitcoin ( BTCUSD ).
Bitcoin price has been heading higher but it may meet resistance very soon as shown in the chart. Volume is low and RSI is headed towards resistance.
I have been calling drops on BTC since November and December of 2021. Be careful.
If you enjoy my ideas, feel free to like it and drop in a comment. I love reading your comments below.
Disclosure: This is just my opinion and not any type of financial advice. I enjoy charting and discussing technical analysis . Don't trade based on my advice. Do your own research! #millionaireeconomics

BTC Bitcoin Price Prediction for 2023I expect BTC to follow the stock market like before:
The first half of the year it could touch the $12K support and then rally by the end of the year to the $21000 resistance.
Looking forward to read your opinion about it!

Bitcoin: Bullish divergence on weekly rsiBitcoin has made a bullish divergence on the weekly rsi, meaning the price went lower while the rsi is making a higher high. Not only do we see a bullish divergence, the divergence is happening in a falling channel.
The only thing missing is a third confirmation of this bullish divergence. That confirmation can happen in 2 ways:
1: making a lower low on the price, while making an higher high on the rsi
2: makinga a double bottom on the price, while making an higher high on the rsi

BTC Analysis Log.= = = = = = = = = = = = = = = = = = = = = = = = = = = = = = = = = = = = = = = = = = = = = = = = = = = = = = = = = = = = = = = = =
All contents published here are my ideas / opinions and for reference purposes. Use these contents at your own risk.
I will try to use a single article to aggregate my analysis and monitor price movements.
= = = = = = = = = = = = = = = = = = = = = = = = = = = = = = = = = = = = = = = = = = = = = = = = = = = = = = = = = = = = = = = = =
First of all, I noticed that there are 07 price areas that I am paying attention to and there is a high probability that the market will react in these areas.
Please note: These areas are not fixed and will constantly change over time.
📍 Range: 6300 - 7650
📍 Range: 9000 - 10300
📍 Range: 16150 - 17400 ( ⚓ The trading price is in this range )
📍 Range: 18800 - 20700
📍 Range: 22700 - 24000
📍 Range: 29200 - 30600
📍 Range: 38350 - 39650
As of the time of this analysis, BTC is trading between 16150 - 17400 about 4.5% below its most recent low around 17590 on June 18 and is still holding up.
🔼 Positive opinion:
BTC will continue to fall to 15500 before rising to 18800 - 20700 or better straight to 22700 - 24000.
🔽 Negative opinion:
BTC will continue to rise to 18800 - 20700 and then continue to drop to 9000 - 10300 ( equivalent to 50% of value ) or drop directly to 9000 - 10300 ( equivalent to 40% of value ).
📊 I will continue to update in the update section below. ⬇️

BTC Long Trade Setup Idea to $17,300-600Based on my HTF Analysis and LTF Analysis I believe we will see a pump from here.
With good risk management this could be a nice trade setup.
NFA.

Anticipating A Bitcoin Position-TradeFellow Market Traders & Investors,
From what I understand, the market is geometrically predictable. It will form patterns to induce buyers/sellers to enter the market and purposefully creates entry triggers for liquidity to generate at market highs or lows. Once the order flow is built, it sharply moves, as supply and demand reflect price. This is why Support & Resistance are foundational to all forms of technical analysis. There is more beyond just drawings and historical data. The economic and geopolitical impacts are a leading factor that influences large institutions to consider equity re-allocation.
The 1.7 Trillion Omnibus Spending Bill will create uncertain tensions between the Fed and our faltering Dollar. As the money printers
kick into high gear, so too will the market. There will be a flush, a crash, before the market administers the insiders play. The insiders #1 goal is to remain at a net long and net short profitable hedge, as they exit shorts for massive profits, tricking the average investor to trap themselves at market lows; all the while, they are buying. While the SEC, and the FED aren't on the same page; the Senate is obviously out of touch with monetary policy and its repercussions.
Overall, I believe these fundamental factors may materialize in the charts. Watch for the bulls patiently, they are waiting for the right catalyst to join in. oh, and guess what? The large institutions balance sheets have increased because of the profitable down pour. Consequently, as they flip net positions, we will see bullish rally's and eventually the market will turn. Wait for the catalyist and rely on your strategy.
P.S.
Look at the Quarterly Chart Time-Frame! There is a 3 month Order Block/ Sponsor Candle. Anticipate...

Bitcoin Analysis 24.12.2022Hello Traders,
welcome to this free and educational analysis.
I am going to explain where I think this asset is going to go over the next few days and weeks and where I would look for trading opportunities.
If you have any questions or suggestions which asset I should analyse tomorrow, please leave a comment below.
I will personally reply to every single comment!
If you enjoyed this analysis, I would definitely appreciate it, if you smash that like button and maybe consider following my channel.
Thank you for watching and I will see you tomorrow!
You can also check out my previous analysis:

BTCUSDT - i wait for a clear setup previos idea
If you like the idea, please "Like" it. This is the best "Thanks!" for the author 😊
P.S. Always do your own analysis before a trade. Put a stop loss. Fix profits in installments. Withdraw profits in fiat and please yourself and your
your friends.

Financial Wave. Bitcoin, 1hBTC found support at $16560, our priority scenario is to start an uptrend from these levels with an upside target of $17300-17500. If the price of BTC drops to $16100, this scenario will be cancelled.

Bitcoin Market UpdateBitcoin Market Update
Entry $16600
Entry $16400
SL $16240
TP $17200
As new traders here, we're waiting for your feedback. Please like and comment on our ideas, and feel free to ask any questions in the comments. We'll do our best to respond to them all.
We wish you all a nice day and success in your trading today!

BTC Bitcoin - Weekly Chart Death CrossToday you can review the technical analysis idea on a 1W linear scale chart for Bitcoin (BTCUSD).
Bitcoin price on the weekly chart shows some concerns as the 200 and 50 SMA looks like it will be crossing forming a Death Cross. This would be the first time a Death Cross happens on the weekly chart for BTC in its history. It is estimated to happen in between January-February 2023. There may be a chance the Death Cross may be avoided if the price moves much higher or lower quicker. I see price come down to $7K-$8K. I still don't think that will be the bottom, but it may be a temporary bottom.
I have been calling drops on BTC since November and December of 2021. I am more concerned than before that more drops are coming. Be careful.
If you enjoy my ideas, feel free to like it and drop in a comment. I love reading your comments below.
Disclosure: This is just my opinion and not any type of financial advice. I enjoy charting and discussing technical analysis . Don't trade based on my advice. Do your own research! #millionaireeconomics

Bitcoin BTC Price prediction for the end of the yearThis week we have the CPI report and the FED meeting. I expect the stock market to go down and cypto to follow it.
My price target for Bitcoin BTC for the end of the year are the following:
BTC/USDT short
Entry Range: $16900 - 17100
Price Target 1: $16280
Price Target 2: $15990
Price Target 3: $14990
Stop Loss: $18265

BTC Bitcoin Price Review - Short TermToday you can review the technical analysis idea on a 1D linear scale chart for Bitcoin (BTCUSD).
The Bitcoin price looks like its forming a lower high as part of the downward market structure. There is a chance for the price to go higher as shown in the chart before heading down lower. Targets shown in the chart. To support the analysis, I have included the Ichimoku Cloud, RSI, Volume Profile (VPVR) and Fibonacci Retracement.
I have been calling drops on BTC since November and December of 2021. I am more concerned than before that more drops are coming. Be careful.
If you enjoy my ideas, feel free to like it and drop in a comment. I love reading your comments below.
Disclosure: This is just my opinion and not any type of financial advice. I enjoy charting and discussing technical analysis . Don't trade based on my advice. Do your own research! #millionaireeconomics

Bitcoin, 15minOur priority scenario in BTC is the rise in the price in wave b to the range of $17300-17500. If the price continues to rise above $17,500, our markup will change.

BTCusdt - local up, pls.
If you like the idea, please "Like" it. This is the best "Thanks!" for the author 😊
P.S. Always do your own analysis before a trade. Put a stop loss. Fix profits in installments. Withdraw profits in fiat and please yourself and your
your friends.

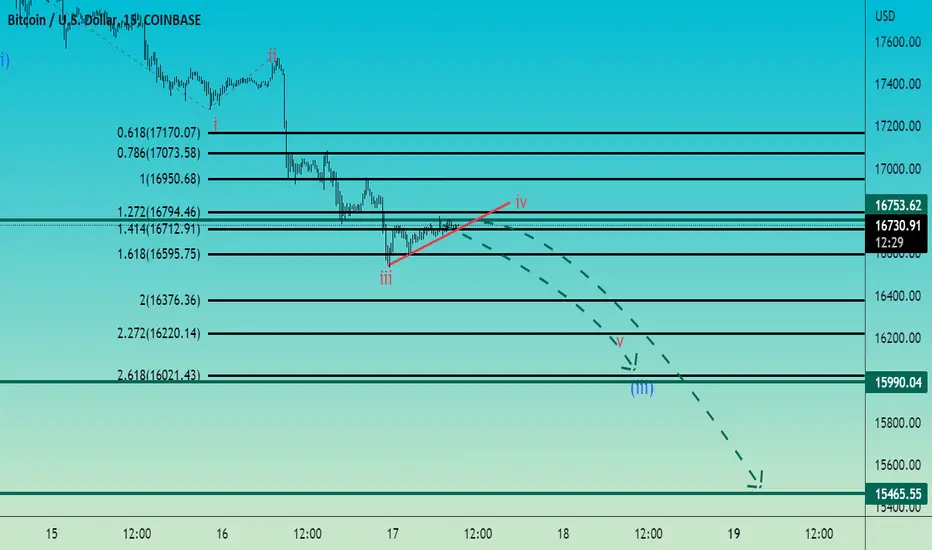
Bitcoin Elliott Wave count 15min TF This is my trade plan for Bitcoin.
Wait to break up the red slope trend line and enter short with 2 targets 16000 and 15500 and Stop lose above 16800.
Watch also related idea!!
Good luck!
I will post updates on this trade soon as we have more price action.
BRC Bitcoin Bearish Chart PatternBTC Bitcoin is in a Bearish Flag Chart Pattern forming a regional Double Top.
My price Target is $16675.
Looking forward to read your opinion about it.

WEN 10k BTC?We may have to move February's flash crash too June.... anticipate a slow rolling crab market that see's gradual capitulation over time as consumers are roiled alive by inflation. Less new money is entering, and others are exiting ahead of a potential market collapse. Rents are being raised to cover increases to homeowner mortgages. It is what it is...
There are other more desireable start ups doing actual business. You may be safer in small cap startups that produce an ebita.

Last 2 Scenarios for Bitcoin if we are Bearish Last 2 scenarios either we dip from here and make lower lows or we have a fake out to $17,400-600 then have a quick drop to lower lows.
I still remain bearish i doubt we are bullish but if were are bullish I dont see Bitcoin going any higher than $18,500-800 before making lower lows.

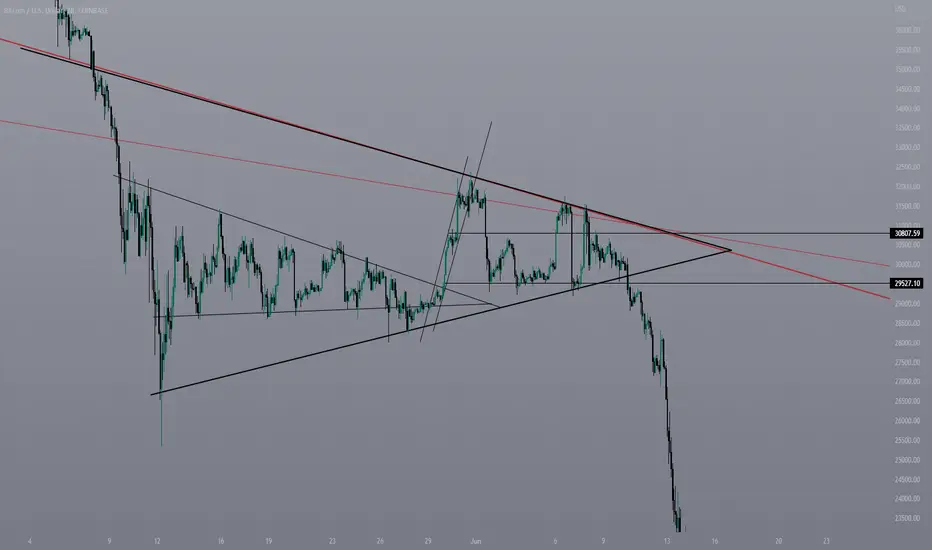
Bitcoin Right Now looks like when Bitcoin was at $32,000 Price is behaving similarly to when Bitcoin was at $32,000, lots of bull traps then a huge drop to $20,000 I think we could soon see $10,000 for Bitcoin.
Drop to $14,000 for Bitcoin SoonI cant predict or know how price will go but I have a strong feeling we wont be making any more highs now, this pump was the highest we will see bitcoin for a while. We could see another pump but I would short.
I highly doubt we will break above the white semi circle as there is strong rejection from those levels.
NFA, do what you believe at the end of the day.
