Bitcoin target 185000 by January 2026CEO of Blackrock Larry Finx cameout this week claiming CRYPTOCAP:BTC Bitcoin is the new digital gold and a wonderful asset to preserve capitol. The stars are aligning for the prophecy of a crypto supercycle to begin!
Bitcointrend

BITCOIN Breakdown of Whats Going On - 06/02/2024Hello everyone,
I have to update on update of previous post, to break it down little clearer for some of you, to explain why RIGHT NOW Im very causious...
For that purpose Im going from Highier to Lower timeframes, to get clearer picture of what is the MOST possible at this moment..
So, If we go from 5Day to 4h timeframe, its clearly to see that we are "stucked" in consolidation of last 5D candle, which was our "top" of 2023 and we are in process of "accumulation/distribution" either shorts/longs before moving further (as stated yesterday, longer we stay highier, chance of continuation of going highier increasing)...
So as you know, I WAS of opinion, that we should go lower to swept Sellside liquidity, before moving further... but since FED meeting changed nothing, I HAVE TO stick with my Highier TimeFrame perspective...
And thats it, as presented in Q1 update - Due to previous experience in similar market conditions I should suggest that until nothing change & FED start cutting rates, market will move Highier with Time until this change come!
Breakdown :
5 DAY -
to
1 Day -
On 1Day, we can see much better, that we first swept Buyside liquidity of that 1st Rectangle consolidation, before we processed to swept Sellside liquidity... BUT NOW, we came EXACTLY BACK where we WAS, which SHOULDNT be CASE if we continuing LOWER with confidence...
So, we HAVE TO go to 4hr, to make "better and clearer" guess of whats happening...
4h -
So , I added 1 more layer of rectange... which is LAST WEEK RANGE...
You can see, its relatively tight with its own "consolidation" (i put green cut line between for better visibility)... and YESTERDAY, we firstly swept highs, then lows and now we proceeding to going back up.. in this case, IF WE ARE ABLE to MOVE ABOVE that FED HIGH I would expect with high probability of moving further up, ONCE WE GET ABOVE OUR CONSOLIDATION BOX, both of them!
-- One more 4hr chart with SMA , which I do not use as "trading tool", but in my obsertvation-> When they are stacked like now and we moving in tight range in same time.. WHEN Price BREAK above/under them with "test" - in most cases it continuos in that direction for pro-longed period of time.
Hopefully, this helps some of you with your perception of market.
If YES, please consider liking or sharing this post, it would mean a lot for me. Thanks
Joe

Bitcoin #BTC - Accumulation of the decade?Historically, 2 confluences has been great time to pick some cheap bitcoin. Is this time different? Maybe but until it is proven wrong it is not.
200 Week moving average
Logarithmic curves
As the chart suggests, we not only have 2 but 3 confluences as 1.618 Fib level is close (Green Box)
Yes this does mean in short term we may visit lower levels but this could arguably be accumulation of the decade.
200 WMA has been a great support for Bitcoin as unless some "black swan" event occurs, I do see it holding for Bitcoin.
We have broken lower from the logarithmic support band but it isn't the first time it happened and that can be seen as an "opportunity" rather than a broken model. Price is short lived at those levels.
I firmly believe "all models are wrong, some are useful"
Lemme know in the comments if I am missing anything and I will plot it for you.
Trade well.

BITCOIN Weekly Outlook 05/02/2024Hello guys,
great week to everyone.
So my view on BITCOIN didnt change in last days.
I think the IDEA from last Update is still in play.
But - Im staying alerted, since trading range is getting squeezed into tight range, so I would be expecting highier tide of volatility to come sooner rather then later. For this reason, I would again suggest to EVERYONE to use STOP LOSS.
Reason why Im somewhat "alerted" is - longer we stay in highier price range, without moving further down, in my view, it increasing chances of our idea to be WRONG- and as stated in big Q1 update, until FED start cutting, or somethiing going significantly wrong, market will go highier with time... So this would invalid our view.. BUT UNTIL IT HAPPEND we need to suggest that Sellside liquidity is the 1st target before potentional continuation of move upside since that how chart present itself after meeting...
Hopefully, this helps some of you with your perception of market.
If YES, please consider liking or sharing this post, it would mean a lot for me. Thanks
Joe

BITCOIN FED Meeting Aftermath 01/02/24'Hi again...
As I ment in into, I think this FED meeting was kinda good lead what to expect next, especially because J.Powell insight, since he run the show.
To understand better my Idea whats going on, I try to break Weekly time frame into Daily chart posted under..
_________________________________________________________________________________
So, in my understanding all what every Asset does, is Run between certain Liquidity targets and in right Time it displace. This process is repeated endleslly..
When we Check our bigger time frames Week+ , Its clearly to see that we extended to Highier prices due to many factors and if History is any indication we always should expect Run BOTH sides of liquidity before next displacement...
Meaning, since we go too much extended on Buyside in 2023, there is left huge amount Sellside liquidity which will be aimed at some Time point, it is just not 100% clear if its gonna unfold NOW!..
________________________________________________________________________________
So when we move down, from Weekly to Daily chart, its easy to SEE, HOW we Runned between these TWO RED lines for a LOT of time.. and occasionally it moved above/bellow to take that liquidity...
NOW - Most imporstant for ME, is YESTERDAY reaction, where we rallied close to 44k as expected possible scenario, and then we REVERSED, to lower 42k where we at RIGHT NOW.
SO, as LONG as Price not RUN above YESTERDAY highs, and keep being there, I WOULD EXPECT WITH HIGH PROBABILITY that next Price liquidity range is BETWEEN GREEN lines... as soon as we reach this Liquidity, our outlook must be reevaluated once again!
Aswell, since we still in after FED meeting pre-market, I would expect little bounce bellow yesterday highs, before real move lower start unfolding.. So be carefull into JUMPING Short straith away.. rather check Lower (15min/5min) time frame, for picking the Best entry oportunity with sound STOP LOSS in CASE asset decide to run highier...
Hopefully, this helps some of you with your perception of market.
If YES, please consider liking or sharing this post, it would mean a lot for me. Thanks
Joe

BTC Market Cycle | Repetitive and Predictable Market CycleThe Bitcoin market cycle can be easily predicted by studying historical data. Whenever you seek an idea of where the market is heading, you can always look at the past to gauge the future. However, this doesn't guarantee that the predictions stated here will unfold exactly as described; it's a PREDICTION, not a fact.
Let's examine the chart displayed here. The market cycle repeats itself every four years, with our chart divided into four cycles, the fourth being the current cycle we are in. Every four years, Bitcoin undergoes a major event known as Halving, where the number of blocks containing Bitcoins is halved every four years. We started with 50 Bitcoins released in a block every 10 minutes; in 2012, that amount was reduced to 25 BTC. In the following cycle, it was halved again, and this will continue to happen every four years until all Bitcoins are mined. Currently, we are heading towards the fourth halving event, which will see the number of blocks released reduced to 3.125 BTC.
Due to this event, the price of Bitcoin appreciates in value every four years. This is driven by supply and demand, as fewer Bitcoins are mined than in the previous four years (reduced supply), creating scarcity and increasing demand. The mining difficulty also increases, causing miners to be reluctant to sell the Bitcoins they've mined, contributing to the price increase.
On our chart, we have three completed cycles that look almost identical. The cycles consist of a bull market where the price experiences a significant increase, followed by a bear market where the price drops in the range of 80–85%. This is followed by the first expansion, where we see a slight price increase, followed by the first accumulation phase. Prices move up and down within a specified range during this phase, also known as the consolidation phase. We then move on to the second expansion and the second accumulation, usually forming just before or within the halving period.
This not only shows us that the market cycles are similar but also allows us to predict future events. At the time of writing this, we are three months away from the fourth halving, and it appears we have entered the second accumulation phase, as seen in the past three cycles. Prices should trade in a specified range for a few months after the halving. When you examine the halving events on the chart, you can observe that we usually enter the bull run somewhere between 6 to 8 months after the halving. Based on that, we can predict that the next bull run will start between October and December 2024, lasting until the fourth quarter of 2025.
In the past, the cycles have been accurate, and we can expect the same unless a global catastrophic event occurs, as seen in March 2020 during the COVID-19 pandemic. In that phase, there was no second expansion as all markets crashed. It is my opinion that this led to the bull run not reaching its full potential. Had we experienced the second expansion, the price would have moved slightly higher before the second accumulation phase, leading to an extended bull run pushing the price near or above $100k.
My price prediction at the end of the cycle, assuming world events stay normal, is to see Bitcoin in the range of $120–150K.
What do you think the price of Bitcoin at the end of 2025 will be? Like, share, and feel free to leave a comment. Let me know if you agree or disagree with this analysis.

Bitcoin Fail to Break 40K Please Notice the Fake breakout , this move made to fool traders to open short and then squeeze them out the market , i expect the price will keep rise up , Cheers

BTCUSD higher before continuing lower.BTCUSD is retracing higher possibly towards 44300 area. From this it is expected that it will resuming lower with eventual target of around 32000 area.

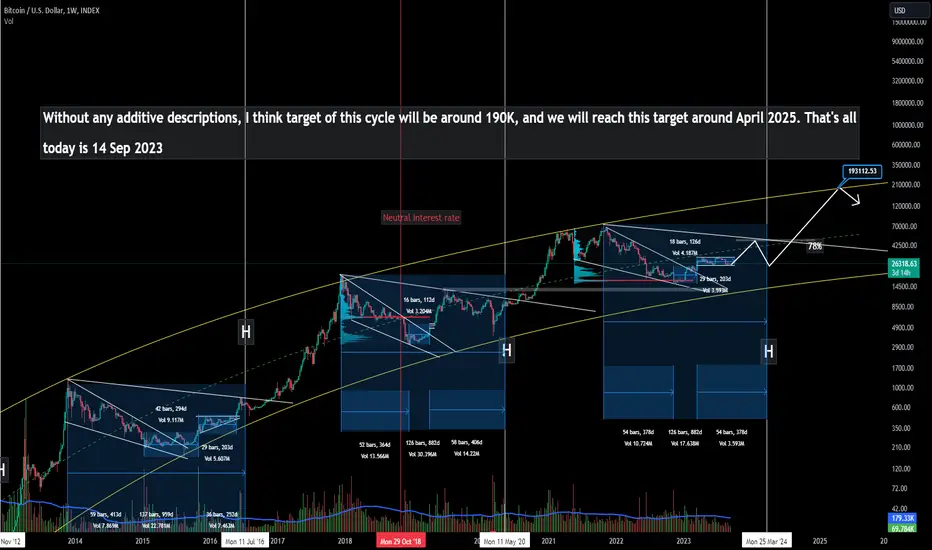
My expectation for Bitcoin for next 2 years Without any additive descriptions, I think target of this cycle will be around 190K, and we will reach this target around April 2025. That's all
BITCOIN is bearsh?BITCOIN might be heading towards 31000. First stop is 40000 area before moving towards 38000 area. Wait and see price action at 38000 area. The bias is most probably bearish and might be price move toward 32000.

3 Solid Reasons Of Why Bitcoin#1 With Bitcoin you can confirm every transaction which means
that with a hardware wallet you can transfer Bitcoin
Directly to it without third party confirmation service
--
Such as when you are using a browser wallet.
--
#2 Bitcoin is open source which means that you can send and recieve it
from anywhere around the world without paying license fees.
--
#3 You can store Bitcoin on your hardware wallet which has
device protection which means that you will be able to lock
your hardware wallet with a password of your personal choice.
--
Rocket boost this content to learn more
**Disclaimer:**
The information provided above is for educational and informational purposes only.
--
It does not constitute financial advice, and trading always involves
--
a risk of substantial losses, regardless of the margin levels
--
used. Before engaging in any trading activities, it is crucial to
--
conduct thorough research, consider your financial situation,
--
and, if necessary, consult with a qualified financial advisor. Past
--
performance is not indicative of future results, and market
--
conditions can change rapidly. Trading decisions should be made
--
based on careful analysis and consideration of individual
--
circumstances. The user is solely responsible for any decisions made
--
and should be aware of the inherent risks associated with trading in
--
financial markets.

BITCOIN Weekly Outlook - 22/01/24 Hello everyone,
as I ment in last week idea, I am expecting BTC rather going LOWER then Highier,
prior to FED meeting which is next week.
Since we doesnt have much volatility last week, Im would expect bigger moves to occur later this week, when Market related reports start coming...
To understand further view I would suggest to first check this out:
As right now: I would suggest be very carefull with NEW trade opens , and manage them very carefully since there is potentionall for liquidity swept due to low range last week...
So, everyone who WAS Short before this post or decided to go Short after, should be in favorable position right now. (opening price at time of post is represented by purple dotted line)
Our Liquidity Sellside targets are same as was last week.
BUT what would I suggest to everyone, and doing myself is ↓↓↓↓↓↓
Create STOP LOSS order ABOVE weekend Highs
WHY? , - Have in mind, we are still in Monday PRE-MARKET, if we all of sudden reverse today, before late week news drivers, we can potentionally go to OTE targets from last week. And in that case we would LOSE on our trade... Thats Why we wanna create STOP LOSS order above weekend price BUT under our OPENING price. So even if market reverse, our position still be closed in very small profit but not end in loss!!!
Hopefully, this helps some of you with your perception of market.
If YES, please consider liking or sharing this post, it would mean a lot for me. Thanks
Joe

Bitcoin Structure updateThe price is still in Stage 1. Although internal consolidation looks bullish. Volumes are dried up when price pulls back and expansion when price moves up can be seen. The bullish spreads are also getting wider. Some traders will perceive the internal structure as inverted H&S, while some will see it as Cup and Handle pattern. Reminder - We still need a decisive breakout of the Stage 1 Range or neckline. The next major overhead supply turns out to be around $47,000.

BITCOIN TO GO SHORTBitcoin just broke through the inflection point towards the value area and has reacted with the value area. This could mean that there is a very high possibility of Bitcoin going short for the next months. This means that 2024 could overall be a "short" year for BTC.
So what could this mean for investors concerning Bitcoin ?,
Firstly it means that if price presents opportunities to buy , we could expect short asset holding periods on Bitcoin.
Secondly, this first quarter will be the best time to sell of BTC assets as the prices for selling Bitcoin for the year may currently be at its highest value.
Thirdly, the 4th quarter of the year might be the best time to buy BTC at low and good prices for holdings.
I provide personal BTC investment advices, so if you will want more insights and information on when to buy, hold and sell your Bitcoin assets, kindly DM me here on trading view and i will reach out .
Also if you found this information helpful please do like , share and comment on your thoughts and do follow me for more as well.
Thanks for reading

Bitcoin Bitcoin is currently forming a FLAG & POLE pattern.
Wait till it breaks the descending trendline and retest plus bounce from it.
Max target would be 50000.
Be careful of liquidation candle

BTC → Bitcoin Sell-off at $45,800! Time to Short? Let's Answer.Bitcoin made it to the measured move target at $45,800 which was followed by a massive 11% sell-off in the course of an hour. This is the second major sell-off at these levels in under a month. Is this the opportune time to short?
How do we trade this? 🤔
We have several data points in favor of a short. We've completed a Measured Move, three legs up in a bull trend, two massive sell-offs (8% and 11%) in under a month at the major resistance level of $46,000 and an RSI under its Moving Average. I also have my Bitcoin Lifetime Analysis which describes in far more detail, why we need a massive pullback before we see new all-time highs:
We need to wait for a 4HR candle to close below its 200EMA or a Daily candle to close below its 30EMA. You could argue its reasonable to short now, but we lack confirmation, so the probability of profit is lower at this stage. I prefer more probability in my trades.
💡 Trade Idea 💡
Short Entry: $42,600
🟥 Stop Loss: $46,900
✅ Take Profit: $38,300
⚖️ Risk/Reward Ratio: 1:1
🔑 Key Takeaways 🔑
1. Measured Move Complete!
2. Two Sell-offs near the $45,000 area
3. Three Legs Up in a Bull Channel
4. RSI at 52.00 and below Moving Average, Bias to Short.
5. Wait for Final Sell signal, Short 1:1 Risk/Reward.
💰 Trading Tip 💰
There is over a 60% chance of a measured move after the breakout of a major resistance, normally, a trading range. That means the distance from the trading range resistance, to the top of the breakout, will happen again above the top of the breakout.
⚠️ Risk Warning! ⚠️
Past performance is not necessarily indicative of future results. You are solely responsible for your trades. Trade at your own risk!
Like 👍 and comment if you found this analysis useful!

Will Bitcoin see 65K$Now Bitcoin is near $47K. $47K is the next resistance level for Bitcoin. If it passes this level, I predict that it can arrive at $60K and then FWB:65K in the near future. However, if it shows a reaction to $47K, I predict a correction till $37K. The correction can continue till $32K too in a pessimistic mood.
Anyway, I'm optimistic about Bitcoin's price in the near future because of some news about its ETF. In 2024, I hope it will see high prices.


Bitcoin on december and next year 2024Hello traders, i have very freaky ideas about bitcoinas follow: If bitcoin can not exceed 40000$ for next few weeks we will see a big dump to 10000$. Im writing this to think and consider probability about unthinkable cases that any trader may face just be ready for
everythings.
Big short
Sl:40000
Tp for long term: 10000
Period of time that this analysis stand: 6 weeks most after that if it can not break 40000 or fall bellow 31000 it s going range for long time.
Be profitable.

BTC bitcoin outlook 25-31i will be looking for longs to continue the bullish trend on the higher timeframe if we get confirmation of it at the highlighted SnD.
as always, follow your trading rules and position yourself wisely

$BITCOIN - One Huge Bull Flag and You are Going to Miss outQuite possibly the greatest bull flag pattern you will ever see

Will History Repeat Itself? - Hunting for ARCSThe Bitcoin chart showcased illustrates the characteristic parabolic arcs that in the past heralded significant market turning points. These arcs depict periods during which the price of Bitcoin rose sharply, only to experience equally vigorous corrections. Such patterns raise the question - will the current price movement of Bitcoin conclude with a similar parabolic arc? This visualization aims to direct investors' attention to these potentially key formations, which could act as signposts for predicting future price movements. Recognizing these arcs becomes a "hunt," where traders endeavor to discern potential warning signals before market history repeats itself.

Bitcoin's path to a new all-time-high of 138k USDThis is my forecast of the path that BTC will take to reach its new all time high of 138k USD on 18 May 2025!
