Long SOL 3HKeep your trading simple 🚀🚀🚀
Long SOL 3H trend continuation trade.
First target: 1:1
Exit: Trend reversal/stop
Not a financial advice just my tradingview - trade smart trade safe.
Follow me to support my work, Thanks!
Bitcoinusd

BITCOIN - Bearish Double TOP 📉Hello Traders !
On The Daily Time Frame, The BTCUSD Reached a Resistance Level.
The Price Formed a Double TOP Pattern.
Currently,
-The Neckline is Broken.
So I Expect a Bearish Move 📉
i'm Waiting for Retest...
-----------
TARGET: 38650.00🎯

BITCOIN - Double TOP Pattern 📉
As We Talked in The Previous Analysis:
On The Daily Time Frame, The BTCUSD Reached a Resistance Level.
The Price Formed a Double TOP Pattern.
-The Neckline is Broken.
Currently:
The Price Pull Back to The Neckline.
and Now it Will Continue its Bearish Movement 📉
TARGET: 38650.00🎯

BTCWe said that we bought above that box and purple lines, and until we are below it, it is currently attractive for scalp
Now another area has been added to that area and we are going for green lines

BITCOIN - 2 SCENARIOS 📉📈Hello Traders !
On 1H Time Frame, The BTC Price Reached a Resistance Level (42500.00 - 42578.02)
Currently, We Have 2 Scenarios:
Bearish Scenario📉:
If The Market Breaks The Support Level and Closes Below That,
We Will See a Bearish Move...
TARGET: 41500.00🎯
Bullish Scenario📈:
If The Price Breaks and Closes Above The Resistance Level !
We Will See a Bullish Move📈
TARGET: 43000.00🎯

Why are you sitting on your hands?There are numerous indicators screaming buy for the last 4 months. we are in the best buy zone of our time RIGHT NOW!!. The evidence is over whelming that the bottom is in!!! Why are you waiting? Why are you listening to the news? is it different this time? Not really.
In previous history by the time the lower BLUE band flashed the CM ADX the bear market was ending . so lowered prices preceded the blue. This time was different... what?? yes it was. the BLUE flashed and then the price followed, however the stochastics are CM MACD is about to cross up and this is a bullish indicator. One other trend is this blue buy zone is getting smaller every time it happens.
The bear market looks like it will be ending by March/April of 2023.
Thanks for looking
comments and questions down below.

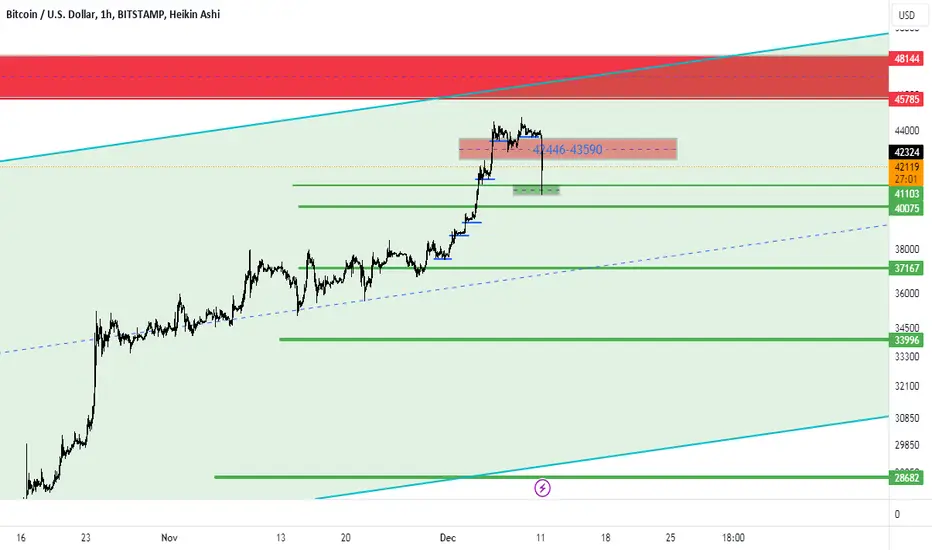
btcUpdate
The green box is very important. If the numbers below it fail, it will be activated. The first resistance point that can be seen was the green box, which has now become a red box.
Bitcoin Head & shoulders... Will bears become bulls?I hope to see some clear action in the next hour.
Will work on the targets for profits.
I am already in at the moment.
Will this chart cause all the people who sold to FOMO back in at the top???
NOT FINANCIAL ADVICE WE COULD SEE 70+K OR 7....

BITCOIN about to run?The chart loos bullish to me.
Currently I have bought back in and also added heavily to my Helium (HNT token) Bag.
We could see some crazy things.
Many people believe in the SUPER CYCLE or the ABC from the ATH.
I believe most in both of those parties believe we can go above 46.5K!!
If shit hits the fan or I am up late tonight I will Send out an update or an extra idea or two.
NOT FINANCIAL ADVICE!!!
Much love peeps!

NKNUSDT hit first target 36.04% ✅🚀#NKNUSDT
All Targets: done✅
Entry price: 0.0935$✅
Price reached :0.1272$ ✅
Profit: 36.04% ✅🚀🚀🤑

BTC Update Alt Coin Update 05 Dec 2023BTC Update Alt Coin Update 05 Dec 2023. CHeck all the update on BTC and ALT Coins

A bearish 2024 - 14525?Trying to speculating how bitcoin can feasibly reach 6 figure targets by developing bull structure in the form of a large pennant. This would imply a significant pullback to form new lows targeting 14,525 in 2024. Would need to see signs of weakness around this current price range ideally 45.5k rejection, however price can continue further in which case the structure of the chart would need to be reassessed to figure out what in the actual FibOnaCCi is going on.
Key prices in this analysis.
45,505.
14,525.
261,000.
No one knows where the market goes, the best guess wins. Oh, and blame yourself if I'm wrong.

Can Bitcoin Hedge Against a Falling Dollar?Global inflation often signifies a weakening of global currencies. The question of whether Bitcoin can serve as a hedge against a depreciating dollar has gained significant interest among investors.
Or should it still be the Gold?
In this study, we will analyse the top 8 cryptocurrencies to determine which one is a more reliable currency hedge.
Bitcoin & Its Minimum Fluctuation
$5.00 per bitcoin = $25.00
BTIC: $1.00 per bitcoin = $5.00
Code: BTC
Micro Bitcoin & Its Minimum Fluctuation
$5.00 per bitcoin = $0.50
BTIC: $1.00 per bitcoin = $0.10
Code: MBT
Disclaimer:
• What presented here is not a recommendation, please consult your licensed broker.
• Our mission is to create lateral thinking skills for every investor and trader, knowing when to take a calculated risk with market uncertainty and a bolder risk when opportunity arises.
CME Real-time Market Data help identify trading set-ups in real-time and express my market views. If you have futures in your trading portfolio, you can check out on CME Group data plans available that suit your trading needs www.tradingview.com

Posible Bitcoin BTC price moving for next weeksThe growth of the BTC price has reached a vertical and un corrected value.
For the growth trend to continue harmoniously, a correction would be helpful.
Two GAPs have formed on the CME BTC chart in the ranges of $39310-40480 and $34100-34400, which would be good to fill.
Altcoins can still "catch up" with the growth of the BTC price for a few more days, at least for now they are showing strength, but they can also "stone down".
We personally do not feel comfortable taking longs at the likely highs, so we would rather place limit buy orders well below current prices to avoid tempting fate.
_____________________
Did you like our analysis? Leave a comment, like, and follow to get more

Bitcoin Correction is ComingAs You All Can See Bitcoin Rapidly Growing Without Any Correction Since The Month Of November. But Currently Btc Is At The Point Of Greedness And Liquidity In My Perspective.so Btc Should Take Correction To Show Us A New Way.

Feeling Brave?! Sell Bitcoin Now at 50% FibJust under 42K in BTCUSD is the 50% Fib of the entire drop from record highs to the 2022 low. It is also the objective from the recent triangle breakout.
Note: this is very counter momentum - which are usually works out pretty quickly - either in profit or loss! Also - the triangle is probably part of a bull pennant in which case the upside objective is more like 49K.

Is $43310 a Local Top for #Bitcoin?Hi Padawans,
I've recently acquired the candlestick pattern from the 4000 to 69000 rally and strategically positioned it in the current scenario.
Disclaimer: I am not a financial advisor.
The 2.618 projection aligns with the 43310 mark.
Disclaimer: I am not a financial advisor.
May the force guide your endeavors.
Cheers,
CryptoObi

PERFECT MATCH FOR SHORTSo much confluence at 39300 - 39600
- 1.618 Reverted fib
- 1.23 extention
- 1.0 double extention
- Bear div at higher TF
Please be aware it could fly aswell
I will take a short position in this range as a hedge ( 26.000 long - 37700 long )

BTC ₿ Broadening Wedge: A Forecast from Support TrendlineDear Respected Investors,
For those familiar with our track record, the customary elements on the chart should provide a sense of familiarity. If you're new to us, let me offer a brief introduction. We specialize in educating individuals on creating their trading AI, often utilizing advanced charting tools like TradingView for explanatory purposes. This particular idea is a collaboration between AI and TradingView.
From an AI perspective, this chart results from a sequence of trading bots using a technique known as boosting, employing a random forest algorithm to define forecast subsets. Simply put, the displayed chart represents the culmination of the latest bot's analysis, incorporating insights from all preceding bots in the sequence. The AI has identified a chart pattern known as a broadening wedge, typically signaling a continuation pattern. Assuming a bullish trend, this pattern suggests a continuation of positive momentum.
The support trendline of the wedge, traced from local bottoms within the wedge zone, is noteworthy. The recent retracement to $35,800 aligns with this trendline. The potential upward movement could extend to the wedge resistance, marked by the upper blue trendline at $39,500. These two trendlines illustrate the broadening wedge on the chart.
While our AI leans towards an optimistic scenario, it's crucial to acknowledge the inherent volatility associated with broadening wedges. Accordingly, we've set a stop-loss below the support trendline. We also encourage you to leverage all available safety measures.
This isn't investment advice, so thorough research is recommended.
If you find our work intriguing, we're open to sharing more about our AI's trading analytics with Santiment indicators and insights on training your AI to incorporate Santiment.
Warm regards,
Ely

Risk/Reward favors downside shift to risk Off Sentiment.. BTC has reached a crucial point in which candles appear to be failing around 35K. We must consider potential scenarios to begin the new month of November. In One of these scenarios we may anticpate a retracement to capture fomo liquidity. Fomo liquidity is psychological concept in trading that refers to the chasing of price.
New Monthly candle retracement for liquidity purposes.
Current : 34775
33,372 TP 1
TP 2 30,300 Weekly Level
Trade idea Fakeout back below 35K

Story repeats itself- i have to post this chart.
- it seems some peoples didn't get what i posted in one of my older chart.
- i will post this chart in comments.
- Remember this is not a price prediction.
- Everything is just about comparing the past and the present.
- in 2018-2019 BTC was fluctuating in bearmarket with 4 Digits.
- Now BTC is fluctuating in bearmarket with 5 Digits.
- We are evolving in a different trend.
- All in graphic and hope you get the idea.
Happy Tr4Ding !

Bitcoin $52kBull to bear perspective for the next year and a half.
52.3k rejection and an assessment to see if the recent parabolic trend breaks, if so structure needs to be assessed for potential head and shoulder formations. Downside target could be as low as 7.2k. Always assess risk and always be prepared to be wrong.
The downside drop is contingent of a bearish outlook on the stock market, and for the interest rate hikes over the last year to finally take effect. Also the swing from 3k to 69k, it would be ideal for price to rationalise this sudden rise by coming to the lower levels sub 10k before commencing the actual big bull. For now, enjoying these mini bull and bear cycles seem to be the name of the game rather than hodling and hoping. Further, a rejection at 52.3k in January would be the ideal time for an ETF approval, as we have seen approvals lead to large declines in the past.
:D

BTC BEARISHNESSBitcoin price is likely to deep ,forming an ending diagonal btc is likely to deep and by wycoff distribution every thing is also bearish
