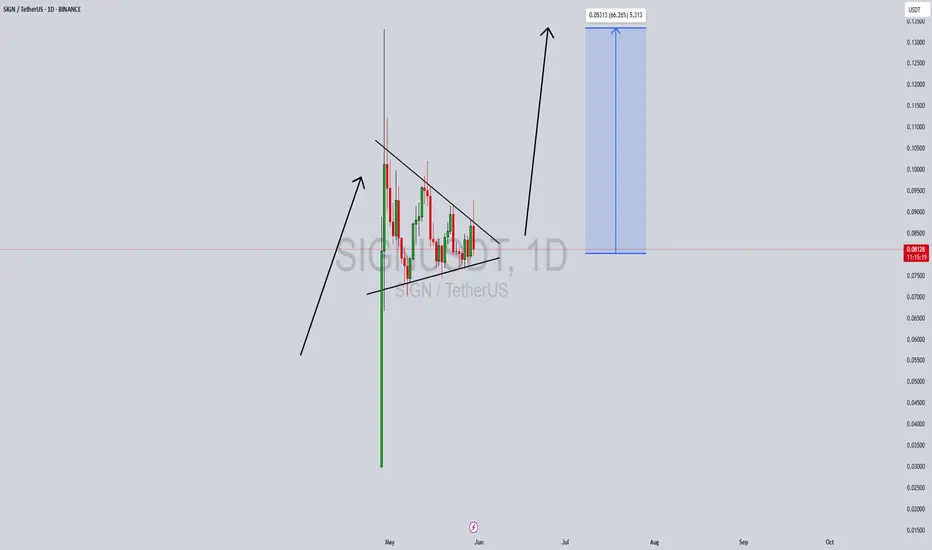
SIGNUSDT Forming Bullish Pennant SIGNUSDT is currently exhibiting a strong bullish pennant pattern on the daily timeframe—a continuation setup that often precedes substantial upward movement. Following an aggressive price surge, the pair has entered a brief consolidation phase within converging trendlines, suggesting that bulls are simply regrouping for the next leg higher. This is typically a bullish signal, especially when paired with increasing volume and positive sentiment surrounding the project.
The volume has remained healthy during the pennant formation, indicating sustained interest and participation from investors. With a clean technical structure and no major overhead resistance in the immediate zone, SIGN has positioned itself for a breakout move. Based on the height of the flagpole and the pattern formation, a price surge of 40% to 50% is anticipated, with targets aligning near the $0.13 zone. Such a move would mirror the breakout potential we’ve seen in similar setups across the altcoin market.
From a sentiment perspective, market participants have shown growing confidence in the SIGN project. Social mentions, trading volume, and overall engagement metrics are on the rise. This kind of grassroots enthusiasm often precedes strong rallies, and with Bitcoin and Ethereum holding steady, the stage may be set for altcoins like SIGN to shine. Technically and fundamentally, the alignment for an upward push appears to be falling into place.
Traders should watch for a clean breakout with volume confirmation above the resistance trendline. A decisive candle close above the pennant could act as a strong bullish catalyst. Risk management is key, but the risk-reward profile currently leans heavily in favor of the bulls.
✅ Show your support by hitting the like button and
✅ Leaving a comment below! (What is You opinion about this Coin)
Your feedback and engagement keep me inspired to share more insightful market analysis with you!
Bitcoinusdt
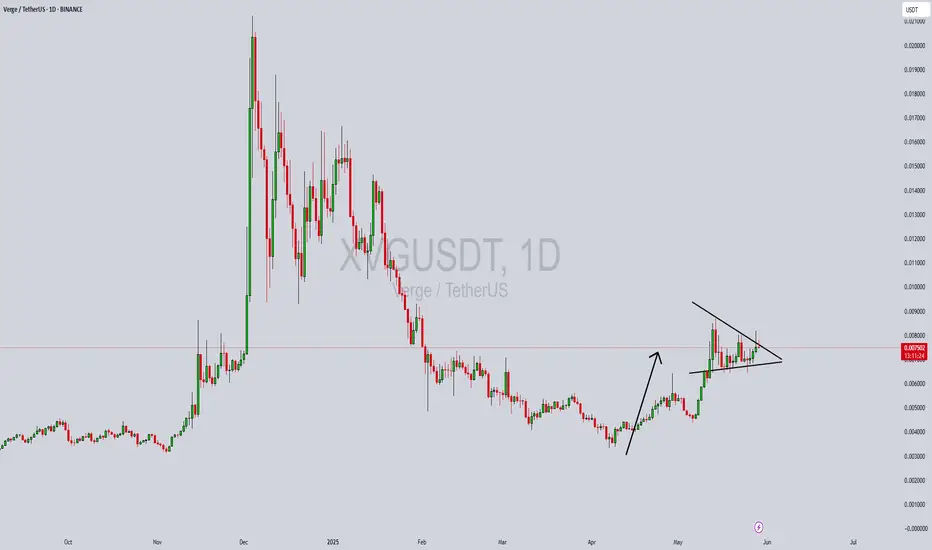
XVGUSDT Forming Bullish PennantXVGUSDT is currently showcasing a bullish pennant formation—a continuation pattern that typically signals the resumption of a strong uptrend. This pattern forms after a sharp upward move, followed by a period of consolidation, which is now evident in XVG’s price action. With the pennant nearing its breakout point and volume starting to pick up, the probability of an upward breakout is increasing significantly.
This setup often draws the attention of traders and investors, especially when paired with rising volume and solid project fundamentals. The consolidation within the pennant suggests accumulation, while the narrowing structure indicates that a volatility expansion may be imminent. If price breaks above the pennant resistance with confirmation from volume, XVG could realistically achieve a 40% to 50% move in the short to medium term.
Market sentiment around XVG is improving, as it's regaining attention due to increasing on-chain activity and renewed interest from long-term holders. The bullish pennant, when forming in a broader market recovery or bullish environment, can act as a strong springboard for price. Traders looking for technical breakouts are already watching this pair for a potential entry setup.
With investor confidence growing and XVG forming a powerful bullish pattern, this crypto pair holds strong upside potential. Keep a close eye on the breakout level, as a decisive move above it could mark the beginning of a significant rally.
✅ Show your support by hitting the like button and
✅ Leaving a comment below! (What is You opinion about this Coin)
Your feedback and engagement keep me inspired to share more insightful market analysis with you!
BTCUSD Technical Analysis – V-Shaped Recovery Points to BreakoutBitcoin (BTCUSD) is showing strong bullish momentum following a textbook V-shaped recovery from the recent support zone around $73,699. After consolidating and breaking the descending channel, BTC surged with conviction, reclaiming critical levels and now approaching the previous All-Time High (ATH).
Key Technical Highlights
Pattern: V-Shaped Recovery
Support Zone: $73,699 – $75,000
Resistance/ATH: $109,255
Trendline: Long-term bullish trend remains intact
Recent Breakout: Clean breakout above the falling wedge/descending channel
BTC has reversed sharply from the bottom, printing higher highs and higher lows. This aggressive rebound has brought price action back toward ATH levels, with strong chances of a breakout continuation.
The structure suggests bullish control, especially after retesting key areas with strength.
Bitcoin Dominance at 62.2%
Bitcoin's market dominance sits at 62.2%, showing clear investor confidence and capital preference for BTC over altcoins. This dominance level reinforces the bullish bias as smart money flows into Bitcoin in anticipation of a potential price discovery breakout.
This trend, along with large institutional inflows, highlights a growing belief in BTC’s strength as a leading asset, especially in the current macro environment.
BTCUSD Trade Setup (As Per Chart)
🎯 Entry $104,732.85
⛔ Stop Loss $99,507.06
✅ Take Profit $114,359.25
The trade idea is based on the continuation of the current uptrend and breakout above $109,255, which previously acted as resistance (ATH). A clean daily close above this level would likely open the path toward $114,359 and possibly $116,000+ as the next milestone.
BTC is primed for a new leg higher. The market structure favors bulls with BTC dominance rising, large investments entering, and strong technical recovery in place. If Bitcoin holds above the entry zone and pushes through ATH, we may see a new high forming in the coming weeks.

BTC is trading within the equilibrium zone and..Bitcoin is now trading within my equilibrium zone. This will be one to watch for clues about the broader market, as it's currently leading the way.
Good luck, and always use a stop-loss!

Bitcoin may see $67k - Monthly timeframeHere is the monthly chart of the bitcoin. Based on price action analysis, we have a broad bull channel. We can see 2 price action signs here:
1- Second leg in the bull channel, we call it second leg trap
2- A climactic move to the top of the channel (biggest bull bar late in the trend)
Given the context, there is 60% chance that we see the bottom of the climactic move, which is $67,000.
The pessimistic perspective is that the bitcoin may see and test the bottom of the channel, around $50k.

BTC Diamond Ser ?- While bears see bearish pennants, I see diamonds in the rough.
- I remain bullish, not due to the price, but for the sake of humanity.
- This isn’t an analysis, just a light-hearted joke, so please don’t roast me too hard! 🙏.
- Remember, diamonds are forever.
- Hodl!
Happy Tr4Ding!

BTCUSDT – Big Move Incoming, Key Level To watch!Bitcoin is approaching a key decision area after a few months of downward pressure. The chart shows a clear bearish structure with lower highs and lower lows. Recently, a possible double top has formed just below the major resistance near 88.668, which could suggest a short-term pullback if buyers don't step in.
If the double top plays out, a retest of the support zone between 78.576 and 82.000 is likely. This zone has held well in the past and could act as a strong base again.
However, if price manages to break and hold above 88668, that would be a strong signal of strength. It could mark a shift back to a bullish trend, with the next major target being the all-time high area around 108.360.
Key areas to watch:
Support: 78.576 to 82.000
Resistance: 88.668 and 108.360
Right now, Bitcoin is at a make-or-break point. A breakout could trigger a strong rally, while rejection may lead to another dip. Stay patient, watch how price reacts at these levels, and let the market confirm the next move.

Bitcoin - 2025After a long consolidation around $100,000, and a correction of ~32% from the top, it seems we are preparing for a new move.
In the previous idea, I mentioned that there could be either consolidation or a healthy correction, but both happened.
I will describe several scenarios that I see.
I will describe only positive, super-positive and ultra-positive ones.
Since the negative sounds like this - we have already reached the peak, there will be a small over-high, and we will go bearish.
Positive scenario - parabolic growth, with a new peak in the region of $150,000-$200,000
Super-positive scenario - parabolic growth, with a new peak in the region of $200,000-$300,000
Ultra-positive scenario - parabolic growth, with a new peak in the region of $300,000-$400,000
Now you must ask - can we really reach $400,000, how is this possible, with the current price of $84,000, and April outside the window?
I will tell you that there is nothing complicated or incredible here, that is why it is ultra-positive.
But you should focus only on positive and negative scenarios, and not float in the clouds hoping for a miracle.
As for altcoins, in this scenario, I don't think Bitcoin dominance will last long, so high, in any case, soon there will either be an overflow and altcoins will start shooting, or we will all die from the paws of bears
HOLD YOUR BEARS, IT'S NOT OVER


BTCUSDT dumping hard, Supports to watch!!Join our community and start your crypto journey today for:
In-depth market analysis
Accurate trade setups
Early access to trending altcoins
Life-changing profit potential
BTC has declined by approximately 7-8% in recent days after reaching $88,000. This recent pullback is attributed to a rejection at the long-term $89,000 resistance. Currently, Bitcoin has fallen to $82,000, breaching several minor support levels. The next critical support zones to monitor are $81,200 and $80,600.
Support Levels:
$82.4k
$81.2k
$80.6k
If you find this analysis helpful, please hit the like button to support my content! Share your thoughts in the comments, and feel free to request any specific chart analysis you’d like to see.
Happy Trading!!

$9.4M Bitcoin Short Squeeze and its Market ImplicationsThe volatile nature of the cryptocurrency market is a well-established fact, but the sheer scale of some trades can still send ripples across the entire ecosystem. Recently, a Bitcoin whale executed a masterful maneuver, closing a $516 million short position with a staggering 40x leverage, pocketing a cool $9.4 million profit in just eight days. This event, occurring shortly after a lower-than-expected Consumer Price Index (CPI) reading, highlights the intricate interplay between macroeconomic indicators, market sentiment, and the strategic actions of large players.
The whale's decision to close the short position immediately following the CPI release is particularly noteworthy. The lower-than-expected inflation figure signaled a potential easing of monetary inflation concerns, a development that is generally viewed favorably by Bitcoin investors. This optimistic signal likely triggered a shift in market sentiment, prompting the whale to capitalize on the impending price surge.
The use of 40x leverage amplified both the potential gains and the risks associated with the trade. While it allowed the whale to generate a substantial profit in a short period, it also exposed them to significant losses if the market had moved against their position. This high-risk, high-reward strategy is characteristic of whale activity, where large players leverage their capital and market insights to execute impactful trades.
The timing of the trade also underscores the importance of macroeconomic indicators in shaping Bitcoin's price trajectory. The CPI reading, a key measure of inflation, directly influences monetary policy decisions by central banks. Lower inflation can lead to a more dovish stance, potentially resulting in lower interest rates and increased liquidity, both of which are conducive to asset price appreciation, including Bitcoin.
Interestingly, Tuesday has emerged as Bitcoin's most volatile day in 2025.2 This heightened volatility can be attributed to the release of key economic data, including the CPI, as well as the influence of global economic trends. Market participants anticipate increased activity on Tuesdays, making it a crucial day for traders and investors to monitor market developments.
Despite the recent correction, Bitcoin's long-term outlook remains a subject of intense debate. While some analysts believe the bull run is over, citing on-chain metrics and expecting up to 12 months of bearish or sideways price action, others maintain a more optimistic perspective, predicting a potential rally to over $200,000.
The recent whale trade, coupled with the resumption of Bitcoin accumulation after three months of distribution, suggests that underlying demand for Bitcoin remains strong.3 This accumulation, particularly by long-term holders, can act as a stabilizing force, mitigating the impact of short-term price fluctuations.4
The "Bitcoin Price Prediction 2025: BTC Eyes Breakout, But Sellers Still In Control" sentiment accurately reflects the current market dynamics. While the potential for a breakout remains, the presence of significant selling pressure cannot be ignored. The interplay between bullish and bearish forces will continue to shape Bitcoin's price trajectory in the coming months.
The notion that the "Bitcoin bull cycle is over" is supported by some on-chain data, which can reveal information about investor behavior and market trends. However, interpreting on-chain metrics requires a nuanced understanding of the underlying data and its limitations. While these metrics can provide valuable insights, they should not be the sole basis for investment decisions.
Bitcoin's resilience in the face of market corrections is a testament to its growing adoption and acceptance as a mainstream asset. Despite the current correction, the cryptocurrency's ability to outperform global assets post-Trump election further reinforces its potential as a long-term investment.
The whale's $9.4 million profit is a reminder of the potential for substantial gains in the cryptocurrency market. However, it also highlights the inherent risks associated with high-leverage trading. Investors should exercise caution and conduct thorough research before engaging in such strategies.
In conclusion, the Bitcoin whale's strategic short squeeze and the subsequent market reactions underscore the complex interplay of factors influencing Bitcoin's price.
Macroeconomic indicators, market sentiment, and the actions of large players all contribute to the cryptocurrency's volatile nature.5 While the long-term outlook remains uncertain, the resumption of Bitcoin accumulation and the potential for a breakout suggest that the market is far from stagnant. Investors should remain vigilant, closely monitoring market developments and adapting their strategies accordingly. The story of the whale's successful trade is a potent reminder of the fortunes that can be made, and lost, in the dynamic world of cryptocurrency.

The current BTC chart, incorporating my 'flash-crash' thesisThis chart illustrates the current Bitcoin pattern, with my 'April flash crash thesis.'
I believe we will see another thrust lower into the green box ranges before a spring into the fifth wave. However, the fifth wave will be a "false breakout," as a flash crash in mid to late April is likely to occur, intentionally designed to sweep liquidity by liquidating overleveraged positions and triggering stop losses—driving price past the previous low set in the green box, only for the market to recover shortly thereafter and continue its breakout to the upside. This breakout will likely push beyond the pattern, taking out the all-time high, and setting a new high somewhere in the 20K to 25K range.
There could be some opportunities in the next 4 to 6 weeks, but with opportunity comes risk. Always use a proper risk management strategy suited to your skill level and wallet size.
Good luck, and always use a stop loss!

BTCUSD, Are we going to face 35% Correction ?! (Local View)BTCUSD, Are we going to face 35% Correction ?! (Local View)
Let's take a look at local movements on INDEX:BTCUSD .
Since last post Bitcoin moved in our favor, reached 38,500$.
We have a strong bounce here, which is heading towards upper 40s as long as daily close was above big red candle.
There is a probability, that Bitcoin is going to draw lower high which can be anywhere from 38.2 to 61.8 (Golden Pocket) Fib. In confluence we have several magnets at this range.
Possible stop losses around 43,500$
Fair Value Gap around 44,500$. Possible liquidations Across top 3 exchanges (Binance, OKX, Bybit) totaling around 4.0 Bln. USD. (This number covers last 30 Days Data)
Hence we should take into consideration, that huge amount of liquidity is sitting down in the previous reaccumulation zone. (Suggesting to check out Liquidity Heatmap . Putting link because I am not able to add screenshot.)
- - - - - - - - -
Next I want to mention one weird thread I bumped into on Twitter.
It’s about HTX (ex Huobi), which is owned by Justin Sun. They turned off their proof-of-reserves system, what hints about their insolvency. Onchain analysis say that they have problems with ETH holdings.
Also this is not connected to only HTX, things are being wrong with TUSD and stUSDT (Stacked USDT receipt on TRON Network).
For further details about this event please read thread from adamscochran on twitter . Hence there was around 600 Mln. USDT transfer to JustlandDao yesterday.
In the end, I want to mention, that there is no 100% accurate analysis.
We are dealing with probabilities, just with analysis we are shifting probabilities to our favor.
Best Wishes.

Bitcoin is Headed to $36K And It’s Happening NOW!This might not be the most popular opinion, especially among those who still believe the current Bitcoin bull cycle hasn’t ended. However, I encourage you to take a few minutes, approach this with an open mind, and let me know whether you agree or disagree.
Understanding the Previous Cycle (2020–2021)
The last Bitcoin bull cycle began in March 2020, when BTC bottomed at approximately $3,810. It then surged to an all-time high (ATH) of $69,870 in November 2021, marking the cycle top.
By applying a Fibonacci retracement to this entire range, we can see that the golden pocket (0.618 - 0.786 Fib)—often a key support zone during bear markets—fell between $17,700 and $28,690.
Looking at the chart, BTC beautifully retraced into this zone, even dipping slightly below it to form a cycle bottom at $15,500 in November 2022.
The key sign that the bear market had ended and a new bull market had begun was when Bitcoin broke above the 0.786 Fibonacci level of the previous cycle and established a higher high on the weekly chart. This marked a clear shift from a bearish to a bullish market structure.
The Current Cycle (2022–2025)
From the November 2022 bottom, Bitcoin rallied, setting a new ATH at $73,600—just slightly above the previous peak. After some consolidation, it found strong support at the 0.236 Fib level of the previous bull cycle, signaling that the uptrend was still intact.
The real breakout came when BTC surpassed the psychological $100,000 level and consolidated around the -0.5 Fib extension of the previous cycle. The cycle top appears to have been put in after Donald Trump took office in January 2025, marking an approximately 26-month bull run—longer than previous cycles.
However, a major bear market confirmation signal has now emerged: BTC has decisively broken below the 0.236 Fib retracement of this cycle, which historically signals the end of a bull market and the beginning of a new bear phase.
Where is the Next Bottom?
By analyzing the Fibonacci levels of both the previous and current bull cycles, we can identify key potential support zones where Bitcoin may bottom out:
1. $51,370 - $53,700
• This range aligns with:
• 0.236 Fib of the previous bull cycle
• 0.618 Fib of the most recent bull cycle
• This zone has confluence, making it a high-probability support level.
2. $35,600 - $36,500
• This range aligns with:
• 0.5 Fib of the previous bull cycle
• 0.786 Fib of the most recent bull cycle
• If BTC breaks below the first support zone, this is the next key level to watch.
Historically, Bitcoin bear markets last around one year, so we can expect this downward trend to play out over a similar timeframe.
How to Position Yourself?
For long-term investors, these support zones offer prime buying opportunities to accumulate Bitcoin at discounted prices before the next bull run begins. While the market won’t move in a straight line down—expect bounces and fake-outs—the general expectation is that BTC will find its next higher low within one of these zones.
Looking Ahead: Next Bull Cycle Target
If we use the same -0.5 Fib extension strategy that predicted the previous cycle’s top, we can estimate the next bull market peak. Based on the current cycle’s Fib range, the projected ATH for the next bull run would be around $157,000.
Final Thoughts
While nobody can predict the future with certainty, historical price action, Fibonacci levels, and market structure provide strong clues about where BTC is headed next. As always, flexibility is key—if market conditions change, so should our expectations. But if history repeats itself, these levels offer a solid framework for identifying the best entry points and positioning for the next major bull run.
What do you think? Do you agree with this analysis, or do you see it differently? Let me know in the comments!

Bitcoin: 74k-72k Line in the Sand!Hello everyone!
First of all happy international women's day to all the ladies out there! (Don't forget to get flowers guys)
Bitcoin is approaching a key area
with extremely strong support, but several indicators also mark the line in the sand for the current bullmarket for Bitcoin.
Weekly
- Fib: 38.2% of the complete trend retracement (15.5k - 109.4k)
- MA: 50 SMA (75.4k)
- S/R: 70k-74k Strong supply/resistance area
A consistent pattern emerges on Bitcoin's chart: breaks below the 50-week SMA (black line) after an all-time high (red arrows) have reliably indicated bear markets. Similarly, reclaiming the 50-week SMA (green arrows) has historically confirmed bull runs toward fresh all-time highs.
3D
- Fib: 61.8% of the retracement from previous range low to current high (49.5k - 109.4k)
- MA: 100 SMA (77k)
On the 3-day chart, the 100 SMA has acted as strong support during this bull market. Bitcoin revisited the moving average on 5 individual occasions and bounced off it. Despite briefly closing below it twice, BTC quickly reclaimed it with the following candle.
A potential correction to $70,000 is possible for Bitcoin. To maintain the bull market, it's crucial for bulls to find support there and drive the price back above the 3-day 100 SMA and the weekly 50 SMA.
Happy trading!
Pat

BTC CME GAP
- A new gap was created this weekend on the CME.
- BTC's price is higher there, which is typical.
- A gap isn’t always filled; while many do eventually close as prices retrace, it’s never guaranteed.
- This isn’t a price analysis, but rather an alert to monitor the gap.
- I’ll add my previous gap analysis in the comments.
Happy Tr4Ding

#Bitcoin at a Crossroads: Is a Reversal or Just the Beginning?BYBIT:BTCUSDT.P is once again in the spotlight! The market is at a crossroads, and Bitcoin is deciding its next move. Recent weeks have shown volatility: sharp swings, battles for key levels, and attempts to hold critical zones.
💡 Key Metrics:
✔ Current Price: $95,472
✔ ATH: $109,356
✔ RSI: 45 – no clear overbought or oversold signals yet
✔ POC (Point of Control): $95,732 – we are near a major liquidity zone
🔥 What’s happening with #BTC?
Bitcoin previously tested the $102,000 area, but sellers took control and pushed the price down. BYBIT:BTCUSDT.P is now trading at a strong support level with high liquidity, making this zone crucial for future movements.
If BYBIT:BTCUSDT.P holds above $95,700, we could see a retest of $102,500 and higher. However, a breakdown below this level could lead to a move toward $92,000 or lower.
📉 Current Situation:
➡️ BYBIT:BTCUSDT.P continues testing the key $95,732 level, which serves as the POC (Point of Control) – the area with the highest liquidity and the most concentrated orders.
➡️ The price is consolidating at the lower boundary of the strong support zone $92,700 - $95,700. This level has held multiple times, but bearish pressure is increasing.
➡️ Resistance at $102,500 - $104,000 remains a crucial barrier for recovery.
⚡ Possible Scenarios:
📉 Bearish Scenario (Breakdown Below):
🔴 If BYBIT:BTCUSDT.P breaks and holds below $92,700, further downside movement is likely:
✅ Target 1: $88,000 – a previous area of strong buyer interest.
✅ Target 2: $84,500 – a critical support zone where a strong bounce may occur.
✅ If selling pressure continues, the next major support lies around $80,000.
📈 Bullish Scenario (Reversal Upwards):
🟢 If BYBIT:BTCUSDT.P holds above $95,700 and breaks $100,000, a strong upward impulse may follow:
✅ Target 1: $104,000 – the nearest key resistance.
✅ Target 2: $110,000 - $112,000 – an area where new local highs could be formed.
✅ A breakout above $115,000 would open the way for testing $120,000.
📌 Bitcoin is currently in a high-risk zone, where any move could trigger a strong breakout.
📌 For traders: Be cautious with short positions, as the $92,700 - $95,700 zone could induce a bounce.
📌 For long-term investors: Watch the price reaction at $92,700 – if this level holds, it may be a strong accumulation point.
📌 Risk Factor: If BYBIT:BTCUSDT.P breaks and consolidates below $92,700, bearish momentum could intensify, leading to further declines towards $88,000 and below.
🚀 # BYBIT:BTCUSDT.P is at a crossroads – be ready for a big move!

BITCOINUSD TECHANICALL ANALYSIS FOR H1 (READ CAOTION)hello trader's. what do you think about bitcoinusd
current price: 105000
Today BitcoinUSD Just Touch The Last High Area 105700 We See Some Retestmint in BitcoinUSD it can be good Retest in BitcoinUSD Now we Have H1 Channel Pattern So bitcoinusd going to toching Resistance zone 106500 then bitcoinusd Fall Down side to Support 101500 then expected 97500
support 95500.94500
resistance zone. 10580o . 107000
please like comment and follow

BTC - ONLY LEVELS THAT MATTER. BLOCK OUT THE NOISE Look at these levels and memorize them. Do not get shaken out. We have not topped. If we fail to hold 90k, cut losses and try again at 85-87k. Final support to keep bullish structure is at 75k but there's an incredibly small probability of that playing out. Save this chart and keep leverage low.

Where To Buy The Blood On BTC & ALTsMartyBoots here , I have been trading for 17 years and sharing my thoughts on BTC and where to buy the BLOOD .
BTC looks weak so be careful
Do not miss out on the dip as it can be a life changing opportunity
Watch video for more details

Daily Market Review and Analysis for BTC: January 2, 2025#BTC (1h)
The cryptocurrency market capitalization rose by 2.74% over the last 24 hours, BTC dominance fell by 0.6%.
#Bitcoin continues its local uptrend, which is especially clearly visible on lower timeframes (up to 15 minutes). In particular, the price of the first cryptocurrency continues to periodically rebound from trend liquidity, which indicates that the liquidity pool will soon reach the level of $97,544 and then roll back to the area of $96,200.
This scenario will be relevant if the price consolidates with the body of the hourly candle below $95,924. But as mentioned above, now the most realistic scenario is to take the liquidity price at $97,544.
As for the global scenario, BTC is in a bullish cycle and the primary target in the medium term is the buyers' liquidity level (BSL) at $99,963, where the price is likely to fall for the sellers' liquidity (SSL) withdrawals at $90,500 and $88,722.

Bitcoin 1D Pitchfork & Correlating Tops Where To Next For $BTC Basic little draw up from now just checking market sentiment with the MACD providing great analytical insight into where we are NOW and were we were MID bull run from $75k ATH to $109k. See the bearish MACD over the ATH of 75k and the same over the 109k ATH. We are back to zero on MACD we should see small dips or sideways movement but more volatile as price is higher. It will always seem more volatile as %s of BTC price are larger. So 10% drop or gain now on $93k is $9.3k where when 1 CRYPTOCAP:BTC was 9.3k 10% drop or gain was only $930! Yes same % loss or gain but more capital required to make or loose hat 10%. Still you can always order less but this is just a sentiment driver when you look at the % math of now and back in the day even 4 years ago or pre covid.
Currently we sit at $93,250 USD at time of writing. Up from the down turn to $91k. IF we keep the market moving up growing and more $ flow in to longs and or buying bitcoin the better.
I think also as its in a DIP phase people WONT be selling who brought in at or between 50k-80k. At least I wouldn't be. Even if it goes to any price pre Covid so under 25k~ This will take a while to occur with many chances to exit before or you will see much increase from where we are now.
The market sentiment is good. Its down but its still dominant and will be for another 10 - 100 years plus. It's almost perfect and the coins doing other things BTC can mostly achieve but in directly. However it is no1 and will stay that way for some time.
Love you Holders let us know you thoughts on this projection to upward of $200k within a few 6 months ?
Not finical advice I trade on my own and use my own methods the post here isn't method to trade its just an assumption of what could happen with little degree of success. Thanks for reading!

btcIt appears to be part of a triple bottom pattern, but for me, it's important that the red box breaks first, and then the neckline is reached and broken.
