BTC Targets in 2024 & 2025As per fib tool, we can assume that BTC might hit these fib levels in this year or next year.
1.618 (102075.56)
2.618 (155599.53)
3.618 (209123.50)
Disclaimer: The information and analysis provided in this publication are for educational purposes only and should not be construed as financial advice or recommendations to buy, sell, or hold any securities. The author and TradingView are not responsible for any investment decisions made based on the content presented herein. Always consult a financial professional before making any investment decisions.
Bitcoinusdt

BTC/USDT ! HOUR DESCENDING BROADENING WEDGE LONG TARGET 105KIn this idea I have a clean descending broadening wedge that is about to take off to 105k. Target is clearly marked and should hit that no problem. If you agree throw me a like and follow me for more setups that keep you in the money. Much love - ND

$97k is the mak-or-break level for BitcoinIf Bitcoin can confirm above GETTEX:07K we are back on bull season.
If price turns around here, we could go to GETTEX:92K , FWB:83K , or $74k.

BTC / USDT: Bouncing back strong from key support BTC/USDT: Bouncing Back Strong from Key Support
Bitcoin (BTC/USDT) is showing resilience 💪 as it rebounds from a critical support level, signaling potential bullish momentum ahead 📈. This key level has previously acted as a launchpad for strong upward moves, and the current price action hints at a similar scenario unfolding 🚀.
Key insights:
1. Strong support zone: BTC has bounced off a well-established support area, reinforcing its importance as a demand zone.
2. Momentum shift: Indicators like RSI and MACD are turning upward ⚡, hinting at renewed buyer interest.
3. Volume increase: Early signs of increasing volume suggest that bulls are stepping back into the market 🔥.
Steps to confirm the uptrend:
Watch for a clear 4H or daily candle close above immediate resistance levels 📍.
Monitor trading volume; a surge in volume during upward moves strengthens the bullish case 📊.
Look for higher highs and higher lows on the charts to confirm a trend reversal 📈.
Risk management strategies:
Set a stop-loss below the support level to limit potential losses 🔒.
Scale into positions gradually as bullish confirmation develops 🎯.
Avoid overleveraging; position size should align with your overall trading plan ✅.
Important note:
This analysis is for educational purposes only and not financial advice. Always conduct your own research (DYOR) 🔍 and trade responsibly.

Bitcoin | First Line of DefenseBitcoin's first line of defense lies within the blue boxes, marking potential areas of interest. However, there are currently no significant demand zones, making it more prudent to wait for upside breakouts on lower timeframes before considering a buyer's position.
Given the uncertainty around the depth of the ongoing correction, it's wise to maintain some cash reserves to adapt to market movements effectively. Patience and careful observation will be key in navigating this phase.
I keep my charts clean and simple because I believe clarity leads to better decisions.
My approach is built on years of experience and a solid track record. I don’t claim to know it all, but I’m confident in my ability to spot high-probability setups.
My Previous Analysis
🐶 DOGEUSDT.P: Next Move
🎨 RENDERUSDT.P: Opportunity of the Month
💎 ETHUSDT.P: Where to Retrace
🟢 BNBUSDT.P: Potential Surge
📊 BTC Dominance: Reaction Zone
🌊 WAVESUSDT.P: Demand Zone Potential
🟣 UNIUSDT.P: Long-Term Trade
🔵 XRPUSDT.P: Entry Zones
🔗 LINKUSDT.P: Follow The River
📈 BTCUSDT.P: Two Key Demand Zones
🟩 POLUSDT: Bullish Momentum
🌟 PENDLEUSDT.P: Where Opportunity Meets Precision
🔥 BTCUSDT.P: Liquidation of Highly Leveraged Longs
🌊 SOLUSDT.P: SOL's Dip - Your Opportunity
🐸 1000PEPEUSDT.P: Prime Bounce Zone Unlocked
🚀 ETHUSDT.P: Set to Explode - Don't Miss This Game Changer
🤖 IQUSDT: Smart Plan
⚡️ PONDUSDT: A Trade Not Taken Is Better Than a Losing One
💼 STMXUSDT: 2 Buying Areas
🐢 TURBOUSDT: Buy Zones and Buyer Presence
🌍 ICPUSDT.P: Massive Upside Potential | Check the Trade Update For Seeing Results
🟠 IDEXUSDT: Spot Buy Area | %26 Profit if You Trade with MSB
📌 USUALUSDT: Buyers Are Active


BTC Update 2024-12-14This idea is stated optimistically and the goals are displayed on the chart.
Note : This is a personal Idea and is not enough for trading.

BTC Update 2024-12-12As Per the present movement , the targets are mentioned
Note : This is a personal idea and NOT enough for trading

BTC - 4H Support zoneBINANCE:BTCUSDT saw a strong pullback after reaching the $104K zone, hitting the support at $98K. I expect a bounce from here to target liquidity above the last ATH. Let’s see if it plays out!

100K The Countdown Begins- We are so close.
- To every Bitcoin holder who has weathered the highs and lows, celebrated the peaks, and endured the troughs—remember, you are not just an investor.
- You are a believer in a decentralized future, a pioneer of financial sovereignty, and a guardian of the idea that true value transcends borders, governments, and time itself.
- Holding Bitcoin is not merely holding an asset; it’s holding a piece of the revolution that will shape generations to come.
Keep the faith, for the future belongs to those bold enough to believe in it.
Thank you to all my followers for constantly inspiring me to share more analyses. Your support means the world—love you all!
PS : This isn’t an analysis. it's a heartfelt congratulations!
Happy Tr4Ding !

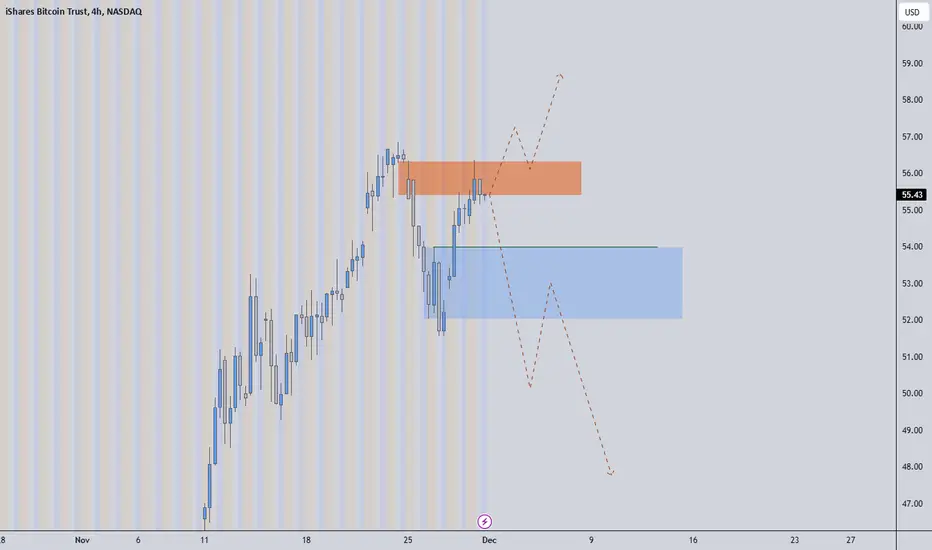
Orange Breaks, We Fly. Blue Falls, We Dive. The chart highlights two critical regions, each playing a pivotal role in determining the next trend direction for IBIT Bitcoin shares:
Orange Box - Key Resistance Zone
The orange box represents a crucial resistance area. For the rally to sustain momentum and push higher, this region must be decisively broken and secured. A close above this level, coupled with strong volume, would indicate the bulls are in control, signaling a potential continuation of the upward trend.
Blue Box - Key Support Zone
The blue box acts as a significant support level. Should the price fall below this zone, it would suggest weakness in the market. A confirmed breakdown, followed by a retest of the orange box from below, provides an opportunity to take a short position, as this would signal the onset of a downtrend.
Conclusion:
These zones are pivotal for the current market structure. Traders should closely monitor price action around these levels to identify whether the market leans towards bullish continuation or bearish reversal.
We're not going down, we're going up nowI'm 100 percent sure we'll go up. For the sake of fashion, I also placed a stop loss, but it is completely pointless at the moment.
Notice the pink bows
Good luck my friends and see you at the top
I'm not swayed by your downtrend opinion

Bitcoin Analysis: Two Key Demand Zones for Potential Bounce
Bitcoin's price action currently hovers near critical areas of demand, suggesting two zones where buyers might step in to push prices higher. These zones represent areas of significant historical interest where demand has previously outweighed supply, potentially leading to a bounce:
Demand Zone 1 - Immediate Support:
This zone lies between $93,420 - $95,000 where Bitcoin recently found support during its last pullback. It aligns with a high-demand area on the chart, characterized by a cluster of previous rejections and consolidations. Buyers may look to defend this level as it coincides with key technical confluences, such as previous swing lows and trendline support.
Demand Zone 2 - Deeper Support Level:
The second demand zone is located between $91,850 - $90,800 marking a region where significant buying pressure previously triggered strong upward momentum. This zone is reinforced by a high-volume accumulation area and aligns with a critical Fibonacci retracement level. If the price dips to this region, it may attract long-term buyers aiming to capitalize on lower prices.
Key Considerations:
Price Reaction: Monitor how Bitcoin reacts as it approaches these zones; wicks and sharp rejections could signal strong demand.
Volume Confirmation: Increasing buy-side volume near these zones will validate the strength of the demand areas.
Risk Management: A sustained break below these zones may invalidate the bullish thesis, so stop-loss placement is crucial.
These demand zones serve as key levels to watch for potential reversals, offering strategic entry points for traders looking to capitalize on a possible Bitcoin bounce
If you're looking for the most accurate and reliable insights into Bitcoin's price action, my analysis is second to none. Follow my updates for consistent, actionable strategies that outperform the market.

Is Bitcoin's Bullish Breakout a Catalyst for a 90% Rally?
Bitcoin, the world's largest cryptocurrency, has been making significant strides in recent months, with several key metrics signaling a potential for a substantial price surge. Analysts and traders are closely watching these developments, which could propel BTC to new all-time highs.
Key Metrics Pointing to a Bullish Future
A confluence of technical indicators and market sentiment suggests that Bitcoin is poised for a significant upward move. Here are some of the key factors driving the optimism:
1. Classic BTC Price Chart Metrics:
o Golden Cross: A bullish crossover of the 50-day and 200-day moving averages, often seen as a strong buy signal.
o Relative Strength Index (RSI): A momentum oscillator that indicates whether an asset is overbought or oversold. A reading above 70 suggests overbought conditions, while a reading below 30 indicates oversold conditions.1
o Moving Average Convergence Divergence (MACD): A trend-following momentum indicator that shows the relationship between two moving averages.2 A bullish crossover of the MACD line above the signal line is often interpreted as a buy signal.
2. Bitcoin ETF Options Launch: The launch of Bitcoin ETF options has generated significant interest and liquidity in the market. This development could attract institutional investors, who may view Bitcoin as a viable asset class for diversification and portfolio growth.
3. Strong Market Sentiment: Traders and analysts are increasingly bullish on Bitcoin's long-term prospects. Many believe that the cryptocurrency has the potential to reach $100,000 or even higher in the coming years.
Potential for a 90% Rally
Given the strong fundamental and technical factors, some analysts are predicting a 90% rally in Bitcoin's price. Such a move would take the cryptocurrency to unprecedented heights, surpassing its previous all-time high. However, it's important to note that the cryptocurrency market is highly volatile, and price predictions should be taken with a grain of salt.
The Road Ahead
While the future of Bitcoin is uncertain, the recent bullish signals suggest that the cryptocurrency could be on the cusp of a major bull run. However, it's essential to approach investing in cryptocurrencies with caution and to conduct thorough research before making any investment decisions.3
Disclaimer: This article is for informational purposes only and4 should not be construed as financial advice. It's crucial to consult with a qualified financial advisor before making any investment decisions.
Additional Considerations
As the cryptocurrency market continues to evolve, it's important to consider the following factors:
• Regulatory Landscape: Government regulations can significantly impact the price and adoption of cryptocurrencies.
• Market Manipulation: The cryptocurrency market is susceptible to manipulation by large investors and whales.
• Technological Advancements: Technological advancements, such as layer-2 solutions and improved scalability, can positively impact Bitcoin's performance.
• Economic Factors: Global economic conditions, such as inflation and interest rates, can influence the demand for Bitcoin.
By staying informed and understanding the risks involved, investors can navigate the volatile cryptocurrency market and potentially reap significant rewards.

Are Spot Bitcoin ETFs New Top Investment Choice for Investors?
A Six-Week Streak of Strong Investor Demand
Spot Bitcoin exchange-traded funds (ETFs) have continued their impressive performance, attracting substantial inflows over the past six weeks. The latest week saw an influx of $1.7 billion, further solidifying the growing institutional interest in Bitcoin. This consistent inflow has propelled the total net assets of spot Bitcoin ETFs to a staggering $95.4 billion, representing 5.27% of Bitcoin's current $1.8 trillion market capitalization.
Decoupling from Traditional Markets
A notable trend has emerged in recent times: Bitcoin's correlation with traditional assets like U.S. equities and Ether has weakened. This decoupling suggests that Bitcoin is increasingly viewed as an independent asset class, driven by its own unique fundamentals and market dynamics. As a result, Bitcoin's price action has become less reliant on broader market trends, allowing it to exhibit its own volatility and momentum.
Crypto Market Reaches New All-Time High
The cryptocurrency market as a whole has reached a new all-time high of $3.025 trillion, fueled by the continued adoption of Bitcoin and other digital assets. While Bitcoin has consolidated around the $92,000 level, the broader market has seen significant gains, with many altcoins experiencing substantial price increases.
Factors Driving Bitcoin ETF Inflows
Several factors are contributing to the strong demand for Bitcoin ETFs:
1. Institutional Adoption: A growing number of institutional investors, including hedge funds, pension funds, and corporations, are allocating a portion of their portfolios to Bitcoin. ETFs provide a convenient and regulated way for these institutions to gain exposure to Bitcoin.
2. Regulatory Clarity: Increasing regulatory clarity in major jurisdictions has boosted investor confidence. As governments and regulators around the world develop frameworks for cryptocurrencies, it has paved the way for institutional adoption.
3. Safe Haven Asset: Bitcoin is often viewed as a safe-haven asset, particularly during times of economic uncertainty or geopolitical tensions. Its limited supply and decentralized nature make it an attractive investment option for many investors.
4. Technological Advancements: Ongoing advancements in blockchain technology, such as scalability solutions and smart contract capabilities, are enhancing Bitcoin's utility and potential applications.
The Future of Bitcoin ETFs
The continued success of Bitcoin ETFs is likely to have a significant impact on the broader cryptocurrency market. As more ETFs launch and attract investment, it could further legitimize Bitcoin and other cryptocurrencies. Additionally, it could lead to increased price volatility and potentially higher valuations.
However, it is important to note that the cryptocurrency market is highly volatile, and prices can fluctuate rapidly. Investors should conduct thorough research and consider consulting with a financial advisor before making any investment decisions.

$BTC is VOLATILE SO DONT PANIC SELLSimple chart here showing the red trend line I placed on the chart 4 days ago or so i posted other idea of it.. left it there just updated and for different time period this time. Also lower projection. Thanks I am new to chart making so it may not be perfect,, but red line again was placed there as a "guess" market move and it kinda has :P anyway enjoy :)

BTC - TARGET REACHED | REPLAY from OCT 2023 - NOWIt is with GREAT pleasure that I say, cheers to you and all the bulls that didn't believe the ATH was in after 74k in March! Although it may seem like I've been a perma-bull, there's been short-term bearish updates throughout the year - let's walk through it and see for yourself!
I will say this, there was a moment when I thought it might happen sooner, but generally I did repeatedly say I plan for the new ATH during December. Close enough!
It is incredibly rewarding to see the entire process playout as I speculated - based off of facts and many hours of analysis and charting since 2017. It all contributed, and makes a world of a difference.
I need some time to plan the next move from here, it will take some time to observe the top out - so keep following!
________________________
BINANCE:BTCUSDT

BITCOINBitcoin analysis
Time frame of 4 hours
Due to the fact that the daily time frame of Bitcoin is bullish, you can enter into purchase transactions in the specified areas after seeing the confirmation.

Bitcoin Short Signal | 4-Hour Timeframe🟣 Entry Point: Bitcoin recently lost the key support level at $68,800 with a strong bearish candle, signaling sellers’ intent to push the price further down. This break opens an opportunity for a short position.
🟢 Technical Analysis: The $65,000 level stands as an important dynamic support. This level aligns with a trendline connecting two major lows at $49,000 and $52,500. If the price reaches this zone, buyers may temporarily halt the decline. However, if $65,000 breaks with strong selling pressure, Bitcoin may likely target lower levels, indicating a further weakening in the market structure.
🔴 Key Levels:
Entry: After breaking and consolidating below $68,800
First Target: $65,000, as a dynamic support level
Second Target: If $65,000 breaks, there is potential for a move toward lower support levels

Bitcoin Update: About to start rocketing to 100K!BTC is making a decent change of character on the daily chart and now it’s making new highs. According to my latest analysis on Bitcoin, the bullish scenario of breaking above 70K has played out and now we’re closing the price above 70K.
In the current situation, I expect a minor correction to 66K before starting the main rally for Bitcoin to higher price levels and making new all-time highs, with the major resistance target of 100K.
The correction is invalid if the price closes a daily candle above 74K, and the bullish impulse from 66K to 100K is dismissed for a while if the price breaks below 65K.
DYOR

Bitcoin Analysis==>> Last Chance for Breaking!!!Bitcoin ( BINANCE:BTCUSDT ) is still moving in the Resistance zone($70,080- $68,250) and is trying to break this zone.
Will Bitcoin break the Resistance zone($70,080- $68,250) !? Your Idea❓
Also, Bitcoin is likely to form an Ascending Channel in the 1-hour time frame , we have to wait to see if Bitcoin can form the second top or not .
According to the theory of Elliott waves , Bitcoin seems to be forming 5 more impulse waves after completing the Corrective Structure(Double Three Correction(WXY)) . Currently, Bitcoin is completing wave 3 , and wave 5 could be above the ascending channel (possible).
I expect Bitcoin to at least drop to the Support zone($68,420- $67,850) and fill the First CME Gap($68,395- $68,425) and then rise again .
🔔 Note: Bitcoin is generally in a sensitive price zone, and I think this is the last chance for Bitcoin to break the resistance zone. Tensions in the Middle East and a series of other factors that I will try to share with you in the next post (Prevent Bitcoin's increase and the formation of a new All-Time High(ATH)).
⚠️Note: If Bitcoin can break the Resistance zone($70,080-$68,250), it will increase to at least $72,000.⚠️
⚠️Note: If Bitcoin goes below the Support zone($68,420- $67,850), we should expect more dumps.⚠️
Bitcoin Analyze (BTCUSDT), 1-hour time frame⏰.
🔔Be sure to follow the updated ideas.🔔
Do not forget to put Stop loss for your positions (For every position you want to open).
Please follow your strategy and updates; this is just my Idea, and I will gladly see your ideas in this post.
Please do not forget the ✅' like '✅ button 🙏😊 & Share it with your friends; thanks, and Trade safe.

Let's be optimistic about BTC if it is closed above 59.5 KBTC testing the down side of lateral range that have formulated since March 2024. (Testing the Ice)
It will be positive if it is closed above 59500 on the daily time frame and the first target will be 62K
IN 4 HOUR Time Frame , it has broken down trend

SasanSeifi| Can We Expect Short-Term Corrections?Hey there, ✌ In the short-term timeframe, we've observed that Bitcoin has surged from the $60,000 range to a high of $69,000. However, following this peak, the price has shown a negative reaction, undergoing a minor correction down to the $67,000 levels after a brief period of fluctuations.
Currently, the price has remained in a range after encountering the Exponential Moving Average (EMA) at the $67,000 mark. The significant resistance level ahead in the 4-hour timeframe lies between $67,750 and $68,500.
Analysing the chart in the lower timeframes, it appears that the price may be inclined to experience further corrections. If a candle closes below the $66,950 to $66,850 levels, we might witness a price correction down to the demand levels at $65,500, and potentially further to $64,250 to $63,000. Understanding how the price reacts to these levels will be crucial for assessing the ongoing trend. Additionally, if the price faces increased demand and breaks above the established resistance levels, the corrective scenario could be reconsidered. The potential trend is clearly outlined in the chart above.
💢 This is just my personal analysis, not financial advice. If you found this helpful, feel free to like and comment – I'd love to hear your thoughts! Happy trading! ✌😊
