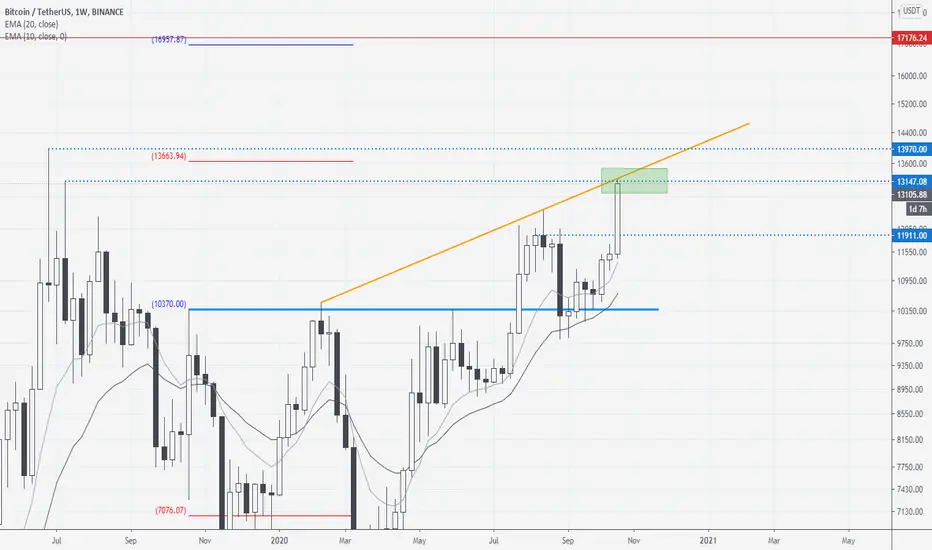
Will Bitcoin be able to breakout this strongest resistance???Hi friends hope you are well and welcome to the new update on Bitcoin. As in my previous posts, I've been sharing the different harmonic moves of Bitcoin’s price action and I've been telling you that the Bitcoin will be moved up from the potential reversal zones of these harmonic patterns. Last time I shared an expected bullish Cypher pattern with you. Because at that time the final leg of Cypher was not finalized but as all legs were driven perfectly as required for the bullish Cypher pattern, therefore, I predicted that the priceline of BTC will be moved more as per the Fibonacci sequence of Cypher and it will take another bullish divergence from the potential reversal zone of this harmonic pattern and it can hit the $10,000 resistance level.
The wedge has been broken out:
Since the first week of May 2020 the price action of Bitcoin was moving in a wedge pattern. I've also placed the volume profile indicator on the complete price action moving in this pattern that is showing very weak interest of the traders above the support. The point of control of the volume profile was also moved above the resistance of wedge. If we watch the moon phase indicator then the new full moon has appeared at high altitude at a big distance above the resistance. Therefore all these signals were in favor of breakout and finally, the priceline followed the signals and broke out the resistance of the wedge.
The price action is trying to break 10K resistance:
In the last week of June 2020, the price action bounced from the resistance of $8800. Then it started its new move within the price range from $9000 to $9500. Finally, the buying volume increased and the price action first broke out the $9500 resistance and at this time the World’s leading cryptocurrency is trying to break out the 10K resistance. This is a very strong resistance for the price action of Bitcoin as the BTC never able to break out this resistance since after this level was broken down in September 2019.
Now I would like to again recall a very big symmetrical triangle that has been formed on the weekly chart. This is the multi-years based symmetrical triangle that was started in 2017. The resistance of this triangle is very strong rejection line for the price line of BTC. If we take a look at the chart then it can be easily observed that the price action of Bitcoin is making a powerful attermpt to break out this rejection line.
A big bullish Gartley pattern:
At the end of this post, I would like to draw your attention to a very big bullish Gartley pattern. That is formed on the monthly chart by the Bitcoin. I published this pattern back in April 2020 and the price has started a powerful bullish divergence from the potential reversal zone of this Gartley move. Every candlestick is closing above the shoulder of the previous candlestick. If this bullish sequence will be continued that we can expect that soon it will lead the price action of BTC to achieve the higher than the previous highest price ever in the history of the Bitcoin.
Conclusion:
From short to long-term all indicators are bullish but this is a fact that the Bitcoin is struggling at the resistance of $10,000 and also at the resistance level of a symmetrical triangle that is the strongest rejection line in the history of the Bitcoin as well. Therefore, if the price action will be failed to break out these resistance levels then we can expect another rally to the downside at previous support of $9500.
Bitcoinusdt
BTCUSDT 4 hhi my dear traders
As you see its after 2 year that Ethereum price is going to up , after CVID19 event that every assets was falling down in few hours!
the king of crypto (BTC) could took back the prices he already deserved ! ooh I definitely I do not want to create any misunderstand, even the Growth of bitcoin will make me so happy , i believe #BTC price will climb To above of 15000$ at 2020year !
but let see this chart in the case worse at reality:
1 ) The bulls have succeeded only touch a little Shadow in 10.100.000$ thats actually nothing!
2 ) you can see the (hanging-man)(pattern) At the bearish trend line In the range 9975$ that could falling back to about 9400$ for every bitcoin as soon as possible. also bolinger indicator will shows us the prices is above very top and will probably would try to get closer to the SMA ( red middle band)
3) in other hand (RSI oscillator) shows us 86.0 number this stock is very very bought right now (in time 4H frame) and maybe take few days for complete new correction , maybe in those few days we have cahnce for new buy position. i will repeated maybe or not!
note:
second senario: if bulls can hold #BTC price above 9300$ we can still hope to will breake seriously (Resistanse 10500 ~ 10900) !
atention :
its just my openion from price chart of BTC/USDT market, so pls dont
not trade withoud any self researchs. thank you so much
#hamed_mirzaie
#bitcoin
Bitcoin Roadmap to Financial Freedom BYBIT:BTCUSD
After further analysis and zooming out a bit, this is how I see Bitcoin PA playing out for the foreseeable future on the 1W chart. Initially I thought we were following a path to a more rapid selloff, but this consolidation looks a lot like what we saw Jun 19' - Sep 19', even with the timeline almost aligning to the month.
Horizontal resistance at $9.5k has proven to be the top many times, and this time doesn't look to be any different. I see us running down to $7.1k, consolidating sideways for a bit, then breaking the $9.5k resistance sometime in September. After that, we look to break $10.6k with a run at $11.5k before breaking back down again.
We are a lot farther away from ATH's than most think and my bags are loaded for another big trip south. Ignore the noise and follow the chart, I will lead you "past go".
- PennyBag
Bitcoin tightenedWell i am not same others traders and i don't make 10 analyses on 10 coins everyday,
i try to post at the good time when things seems to be interesting.
As you can see in the chart :
1. We are reaching the end of the trendline triangle.
2. we could push again around 9950ish or down to 8650ish supported by EMA200 (red line)
3. Bollinger band showing us that we are in a tunnel and this could lead to a big move very soon.
4. i don't show all indicators, they predict bullish but i am mostly bearish right now.
that said...i really suggest you to not touch BTC in this phase.
Be patient for few days and wait until 19/20 July and look where the move will lead us.
Buy the Dip or Follow the Breakout, i repeat again what i said many time, " Sometimes the best way to win money with trading is to not trade at all".
Happy Tr4Ding and Stay Safu !
BTCUSDT LAST UPDATE... BITCOIN TO ???BTC / USDT
Update analysis
i still believe in dump in coming weeks end of July and Aug so be sure you follow risk management in your trades!!
i will be wrong if BTC closed above 9500/9800 weekly and i will admit that without ignoring, During that time we follow the market movement and trading with it.
BTCUSD Another bullish reversal Cypher pattern is fomredHi friends hope you are well and welcome to the new update on Bitcoin. Previously we have seen that the price action of leading cryptocurrency took bullish divergence from the potential reversal zone of the bullish Shark pattern. Now it has completed the final leg of the bullish Cypher. The price action has just hit the spike in the potential reversal zone however, I am expecting soon it will be completely entered again in this PRZ level.
The pattern is changed from channel to wedge:
Previously the price action was moving in a channel.
But after taking bounce from the support on 15th of June the priceline is not able to reach at the resistance. Therefore now the pattern is changed from channel to wedge.
Support and resistance levels:
At this time the price action is moving below the resistance level of $9,500. If it will be moved more down then we have the next support at $8800. In case the $8800 will be broken down then the next support would be added $8,200. And if the price action will be moved more down then the next support would be at $7500. But if the price action will breakout the $9,500 resistance level then we have very strong resistance at $10,000. At this time we can expect that if the price action will take the bullish divergence from the potential reversal zone of Cypher pattern that we have discussed earlier then it may breakout the $9,500 resistance level.
The pricline is having good supports of SMAs:
If we watch the simple moving averages with the time period of 25, 50, 100 and 200. Then price action is moving at 25 simple moving average support and having resistance of 50 simple moving average. If this support will be broken down then it can move more down up to 100 and 200 simple moving averages. However, these 100 and 200 SMAs are really very strong supports for the price action of BTC if priceline will be moved on these supports then it can be bounced from there.
Conclusion:
Even though the price action of Bitcoin has formed a bullish reversal Cypher pattern but there are chances that it will move more down to enter in the potential reversal zone of this pattern once more. But after that there will be strong possibility that the price action will move up to breakout the next resistance level. However, the potential reversal zone of Cypher can be used as stop loss. Because if this PRZ level will be broken down then the pattern can be changed from Cypher to Shark and the leg can be more longer to the downside.
If This Reversal Pattern Won’t Work Then Be Ready For Next DipHi friends hope you are well and welcome to the new update on Bitcoin. After showing little bit upward move the price action of Bitcoin started another down rally after 24th of June. In today's article we will try to understand what the price action of BTC can do next.
Formation of bullish Shark:
On 26th June I posted an article where I revealed that the price action of BTC is completing the final leg of bullish shark. This was not the first harmonic move on daily chart after forming two BATs now the price action of Bitcoin has formed other harmonic pattern. Therefore as per Fibonacci sequence of Shark I predicted that the price action may move down from $8979 up to $8809 to complete this shark. And then as per Fib sequence the price action can move up from this potential reversal zone. And finally the price action has completed the final leg as predicted and at this time it is moving above the potential reversal zone
Now if we switch to 2 day chart. Then different support and resistance levels can be noticed. And we can see that after been rejected by the strongest resistance of $10,000. The price action has broken down the $9500 support and at this time the price action is re-testing the next support level at $8800 this is the same level where we have the PRZ level of bullish Shark. In case of breaking down this support, the price action may move to the next support at $8200.
The role of SMAs:
Now if we watch the different simple moving averages with the time period of 25, 50, 100 and 200 on daily chart. Then price action had already broken down the 25 and 50 simple moving averages. Therefore a downward move up to 100 and 200 SMAs was expected. Because the 25 simple moving average was also likely to form bear cross with 50 simple moving average just above the priceline. And this bear cross can put more pressure on the price action to downside. But as the Bitcoin has also completed the bullish Shark pattern so if the potential reversal zone of this Shark will work. Then price action can be reversed from here and we may see the price action will be moved above the 25 and 50 simple moving averages. Once BTC will have the support of 25 and 50 SMAs then we can expect that the price action will find a good support above $9,500 as well.
Conclusion:
Due to the support of potential reversal zone of Shark we may see a short term or midterm bullish rally like we have witenessed short term bullish rallies after the completion of previous two BAT patterns. Once the price action will again find a firm support above $9,500 then it might make another attempt to break out the $10,000 resistance level. However if the potential reversal zone will be broken down then we can expect the price action might move down to the next support at $8200.
BTCUSD Another bullish reversal pattern is appearedHey guys and gals hope you are well and welcome to the new update on Bitcoin. As the Bitcoin is being rejected by the strong rejection line that is also the resistance of a big symmetrical triangle. Therefore in today's post we will try to understand whether the Bitcoin will drop all the way down to the support of this symmetrical triangle at $6000 or not.
A bullish reversal pattern on 12 hour chart:
As my previous article we have seen that the price action of Bitcoin is forming different harmonic patterns with the continuity. After forming to BATs now the price action is completing the final leg of another harmonic Shark. The potential reversal zone of this Shark starts from $8979 and ends up to $8809. This potential reversal zone should be set as stop loss because if it will be broken down then the price action can move to the next support at $8,200.
The support and resistance levels:
After being rejected by the 10,000 dollar resistance the price action also has broken down the $9,500 support and moving towards the next support at $8800 this is the level where we also have the maximum extent of the potential reversal zone of the bullish Shark pattern that we have discussed earlier.
SMA supports:
The price action also has broken down the 25 and 50 simple moving averages. Now we don't have any significant support of simple moving averages between 50 and 100 SMAs. Therefore it is expected that if the price action will break down $8800 price level support then it can move more down to the next available moving average support and that is SMA 100 and at the moment that is at $8,200.
Priceline is rejected by pennant resistance once more:
Price action is also moving in a pennant on the daily chart. In my previous post I was expecting that after hitting at the support price action may move up to the resistance of the pennant and might hit another spike up to $10,000. I was using the combination of three indicators for this purpose the stochastic Momentum and MACD. We can observe whenever the price action is moving at the support of this pennant then these three indicators start turning bullish the price action moves up to the resistance of this pennant. This time it happened again but after reaching at resistance finally the price action droped down at the support again. At the moment the price action is again at the support of the pennant.
The major resistance and symmetrical triangle:
The major resistance for the priceline is not only the $10,000. This is the rejection line that is also the resistance of a very big symmetrical triangle that started from 2017. And it can be easily observed whenever the priceline is reaching at this resistance it has been rejected since 2017. At this time the Bitcoin is at this resistance. The price action is struggling break this resistance out. If the price action will again reach at the support of this symmetrical triangle then and we may see $6000 level. Because that support comes at this level and we have another support of 200 simple moving average at the same level. However on the long term we have very strong signal and that is the order of the simple moving averages with the time period of 25, 50, 100 and 200. At this time we have the biggest time period moving average below all MAs. Now we need the 25 simple moving average that is the smallest time period moving average to move above all the moving averages to complete an open alligator mouth by the simple moving averages that can lead the price action to really very big parabolic bullish move.
Conclusion:
On the short term the price action may move down from $8979 up to $8800 for the completion of bullish Shark. But on the long term the Bitcoin is still expected to start a very big parabolic bullish move.
BTC Has Bounced From The Support To Breakout $10K ResistanceHi friends hope you are well and welcome to the new update on Bitcoin. Previously I was looking at two patterns for the bullish reversal of BTC. Now the price action is likely to be reversed bullish from the support of these patterns. Let's have the brief analysis on the price action of BTC what it can do next.
1st bullish reversal pattern hamonic BAT move:
on 8th June when the price action was moving around at $10,000. I predicted that BTC is likely to complete the final leg of Gartley pattern, therefore a drop is expected. Below was the post:
And finally the price action dropped in the potential reversal zone of this pattern. But this was in fact a BAT pattern rather than Gartley therefore in my very next post I cleared and mentioned that as per BAT move this drop can be from $9000 upto $8800. And the priceline dropped upto $8,900.
The BAT move:
Now after hitting the spike in the potential reversal zone of this BAT pattern the price action is likely to take a bullish divergence from here.
2nd signal bounce form the support of pennant:
The price action of leading cryptocurrency was also moving in a pennant. Up till yesterday it was moving sideways at the support of this pennant. And this was the second signal I was waiting that the price action may take bounce from the support level of this pennant. For this purpose I used the combination of three indicators the momentum and MACD and stochastic. As in my previous post I also mentioned that when these three indicators will be turned bullish we can expect an upward move upto the resistance of the pennant. At this time the resistance is at $9950 therefore we can expect a spike upto $10K. However if the bank volume will be powerful then the price action can also break out the resistance.
The priceline just broke down the support of $9500 and it was re*testing previous support as resistance. Now at this time is strong bullish candlestick is trying hard to breakout this resistance and it seems to be that in next candlestick the resistance will be broken out. I've also placed the moon phase indicator on this support and resistance chart. It can be observed that the new full foon is appeared little bit down as compared to the previous full moon. But it is still above the resistance of $10,000 therefore it is another indication that the price action of BTC can try to reach upto this moon level.
An expected attempt to re-enter in channel:
Now let's take a look at the up channel that was formed on the daily chart. The price action had broken down the support of this up channel on 15th June. After breaking down the support the price action was moving sideways on the 50 simple moving average support. And it seems to be that this support has worked well and now the price line may try to re-enter in the channel. But for this purpose price action will face a strong resistance by the previous support of the channel that is working now as resistance and that is at $10,000. We can also watch that the 100 simple moving average is very close to cross up the 200 simple moving average below the priceline of BTC. That is also another bullish signal that can help the price action to enter in the channel again.
Conclusion:
All chart patterns and indicators are turned bullish on the daily chart. And the price action has also found very firm support therefore an upward move upto $10,000 levels is almost confirmed.
These Two Signals Should Be Observed For Bullish ReversalHey firned hope you are well and welcome to the new update on Bitcoin. After breaking down the up channel the Bitcoin is still moving sideways and little bit down therefore in today’s article we will try to understand what the price action can do next.
The BAT pattern is still in play:
1st of all I want to show you this BAT pattern that the priceline of the leading cryptcurrency has formed on the daily chart. And the price in just hit the spike within the potential reversal zone and completed the final leg of bullish BAT. Now price action is moved up again and at this time it is moving sideways. I am expecting it will again enter in the PRZ level, therefore I suggest to set this potential reversal zone as stop loss. Because if the potential reversal zone will be broken down then price action can move more down for the formation of Crab pattern.
Retesting of support as resistance likely to be failed:
now if we watch different support and resistance levels on daily chart. Then as in my previous post I mentioned that after breaking down $9500 support the price action was retesting the previous resistance as a support. Now this re-testing is likely to be failed and priceline of BTC moving slightly down and it can move to the next support at $8800. And if this $8800 will be broken down then next support will be ready $200 is also very significance afford a because it has been working sometimes a support is at $8200. Now if we see the moon phases indicator then recent dark moon was appeared near $8800 support. This is giving indication that the price action can move down to this level. And so far the price action has spiked to $8900 that was very close to this dark moon. The new moon appears after a complete synodic cycle that is 29.5 days long. And this dark moon was appeared on 3rd Jun 2020 therefore the life of this recent dark moon is 19 days. It means there are almost 10 days left for the appearance of new moon. So in the meanwhile we can use some other indicators to predict the upcoming trend.
Down channel on short term chart:
On the hourly chart the price action has formed a down channel. At this time the resistance of the channel is at $9350 and the support of the channel is at $9150. It is very important for the priceline to break out this channel as soon as possible otherwise if the price action will be continuously moving down within this down channel then the resistance will be moved more down. For example if we use the pitchfork tool to watch the long projection of the price action then on the chart in can be clearly seen on 28th of June the resistance will be moved down to $9,000.
Last hope the pennant support:
On daily chart the price action of Bitcoin has formed a pennant and at this time the price action is at the support of the pennant. I've also placed the exponential moving averages with the time period of 10 and 21. The price action is moving between these exponential moving averages and the support. If the price action will not break down this support of pennant then it can move up to resistance of pennant that is at $10,000 the movement.
Conclusion:
At this time the bullish BAT pattern and pennant both have very important role. And if we want to see the bullish reversal by the price action of Bitcoin then we should observe these two patterns very closely.
Bitcoin is likely to be rejectedHello friends hope you are doing well and welcome to the new update on Bitcoin. Today we will have the Bitcoin analysis on short term, the midterm and on the long term as well. And we will watch different chart patterns that BTC has formed and the support and resistance levels and also the different moving averages.
The formation of harmonic BAT:
In my previous posts I told you that the price action is completing the final leg of bullish Gartley and 1st I predictred that the price action will be dropped from $9300 to $9000. Then in next article I shared that price action may behave like BAT pattern rather to behave like Gartley. And as per Fibonacci sequence of bullish BAT I predicted that it can drop from $9,000 to $8800. And finally the pricline of BTC dropped up to $8900 and completed the final leg of bullish BAT. Now at this time this potential reversal zone has become very strong support for the price action of leading cryptocurrency.
Support and resistance level:
Now I would like to show you different support and resistance levels on daily chart. At this time the price action has $8800 as support. This is the same level where we have the potential reversal zone of bullish BAT pattern.The next resistance level at $9500 and after $9500 the next resistance level is $10,000. Few days back $9500 was working as support but at this time after breaking down this support the Bitcoin is retesting this level as resistance. And if the price action will be not able to break out this resistance again then it will be again dropped previous support level that is at $8800.
Formation of down channel on short term chart:
Now the Bitcoin is moving between $9300 to $9500. And if we switch to the short term 1 hour chart then it can be easily observed that the protection is moving very well within a down channel. The support of this channel is at $9300 and resistance is at $9500. And this is a little bit down channel therefore if the price action will not breakout this resistance soon. Then this resistance will be moved more down.
Up channel on daily chart has been clearly broken down:
Now let's move to the daily chart and here the Bitocoin has formed an up channel after mid of March 2020. And we received a very clear signal by the moon phases indicator that the priceline may break down the support because the new dark moon was appeared at distance from the support. And in order to reach at this level of dark moon the priceline needs to break down the support of this channel. And finally the priceline broke down the support. And now we have 5th candlestick closing below the channel.
Bitcoin and other markets:
If we compare the price action of Bitcoin to other markets for example this if we take an example of S&P 500 that is most outperforming index. We can notice that Bitcoin was more stronger than the other market. Like there the price of Bitcoin broke out all the simple moving averages with the time period of 25, 50, 100 and 200 on 30th April but on the other side the priceline of SPX broke out all these simple moving average on 29th of May 2020 there is a difference of a complete month. And now S&P 500 has bounced from 25 simple moving average. But the Bitcoin has broken down the 25 simple moving average and now it is at the support of 50 simple moving average. Therefore there will be chances that the pricleline will breakout the 25 SMA again. Because pressure from the downside is more than the pressure from the upside because the simple 25 is smaller than 50 simple moving average. And there is some correlation between Bitcoin and other markets. If the BTC will follow stocks and indexes then definitely it will again breakout 25 simple moving average.
The pennant is still there:
The BTC has also formed a pennant on daily chart. In order to see whether this the Bitcoin will be dropped or not. We should observe very closely that the price action will break down the support of this pennant or not. I observed that the priceline of BTC is very much synchronized with the combination of three indicators: stochastic, MACD and momentum. For example whenever the price action reaches at the support then stochastic gives bull cross and MACD also starts turning bullish and momentum changes from bears to bull then Bitcoin reaches at the resistance. At this time the price action is at the support and stochastic has also given the bull cross and MACD is turning bullish but momentum did not give any bullish signals, therefore we need to wait for the momentum for the final confirmation whether price action will break down the support or not. But it from here to stochastic will again give bear cross and MACD will turn strong bearish then priceline can break down the pennant.
Very big symmetrical triangle:
Now let's talk about big symmetrical triangle that has been formed on the long-term weekly chart by the price action of Bitcoin that we discussed earlier at the starting of this post. And the resistance of this symmetrical triangle has become very strong rejection line for the Bitcoin. Whenever the price action hits at this resistance level then it is being rejected again and again and this time after hitting resistance level the price action is again likely to be rejected. If the Bitcoin will move all the way down up to the support of this triangle then we may see $6,000 level.
BTCUSD is retesting previous support as resistanceHello friends hope you are well and welcome to the new update on Bitcoin. As yesterday I told you in my previous video that the Bitcoin is completing the final leg of bullish BAT pattern and it can enter in the potential reversal zone that starts from the $9,015 $8840. Now the price action has completed the final legs and entered in PRZ level. Now let's have a look at the price action of the BTC to have more analysis to understand what the price action can do next.
Bullish BAT has been completed:
As in my previous post I told you that on daily chart the price action is forming harmonic moves with consistency and continuity. This time the price action was forming the final leg of bullish BAT. The potential reversal zone of this bullish BAt starts from $9,015 up to $8840. And finally the price action reached up to $8,900 and completed this final leg. Now there are chances that the price action will start an upward move from here.
www.tradingview.com
Price action is retesting the previous resistance:
After being rejected by the $10,000 resistance level the priceline of the leading cryptocurrency has broken down the $9500 strong support. Now at this time the price action is re-testing the previous support as resistance. If the price action will be able to break out this resistance again then it will reach the $10,000 to make another attempt to breakout this level otherwise the price action may reach upto $8800 support level.
25 SMA and channel support has been broken down:
The price action of Bitcoin was moving within an up channe since after mid of March 2020. This Channel was the basic market structure for Bitcoin on short term and mid term. The priceline of BTC was also above 25, 50, 100 and 200 simple moving average. But as the moon phase indicator was giving bearish signal because the new dark moon was appeared below the support at distance. Therefore the price action followed this bearish signal and broke down the channel’s support and the 25 simple moving average support as well. At this time the price action is retesting the previous support of 25 SMA and channel support as resistance. If the price action will not able to break out these previous supports as resistance we may see another drop.
Price action is struggling at the support of pennant:
on daily chart after formation of rising wedge pattern the price action also formed another pennant. As in previous posts I predict that the rising wedge will not be broken down and the price action will break out the resistance. The basic reason for this prediction was that the RSI was completely in uptrend. Whenever the RSI moves in up or downtrend the price action follows this trend. During the movement in current pennant the price action was in uptrend but the RSI was in downtrend. Therefore finally the priceline of BTC followed the signals of RSI and tried to break down the support of this pennant. However, that support is not broken down so far. At this time the price action is struggling at the support of this pennant and the Stochastic has also given bull cross signal as well. But the volume is not as that much strong as required for the breakout from the resistance of the pennant. And if we see the volume oscillator then it is also in negative territory that is clear signal that the bull are weak at this time.
Conclusion:
At this time the priceline of Bitcoin is going through a make or break situation. The BTC needs to re-enter in the channel as soon as possible otherwise we may watch another bearish rally.
BTCUSD going for the formation of BAT be ready for more drop1st of all I would like to show you the below chart that I posted on 8th of June. Where I predicted that the price action is going to move more down to complete the final leg of Gartley pattern. And that move was expected from $9317 up to $9015. And so far the price action has been retraced and completed the leg of Gartley.
The Bitcoin is going for BAT formation:
Now there is more possibility that the price action will go for the Bat pattern. Because the signals are turning more bearish. Therefore I'm just ignoring some extra spike and taking the A to B leg up to 0.50 Fib retracement level. Now as per Fiboancci sequence of BAT the final leg is expected to be retraced from $9,015 upto $8840. This is the potential reversal zone of this BAT pattern.
But we should use this potential reversal zone strictly as stop laws point. Because once it will be broken down then the price action may go for the formation of bullish Butterfly pattern and that can go upto $75. If I will see more strong bullish signals I will definitely post that pattern as well.
Different support and resistance level:
Now if we watch the different support and resistance levels then the price action recently was trying to breakout the $10,000 resistance level. And this 10K level is a very strong resistance as it is not broken out since October 2019. Now after being rejected from this resistance level the price action also has broken down the previous support of $ $9,500 and now we have the next support at $8,800 and the price action is going to retest that support as well.
Up channel, moon phases and SMAs:
Since after the mid of March 2020 the price action started the formation of an up channel and it was moving in this channel very well. And while moving within this pattern the price action broke out the simple moving averages with the time period of 25, 50, 100 and 200. At this time the price action has almost broken down the 25 simple moving average and now it is retesting the 50 simple moving average support and the channel support is almost broken down as well. I've also placed the moon phases indicator on this chart. That is showing that the altitude of new full moon was not so high and it was appeared at the resistance of the channel. While the dark moon appeared below the support of this channel and there was a big distance between the support and the new dark moon. Therefore there was a possibility that the price action may reach up to this dark moon and in order to reach at this level the price action needs to break down the support of the channel and the price line has done it.
The support of pennant is likely to break down soon:
On daily chart after the formation of rising wedge pattern recently the price action formed a bullish pennant. While moving within previous rising wedge pattern we received clear signals for the breakout. For example, the RSI was completely in uptrend that was a major bullish signal and the stochastic also gave the bull cross from the oversold zone. While moving within current bullish pennant the price RSI was completely in downtrend. And whenever the price action moves in opposite direction of the trend of RSI eventually it follows the direction of the trend of RSI. And now the price action is following this rule.
A big symmetrical triangle and SMAs supports:
Now if we switch to the long term weekly chart. Then the price action has formed a very big multi years based symmetrical triangle since 2017. And the resistance of this triangle has become a very strong rejection line for the price action of the leading cryptocurrency. This time the price line of BTC was struggling to break out this rejection line but unfortunately it is failed to have break out this time and after being rejected it is moving down. Now if we watch the simple moving averages supports on this weekly chart then we have the 50 simple moving average immediate support that is almost at $8,800 then we have the 25 simple moving every support than 100 and at last we have 200 simple moving average support at $6,000 that is at the same level that we have the support of this big symmetrical triangle.
Conclusion:
On short and midterm chart all signals are turning bearish and the move between $9,000 to $8800 as Fibonacci sequence of bullish BAT pattern is confirmed. The further downward move depends on the breakdown of potential reversal zone of BAT pattern and 50 simple moving average of weekly chart that is at $8800.
11 June Btc Usdt Dump review.It has created the third new trend line since 12 March. it was able to throw itself on Sma 200 again. Now is it fourth? The period is the same since 9-10 May. Each landing starts and ends at the previous one. It can be realized as the month of July from the fourth trend line. It is my personal amateur work and does not qualify as investment advice. Good luck.
BTC Murphy Law 'SHORTS Analyse'Everything that goes up must come down - Murphy Law
Like you can see in the graph SHORTS on Bitfinex are very low, and from the past you can check that most of the time when SHORTS hit this area...they are going up and BTC is going Down...
i would be happy for BTC if the story not repeats again but i care more wisely invests than be sinked in a BearTrap.
Most of the time in past years i always detected Pumps if you check my others analyses, but today i predict more a dump. if you are a scalper you can still scalp market and use your stop loss,
no matter for you if BTC up or down, but if you are a long wave investor and want cumulate more BTC, i suggest you to wait and be very cautious.
Like i said before sometimes the best way to win money is to not trade at all and wait.
So if this story happens we have 2 crucial points where we can buy BTC.
8000-7500 BTC is supported by Weekly Pivot and EMA50-EMA100 Days.
6000 would be a safety buy zone for me as BTC is supported by EMA200 Days.
BTC can also go dipper but i don't see it going under 5000$ (Trend Triangle Support).
i will add a picture with the normal chart to make everyone understand about Supports Zones.
Happy Tr4Ding!
Be Ready For Possible Drop | Bitcoin Is Completing The GartleyHi friends hope you are well and welcome to the new update on Bitcoin. On 1st June 2020 the BTC has spiked up to $10429 as per Bitstamp exchange and tried to breakout the $10,000 resistance level even on the 2nd June the price action spike beyond $10K but could not break out this resistance. Since then the priceline is moving above the $9500 support level. Every day the priceline is hitting at $9500 support level but so far this this support is not broken down. If it is support will be broken down then we may see the next bearish rally up to $8800 that is BTCs previous support.
Up channel and Bollinger bands resistance:
On the daily chart the Bitcoin is moving in an up channel and it was expected that this time the priceline will reach up to the resistance of this channel as it had already visited the support on 25th May 2020. But before reaching the resistance the priceline of leading cryptocurrency dropped down. At this time the price action is moving above the 25 simple moving average. The basic reason that stopped the priceline to reach up to the resistance of the channel was bollinger bands. Because the upper bands of the bollinger bands is below the resistance that is a big hurdle for the price action to move up. And the lower bands of the bollinger band is at the level where the 50 moving average is also moving and that is around $8800 therefore there is possibility that the price action will reach upto this level.
Pennant and EMAs:
On the same daily chart the price action of Bitcoin is also moving in a pennant and after hitting the resistance of pennant the pricline is moved down. I've also placed the exponential moving averages with the time period of 10 and 21. At this time the priceline is retesting these moving averages as support as the exponential moving averages 10 and 21 have been working as strong support for the price action of the leading cryptocurrency since the bullish rally was started after the mid of March 2020. But if the price action will break down these moving averages and the EMA 10 will cross down the EMA 21 then we may see strong downside rally.
Continuously formation of harmonic moves:
The price action of leading cryptocurrency is also forming the different harmonic patterns with the continuity and consistency on the daily chart. The BTC formed a bullish BAT pttern and took a powerful bullish divergence from the potential reversal zone of this pattern. And while moving up the price action started the formation of another harmonic Gartley pattern. It can be easily noticed that at this time the priceline has started the formation of the final bearish leg. The potential reversal zone of this pattern starts from $9317 to $9015. Therefore it can be expected that once the price action will be entered in this PRZ level then it can move up with bullish rally.
Conclusion:
For the completion of the harmonic pattern the price action may drop from $9300 to $9000 or it may also hit the spike up to the simple moving average with the time period of 50 on the daily chart and that is at $8800. However after the completion of the final leg of this bullish pattern we may see another bullish move buy the Bitcoin soon.
Note: This idea is education purpose only and not intended to be investment advice, please seek a duly licensed professional and do you own research before any investment.