BTC / USDT near to breakout from trendline resistanceBTC is testing its trendline resistance after a steady buildup. A successful breakout could trigger a strong move toward the $122,000–$125,000 range. Worth watching closely in the coming sessions.
Bitcon
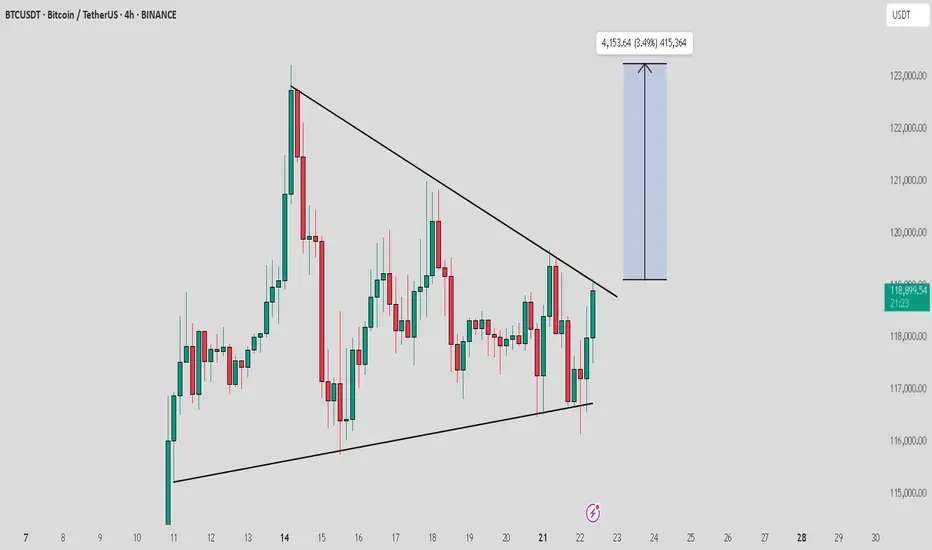
Strategy: “Breakout Bounce” – Buy the Retest, Ride the WaveHello Traders! BTC has broken out above $118K–$120K after a strong uptrend. Now it’s pausing, and a short-term pullback looks likely. Instead of buying the top, we wait for the price to retest previous resistance (around $112K–$114K), which could turn into support.
MY PLAN:
Wait for pullback to $112K–$114K zone.
Look for a bullish candle (daily or 4H) to confirm entry.
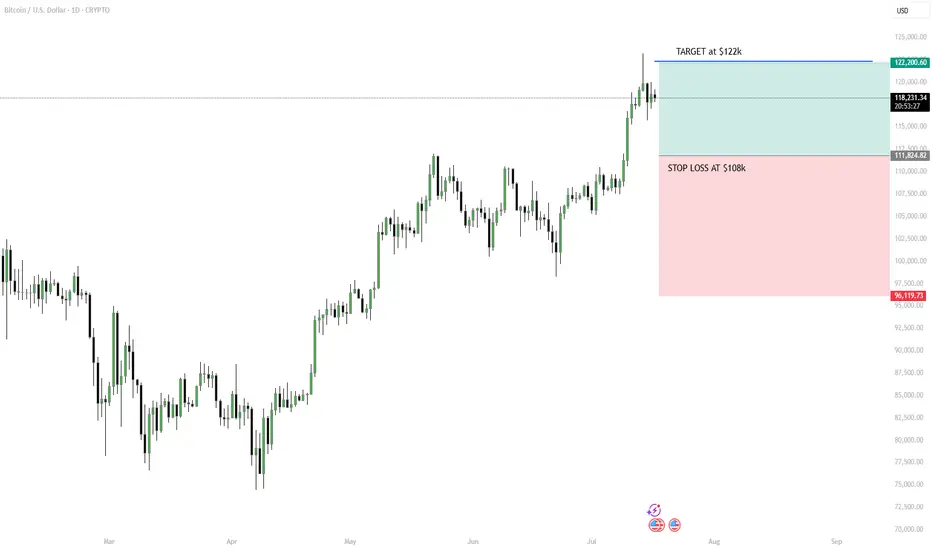
Target: $122K short-term or trail stop if trend continues.
Stop loss: Below $108K to manage risk.
Tip: Don’t chase. Be patient, follow the setup, and use proper risk management.
Please leave a comment and don't forget to support a fellow trader! Also, you can leave in the comments your target and plan ideas!
Have a great day y'all!
-Neo
Bitcoin : Stay heavy on positionsApril was the scale-in zone:
Back in April, the US stock market flashed a split-entry buy signal—a classic zone for gradual accumulation.
That same setup applied to Bitcoin. Buying the fear worked again.
We’ve moved out of the fear zone:
Both Bitcoin and equities have left the extreme fear territory behind. Sentiment has shifted.
Short-term overbought now:
Bitcoin is currently in a short-term overbought phase. Some consolidation or cooling off is natural here, but no major trend reversal signs yet.
Stay heavy on positions:
I’m maintaining an overweight position in Bitcoin as long as the US stock market stays intact. The Nasdaq is holding up, so Bitcoin likely stays in risk-on mode.
Warning:
If US equities take a hit, expect Bitcoin to follow.
Negative moves in the stock market will likely translate directly into crypto weakness.

AVAX/USDT - H4 - Wedge Breakout (29.06.2025)The AVAX/USDT pair on the H4 timeframe presents a Potential Buying Opportunity due to a recent Formation of a Wedge Breakout Pattern. This suggests a shift in momentum towards the upside and a higher likelihood of further advances in the coming Days.
Possible Long Trade:
Entry: Consider Entering A Long Position around Trendline Of The Pattern.
Target Levels:
1st Resistance – 21.77
2nd Resistance – 24.35
🎁 Please hit the like button and
🎁 Leave a comment to support for My Post !
Your likes and comments are incredibly motivating and will encourage me to share more analysis with you.
Best Regards, KABHI_TA_TRADING
Thank you.

Bitcoin Breakout Fueled by Hidden Demand ZonesBTC just exploded out of consolidation — but the clues were all there. Price tapped the same demand zone three separate times, each time forming a higher low and respecting a clean rising trendline.
The final push broke through prior supply, flipping it into support and kicking off the breakout leg. These demand zones acted as hidden fuel for the move, offering clear entries for traders tracking structure.
📊 Demand respected at ~$104K, ~$107K, and ~$111K
📈 Breakout confirms rising structure and trendline strength
🧠 Key lesson: Strong moves are often born from clean structure, not noise
#BTCUSD #BitcoinBreakout #SmartMoneyMoves #PriceAction #TradingView #QuantTradingPro

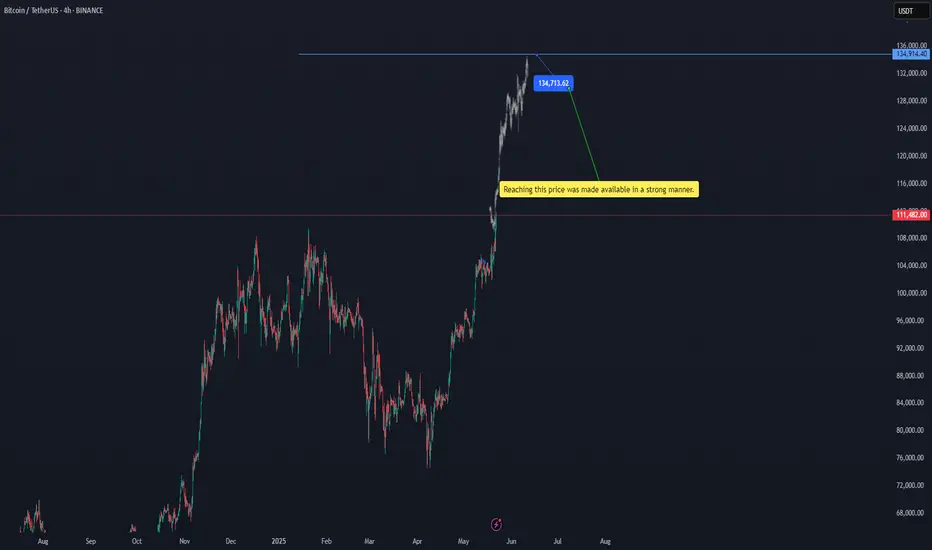
btcusdtReaching this price was made available in a strong manner. 134713.16$ BINANCE:BTCUSDT
Of course, there is a possibility of a temporary correction at the current price, but the target is $134,713.
#btc
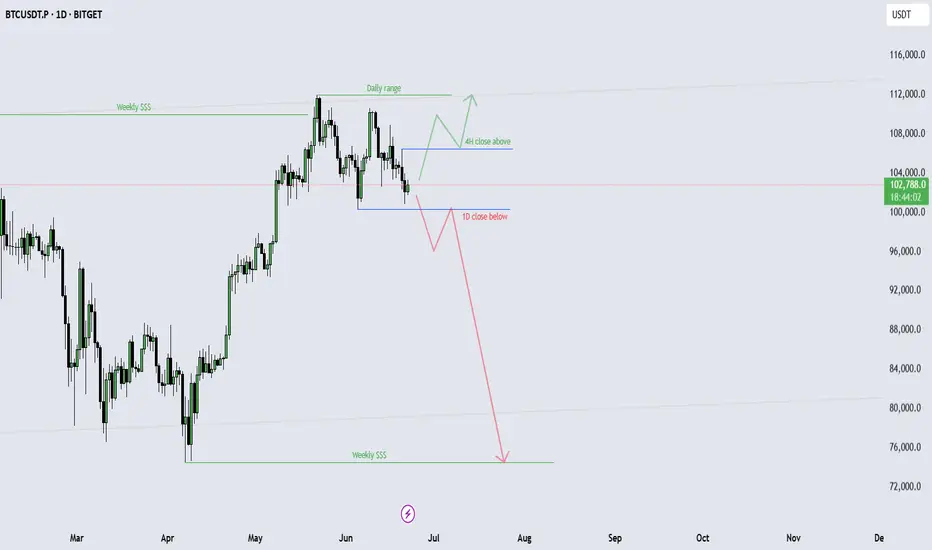
BTCUSDTBitcoin may be looking to complete the downward correction from the $101,000 price range to $99,000 and then begin a long-term upward trend. Pay close attention to the extent of the correction and don't give in to fear or greed.
In any case, it should go to $1300,000.
BINANCE:BTCUSDT

BTCUSDTHello Traders! 👋
What are your thoughts on BITCOIN?
Bitcoin has once again failed to break above its previous high and entered a corrective phase. The price is now moving within a channel and is approaching the lower boundary of that channel.
The correction is expected to continue toward the support zone and the bottom of the channel, where we may see buying interest and a bullish reaction.
If Bitcoin breaks above the channel resistance and key supply zone, it could trigger a strong upward move and lead to new all-time highs.
Key Note:
Price action near the channel support and demand zone will be crucial. A successful rebound from this area may signal the start of the next bullish leg.
Will Bitcoin hold the channel and bounce higher, or is a deeper correction ahead? Share your thoughts below! 🤔👇
Don’t forget to like and share your thoughts in the comments! ❤️

BTC / ETH / SOL / XRP / HYPE: Potential Trend StructuresIn this video, I share my current daily and weekly analysis on the trend structures of BTC, ETH, SOL, XRP, and HYPE, highlighting key support and resistance zones to watch in the coming sessions.
Charts featured in the video:
BTC
ETH
SOL
XRP
HYPE
Thank you for your attention and I wish you successful trading decisions!
If you’d like to hear my take on any other coin you’re tracking feel free to ask in the comments (just don’t forget to boost the idea first 😉).

BTCUSD · 3D — Bearish Divergence + Volume Drop Suggest Pullback
🧠 Setup Overview
Bitcoin is showing signs of exhaustion after a parabolic rally:
Bearish divergence is visible on the 3D RSI — price made higher highs while RSI made lower highs.
Volume is shrinking with each push up, suggesting buyer momentum is fading.
Price is pressing into all-time highs without conviction, signaling potential for a pullback.
🔻 Downside Targets
Target 🎯 Level Why It Matters
Target 1 $92,300 (50% Fib) Midpoint of last impulse + first strong demand area.
Target 2 $82,500 (61.8% Fib) Volume-profile support + key confluence zone.
🔎 What Confirms the Setup?
Breakdown below $108K structure
Daily close below $105K with increasing volume
RSI losing midline support = momentum shift confirmed
❌ Invalidation
Daily close > $112K with strong volume = idea invalid
Would suggest continuation toward blue-sky breakout
✅ Summary
Bearish divergence + volume drop = classic topping signals
Risk is well-defined, with Fib-backed targets offering clean R:R
Trade cautiously — momentum is fading, not gone yet
📛 Disclaimer: This is not financial advice. Do your own research and manage risk according to your plan.
#Bitcoin #BTC #CryptoAnalysis #BearishDivergence #RSI #VolumeProfile #Fibonacci #TradingView

BTCUSD · 3D — Bearish Divergence + Volume Drop Suggest Pullback
🧠 Setup Overview
Bitcoin is showing signs of exhaustion after a parabolic rally:
Bearish divergence is visible on the 3D RSI — price made higher highs while RSI made lower highs.
Volume is shrinking with each push up, suggesting buyer momentum is fading.
Price is pressing into all-time highs without conviction, signaling potential for a pullback.
🔻 Downside Targets
Target 🎯 Level Why It Matters
Target 1 $93,300 (50% Fib) Midpoint of last impulse + first strong demand area.
Target 2 $82,500 (61.8% Fib) Volume-profile support + key confluence zone.
🔎 What Confirms the Setup?
Breakdown below $108K structure
Daily close below $105K with increasing volume
RSI losing midline support = momentum shift confirmed
❌ Invalidation
Daily close > $112K with strong volume = idea invalid
Would suggest continuation toward blue-sky breakout
✅ Summary
Bearish divergence + volume drop = classic topping signals
Risk is well-defined, with Fib-backed targets offering clean R:R
Trade cautiously — momentum is fading, not gone yet
📛 Disclaimer: This is not financial advice. Do your own research and manage risk according to your plan.
#Bitcoin #BTC #CryptoAnalysis #BearishDivergence #RSI #VolumeProfile #Fibonacci #TradingView

Bitcoin's 4-year bullish cycle is coming to an end.The price reversal and manipulation zone could be between $120K and $133K, indicating a big bearish movement.
Quarterly analysis indicates a target of approximately $24,750.
QT + ICT + SMC
- Sainty

BTCUSDTHello Traders! 👋
What are your thoughts on BITCOIN?
In our previous outlook, we anticipated a pullback to the channel bottom followed by a bullish move, and so far, price has followed that scenario perfectly.
Bitcoin is now approaching the channel top and a major resistance zone. At this point, we are watching two potential scenarios:
Scenario 1 – Pullback Before Continuation:
If price rejects the resistance, a correction toward the midline of the channel (which aligns with a key support level) may occur. This could offer a strong entry point for the next bullish wave.
Scenario 2 – Breakout and Retest:
If Bitcoin breaks above the channel and resistance zone, we can look for buy opportunities on the pullback to the broken level, with potential targets at higher levels.
Price action in this area is crucial. Both a midline pullback and a resistance breakout could provide valuable trading setups.
Is Bitcoin gearing up for a breakout, or is another correction coming first? Share your view below! 🤔👇
Don’t forget to like and share your thoughts in the comments! ❤️

BTCUSDT: buy or sell plans for near futureBTCUSDT: buy or sell plans for near future. Very easy and clear setups are shown. Pay attention to the timeframes that I have indicated. You can either buy or sell immediately after close, or wait for pullback to gain more.
Cheers
₿itcoin: Continuing B WaveBitcoin has recently reclaimed the key $106,000 level. Under our primary scenario, we anticipate continued increases into the blue Target Zone between $117,553 and $130,891 – where green wave B is expected to conclude. From that corrective peak, we project a significant move lower in wave C, which should ultimately pull prices into the lower blue Target Zone between $62,395 and $51,323. This range is expected to mark the completion of orange wave a. We then foresee a brief corrective rally before wave (ii) completes its broader correction with a final sell-off.
📈 Over 190 precise analyses, clear entry points, and defined Target Zones - that's what we do.

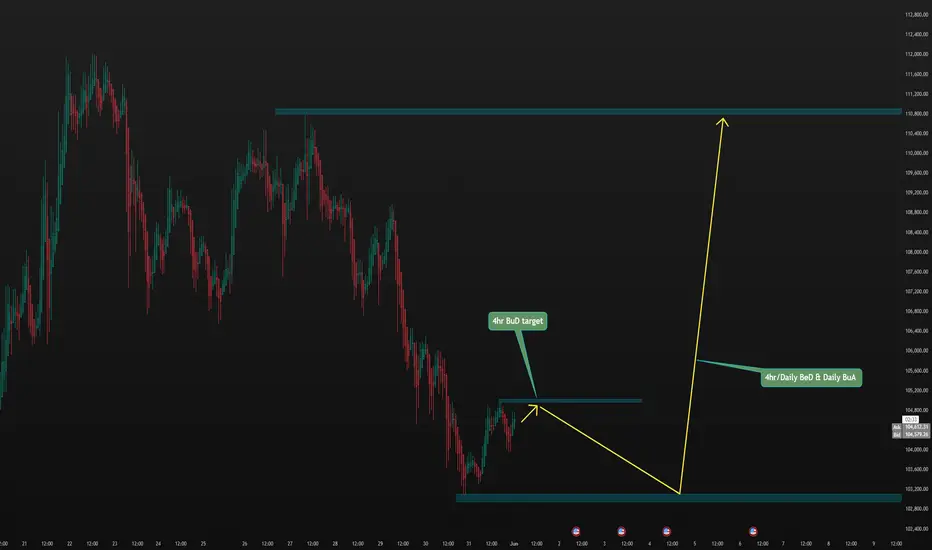
BTC/USD 4H Trade Setup – Demand Zone Reversal Play🔵 1. Demand Zone 🧲💎
📍 Range: 100,418.83 – 102,253.51
🟦 Strong support zone
💡 This is where buyers are expected to step in
📉 Price is currently testing this zone — potential reversal area
🚀 2. Entry Point 🎯
📍 Zone: 102,232.52 – 102,264.33
✅ Just above demand zone for safe entry
🧘♂️ Wait for bullish confirmation (wick rejections, engulfing candles)
🛑 3. Stop Loss 🔻
📍 Zone: 100,498.77 – 100,538.74
🔒 Below demand zone — protects you from false breakouts
⛔ Invalidates setup if price breaks below this level
🎯 4. Target Point 💰
📍 Target: 108,800.00
🧱 Major resistance zone
📈 Offers a solid Risk/Reward setup (approx. 1:4)
🪜 Possible take-profit scaling around 108,656.78 – 109,256.50
🔁 5. CHoCH – Change of Character 🔄
📍 Confirmed structural break above a lower high
🕵️♂️ Indicates shift from bearish to bullish
🔁 Needs confirmation with higher low near demand zone
📏 6. EMA 70 (Exponential Moving Average) 📉
📍 Level: 106,849.30
🔴 Price is currently below EMA = short-term bearish
🧗♂️ Reclaiming the EMA will strengthen the bullish bias
✅ Quick Summary with Emojis
📌 Plan:
🔵 Buy near: 102,250
🛑 Stop Loss: 100,500
🎯 Take Profit: 108,800
📊 Trend:
🔻 Bearish short-term (below EMA)
🔁 Potential reversal from demand zone
⚠️ Watch For:
🔍 Bullish confirmation at demand zone
🔄 Reclaim of EMA (106.8k)
🧱 Resistance near 108.8k

$BTC - Top Down BYBIT:BTCUSDT.P Top Down (10/06/25)
V-Levels Bias
Weekly = Bullish
Daily = Bullish
10-Hour = Bullish
1-Hour = Bullish
V-Levels Momentum
Weekly = Bullish
Daily = Bullish
10-Hour = Neutral
1-Hour = Neutral
Analysis & Insights
DeCode Market Breakdown
Macro Context
Overall, the Weekly structure remains bullish — both in bias and momentum. We’re trading below a key level at $111,968.0, and continuation is likely unless we see a clear Failed Auction at that level.
That would trigger some serious red flags and force a reevaluation of the directional bias.
Daily Chart
Daily structure is extremely bullish at the moment.
The price recently showed a Failed Auction around the $102,000.0 V-structure Higher Low — indicating aggressive absorption and buyer strength.
As long as price holds above that area, the priority is to stay on the long side.
⸻
10-Hour Chart
Still holding a bullish structure overall.
One thing I’ll be watching closely: the price reacting to the previous High at $110,660.8.
If we get a rejection + Failed Auction at that level, that opens up the possibility for intraday shorts; as a short-term shift in momentum and local resistance kicks in.
1-Hour Chart
📈 Long Setup: Waiting for a clean entry from an OTE / Fib zone + Over/Under structure.
📉 Short Setup: Watching for a sweep of the current highs + a clear Failed Auction (ideally with footprint confirmation).
There’s visible compression between $104k and $105k, so price might look to grab liquidity there first before any real move upward.
10-Min Chart
Currently, no clear trade setups on the 10M.
The 1H hasn’t reached optimal trade zones yet. I’ll be watching closely for any structure shifts or setups aligning with the macro bias.
⸻
🔍 Trading Plan Summary
Bias: Bullish (Weekly + Daily)
Look for longs aligned with HTF support + intraday confirmation
Short opportunities only if we get clear rejection from $110,660.8 + footprint signals

BTCUSDTHello Traders! 👋
What are your thoughts on BITCOIN?
Bitcoin entered a corrective phase after a liquidity hunt above the recent highs and is currently in a short-term pullback.
We expect this correction to extend toward the identified support levels, after which a new bullish wave may begin, potentially leading to fresh all-time highs.
The broader trend remains bullish, and the current correction could offer a buy-the-dip opportunity in line with the ongoing uptrend.
Don’t forget to like and share your thoughts in the comments! ❤️

Ethereum Is Not DEAD ... WHY ??? Because BlackRock Says SoMartyBoots here , I have been trading for 17 years and sharing my thoughts on ETH here.
ETH Is Not Dead — It’s Just Getting Started
Narrative of ETH being “dead” is short-sighted. Here’s why:
1. Ethereum Is Still Younger Than Bitcoin
• Ethereum launched in 2015, a full 6 years after Bitcoin.
• BTC had over a decade of network effect, price discovery, and global trust before ETH even got its first DApp.
• On the charts, ETH still has room to mature, just like Bitcoin did pre-2020.
• Fundamentally, Ethereum is still evolving — from PoW to PoS, scaling solutions (L2s), and now modular chains.
You’re not late to ETH — it’s just halfway through the marathon.
⸻
2. BlackRock’s BUIDL Fund Is a Massive Signal
• The BlackRock BUIDL fund, launched on Ethereum, already has $3B in AUM — and it’s growing.
• It shows that legacy institutions aren’t ignoring ETH — they’re building directly on it.
• This isn’t speculative hype. It’s tokenized real-world assets backed by the biggest asset manager on earth.
• Smart money is moving into ETH, not away from it.
The narrative is shifting. Institutions aren’t betting on meme coins — they’re betting on Ethereum rails.
Final Thought
ETH is not dead. It’s undergoing the same early-stage skepticism BTC did in its early years. With foundational upgrades and institutional validation, ETH might be the most undervalued top asset in the market today.
⸻
Watch the chart. Track the fundamentals. And don’t sleep on ETH.
#Ethereum #ETHUSD #Crypto #fundamentals #BUIDL #BlackRock #OnChainData #NotDead #TradingView
Watch video for more details

Bitcoin analysis based on Heiken-Ashi4hr, daily forecast based on HA pattern. We'll come back to validate it.
USDT Dominance Looks BullishHello all dear friends.👋
According to the chart that USDT Dominance shows, we have an upward trend up to 4.70%. Of course, we may have a slight downward trend before moving up. Based on this, there is also a downward trend ahead for Bitcoin .
❗Please be careful that this is an analysis and opinion.

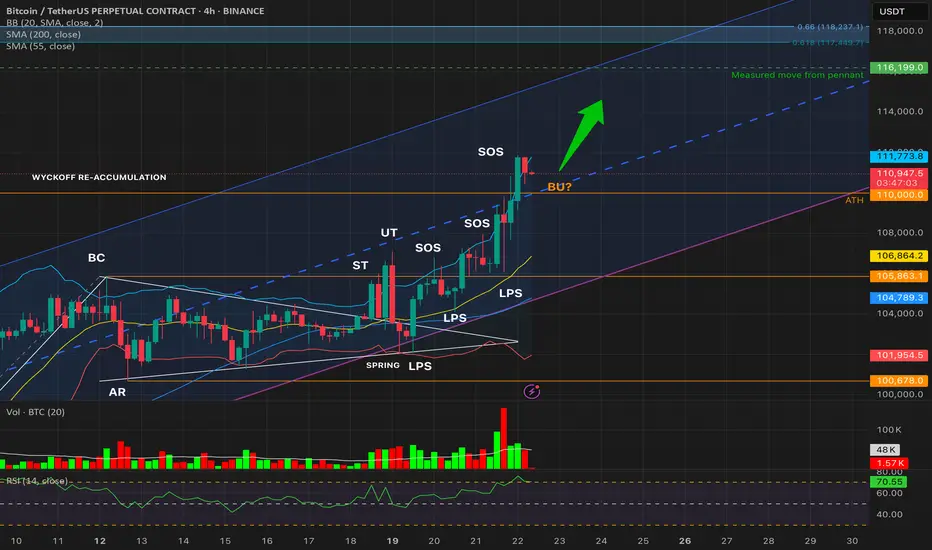
BTCUSDT – Wyckoff Re-Accumulation Breakout ContinuesBitcoin is advancing through a textbook Wyckoff Re-Accumulation structure on the 4H chart. After the Spring and multiple LPS confirmations, price surged above the previous range high (~110k), entering a strong Sign of Strength (SOS) rally.
We now observe:
✅ Second 4H candle close above ATH (110,000)
✅ RSI: 70.9 → Strong bullish momentum
✅ Volume: Above MA during breakout, healthy but slightly declining
✅ Bollinger Bands: Price hugging upper BB (111,227)
✅ Structure forming a Backup (BU?) test near ATH
The current move targets a measured pennant breakout projection:
🎯 TP1: 115,224
🎯 TP2: 116,199
🎯 TP3: 117,449 – 118,237 (Fib extension confluence)
This aligns with Wyckoff Phase E and continuation of the markup cycle.
No short setups valid — trend remains firmly bullish. Pullbacks to 110k could offer high-conviction long entries as BU confirmation.
#Bitcoin #BTCUSDT #Wyckoff #CryptoTA #BTCAnalysis #Reaccumulation #TradingView
BTC/USDT 4H – Bull Flag Breakout SetupA symmetrical triangle has resolved to the upside, confirming a bull flag breakout in line with the prior uptrend. Current momentum is supported by:
* RSI breakout above 60
* Price above mid-Bollinger Band and 55 SMA
* Breakout candle closing above triangle resistance (Yet to confirm)
**Targets:**
TP1: 108,000 – nearest horizontal resistance
TP2: 112,700 – flagpole projection from 104.5K breakout
TP3: Trailing target with 1.0% callback from breakout zone
**Stop Loss:**
Below triangle apex (\~103,000) or 55 SMA (\~103,480), depending on which is closer
**Volume:**
Still below average but RSI confirms bullish momentum. Watching for volume follow-through to confirm strength.
**Wyckoff context:**
Potential Phase D in a re-accumulation range, with breakout as Sign of Strength (SOS) after a spring-like consolidation.
This breakout is being monitored as part of a continuation setup toward 112.7K with proper risk management in place.
