Bitcon

Bitcoin Now and Jan - Feb 2021 ForecastJust publishing the new chart to see how it looks - Analysis Forthcoming

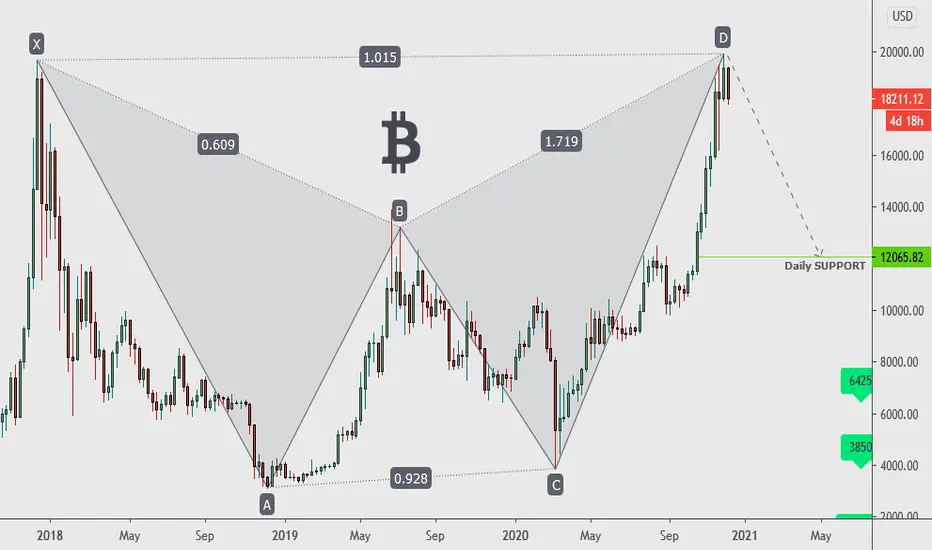
BTCUSD 9 December 2020 - Weekly TimeFrameHello traders, here is the full analysis for this pair ... I saw a butterfly pattern on the weekly chart
We were on board for the rally and now it is time to rest. You may not short but consider to take profit and wait for the next bull run setup...
first support on the daily chart 12065.82
*Support this idea with a Like or Comments if you find it useful*
________________________________⠀
DISCLAIMER: This Information Is Not a Recommendation to Buy or Sell. It Is to Be Used for Educational Purposes Only
Pennant Again on BTC, what now?Ok, it currently looks like we made the negativ break out of the Pennant.
i marked the possible targets for the short trade... where we basicly hit #1
i am happy if you found a good entry for the setup

btcusdtafter rejection from 17500$, is not good at all, so if BTC crosses around 16500$, I'm short but still holding this level , all positions are risky, and just bein in usdt is good tbh!

btcusdt
Possible bitcoin pattern with trading algorithms.
Start the suffering and negative process of bitcoin.
Start of the Altcoins season for the next 3 months


we're riding this shorthello traders
we apologise for the radio silence
we are working on product updates and other exciting offerings for the near future
if you are looking for signals please contact me on trading view to discuss

Bitcoin Daily MACD - 14K+ possible first week of November?Daily upward channel continues as MACD crosses positive.
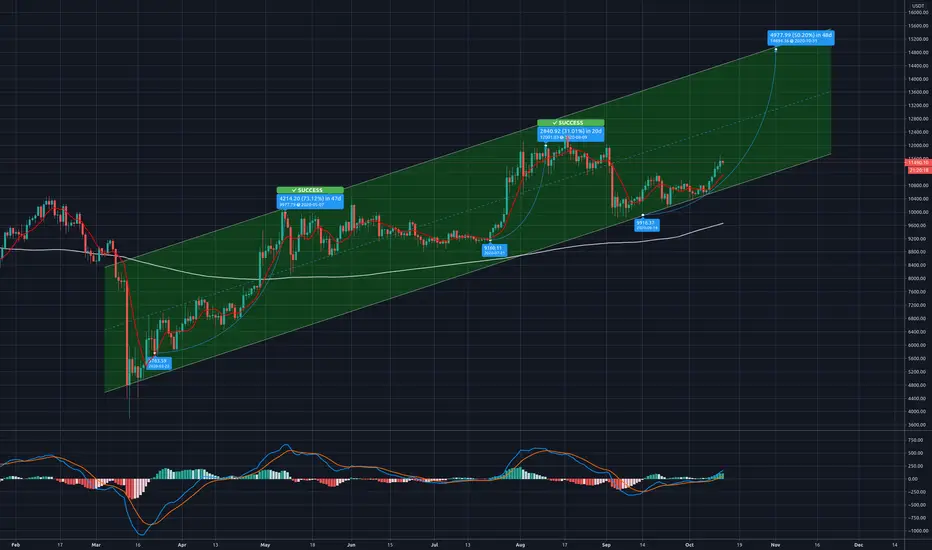
Bitcoin Price Action.With Bitcoin price action moving higher I thought that I can share with you my view on a Daily chart with some simple market geometry and some fib measurements which contain some critical levels including the golden zone fight that we keep on seeing since 2019.
What caught my attention is the second break of the white trendline but not with as much significant volume as the first attempt. In my eyes, this next move is exactly what we need if we want to see that 2019 high challenged. It has all the ingredients for a plunge to the 14k pivot where we faced a very big resistance last year and the algorithm participation was incredibly precise. Bitcoin has 2 more significant pivots to break (14k, 20k) until we will be again in a no man's land and the FOMO will kick in. Stay close, manage your asset classes accordingly. Don't risk more than you are willing to lose!
I wish you guys a wonderful week!

turbo long!80% long trade 20% shorts, eth & btc, stop loss below supp, take profit next potential leg up and re-enter same trade after 10 min chart bottom, the stair pattern will end at some point short term but on 10d timeframe its giga bullish

It’s overIt’s over. Downtrend starts now. If stopped out then 11.2k is likely then short there. Either way don’t get caught in the clueless hype:

Excellent opportunity for Long BTCUSD BITBAY:BTCUSD
Hi friends!
It's a great opportunity for a long position.
Hit the like button if you like my idea.
Thanks!!

What do you think ??5/may is a very dangerous day!!
If we couldn't break out 9500 before 5/may, we will damp da shit again :D
Be careful we still in 2020


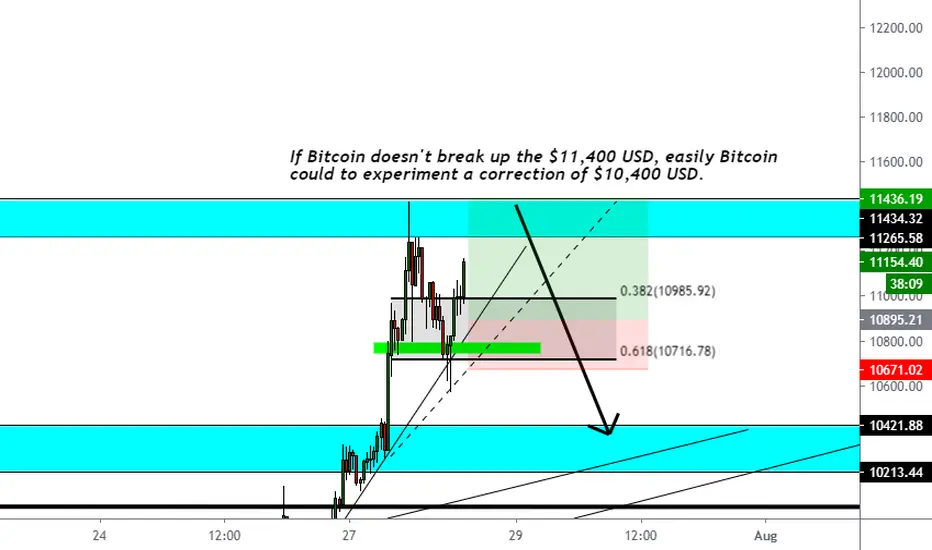
Long until the $11,400 USD: Bitcoin prediction!!!
There are a probability that Bitcoin is goes to the go back to $10,400 USD. So, the crypto-market is more volatil that never we see operate trading and we reccomend to invest 0.02 or 0.01 BTC lots, and not more 0.03 or more becuase we need a 2% of risk, becuase now Bitcoin is so volatil and we need t lot risk to trade, the most confortable is using your capital and know your risk to loss and earn to earn money.
That pattern is so bullish what we see in H4 timeframe, and that mean a possible continuation of the trend in H4 timeframe, in case that Bitcoin goes to break up the $11,400 USD, we could to see a Bitcoin more higher too.
So guys, in this situation the market is become more volatil and so, for that reason, is so difficulty to trade as Bitcoin have volatil conduct.
So, I do not add any position in long or short. the most is wait if the price goes to $10,800 USD and hope a bullish candlestick with other opportunithy to long.

bitcoinall the signs sees that Bitcoin about to head to 20k or maybe more but as you all know can't be so sure, it's Bitcon so let's wait and see what happen next week.
if bitcoin goes down its more likely not going to stop until it rech 4k or 3.5k

Bitcoin - scam PA on the weekendYep, fake pump on Saturday and fake dump on Sunday.
Let's wait for the US stock market open. ES! futures opens 've opened positively (+0.4% atm).
Ideally need to get back above the red line to start a small relief rally (to $9110 lol or $9300 if lucky).
Hit the "LIKE" button and follow to support, thank you.
Information is just for educational purposes, never financial advice. Always do your own research.

Short bitcoin v.2Try shrot it again :)
.
Deal:
Short: $9 250
Stop: $9 380
Take: $8 590
Risk|Profit: 1|5
Volume on deal: 3% from Deposit
Good Luck Have Fun!

Bitcoin Weekly Bearish Signals. Likely to go lower
Today I will show some weekly Analysis which is showing many Bearish signals.
Firstly the RSI has a weekly bearish Divergence. This is a bearish indicator as we are likely to move lower. (Marked by purple arrows )
Secondly There is a bearish engulfing candle which indicates bearish momentum (Indicated by green arrow), you can find more about the pattern here: www.investopedia.com

Short Term Sell, then short term buyHello guys,
This is what I see happening with XRP right now. Anything can happen and we will adapt to what the market is telling us.
The first white rectangle is our first buy zone. Price can come down and bounce around .1856 --- It can, however, come down to the second rectangle and create that double bottom. To move to the upside targeting the top of the pattern and potentially to a higher zone.
We will watch how the market reacts. Pattern identification and price action are key in these zones.
