BTCUSD; Heikin Ashi BITSTAMP:BTCUSD
Weekly time frame and divergences.
Maybe big correction after sweep of previous ATH...
It is very interesting how different methods, approaches we traders use, either to actively look for daily or weekly opportunity or longer term investment.
Bitcon

Ratio Charts in TradingView and IAAbove you can see the Bitcoin to Ethereum ratio chart. Ratio analysis between two or more symbols is a critical method for comparing the strength and weakness of assets relative to each other. TradingView offers basic capabilities for this task, but with the help of artificial intelligence (AI) and custom scripts, much more advanced and creative analyses can be conducted.
Here are some practical ideas:
1. Creating Conditional Ratio Scripts
2. Comparing Relative Averages and Issuing Smart Signals
3. Calculating Composite Ratios of Multiple Assets
4. Smart Alerts Based on Price Pattern Breakouts
For more information, search Google for "How to Use Ratio Charts in TradingView: A Hidden Gem for Traders."

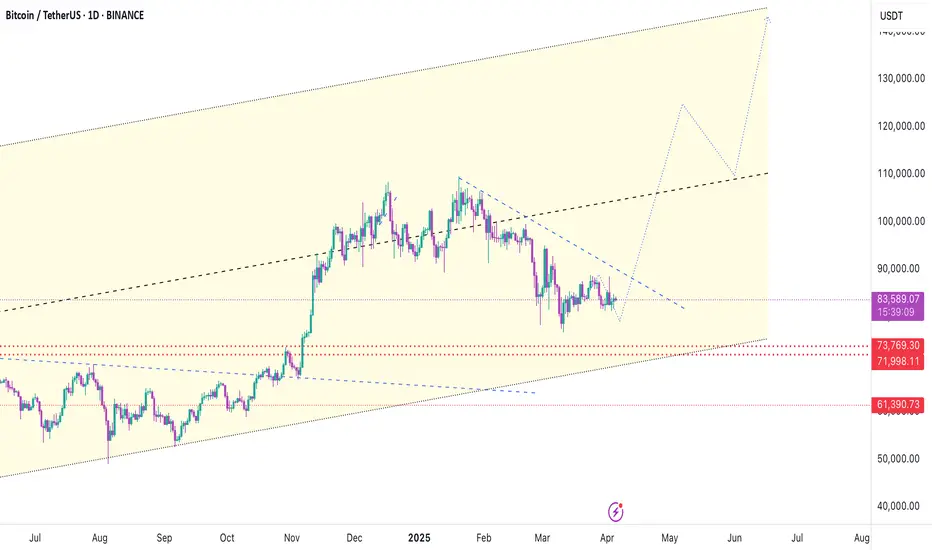
A Bitcoin Prediction (2025)In this chart, we continue the journey of testing whether Bitcoin can live up to the expectations as published in my previous Bitcoin prediction chart (2024). Since we had technically hit my ATH cycle top for 2024–25, we are now gambling with the possibility that we might not have hit the highest cycle top targets and may just extend that little bit more. I think 2025 has most people asking, "Are we done yet?" or are we on the verge of something else? We'll just have to wait and see....
Upside:
As you can see in ATHs, there are several targets, and I've mentioned this in my previous chart. Ultimately, the high side of what this chart can expect from a cycle high is a 2-week close of $131k. Wicks can extend beyond this price, but I expect a close below (according to this chart). A close above will invalidate this chart. All prices within the lows and highs are acceptable.
Downside:
In my previous chart, I hadn't posted any projected targets during a bear market; I only highlighted the lows, as generally that is what most may consider important enough to know—when can we resume the bull market again? Well, in this chart, I have labeled two additional downside targets. Although these do not follow the same pattern as other targets, they do have a significant similarity to previous cycle lows. Expect bounces from these levels, but if the pattern holds true, they will fail and continue to lower prices. In the short term, resistance sits at $98,511, and again this is on a 2-week close. So this next week, we can wick above, which might be the path we are on.
Summary: I'll be posting updates close to each 2 week close, if I see something I'll be sure to post and update.
2024 Chart linked below.

Bitcoin Terminal Price Risk IndicatorToday we’ll explore the Bitcoin Terminal Price Risk Indicator , which builds on the concept of Bitcoin Terminal Price. We’ll follow the same logic as in our previous idea on the Pi Cycle Top Risk Indicator. By the end, we'll have a new tool for analyzing INDEX:BTCUSD market cycles.
First, let’s recap Terminal Price.
Terminal Price = Transferred Price × 21
Transferred Price = Coin Days Destroyed ÷ (supply × time)
It normalizes historical spending behavior to the full 21M BTC supply. This metric has historically been effective at calling Bitcoin cycle tops whenever the price of Bitcoin crosses above it. That being said, it signaled the April 2021 peak, but not the November one.
Let’s now divide the weekly BTC price by Terminal Price. This gives us BTC-to-Terminal Price Ratio. (We use the formula from the Bitcoin Master Cycle indicator by InvestorUnknown for Terminal Price on TradingView.)
When the ratio crosses above 1, BTC price exceeds Terminal Price and signals cycle top. We can notice that each cycle top forms slightly lower ratio peaks.
Now let’s draw two logarithmic curves through the highs and lows of this ratio, and add a midline.
This creates a band within which the BTC-to-Terminal Price ratio tends to oscillate. These bounds can help anticipate major turning points in future market cycles.
Next, we normalize the ratio between these bounds: bottom curve = 0, top curve = 1.
This gives us the Bitcoin Terminal Price Risk Indicator.
Currently, risk sits around 0.46 , bouncing between 0.3 and 0.6 for ~1.5 years. This range suggests a stepwise price increase with consolidation periods in between — and no mania and blow-off top.
Historically:
Risk > 0.9 = potential selling zone
Risk < 0.1 (or < 0.05) = potential buying zone
Note: Risk stays > 0.9 for just 1–2 weeks.
Reality check: the top curve lies above 1 and slopes down only slightly.
This implies that if the ratio approaches the upper boundary, BTC price could meet or exceed Terminal Price this cycle — currently ~$155K and will be rising quickly should BTC move towards it.
However, so far we have very few data points and they don’t fit the curve perfectly. And there’s no guarantee we’ll reach that upper bound.
For a more conservative take, we can replace the log curve with straight lines.
This steeper upper line would signal a top earlier — below Terminal Price.
Using this method, risk is slightly higher now at 0.55. While also not perfect, this linear approximation can serve as a cautious alternative until more data points emerge.
We'll keep tracking these charts.

Hellena | BITCOIN (4H): LONG to resistance area of 98,000.Dear colleagues, in this forecast I will not make too forward-looking plans. I believe that the upward movement is not over yet, because the wave “C” is not yet completed and consists of five waves.
I think that we should expect to reach the resistance area of 98,000. A small correction to the support area of 90,000 is possible.
Manage your capital correctly and competently! Only enter trades based on reliable patterns!

Hellena | BITCOIN (4H): LONG to resistance level of 90,000.Colleagues, after drawing the waves I realized that bitcoin is in a major wave “IV” correction and I believe that this correction is either over or about to be over.
Either way I believe that long positions should be prioritized.
I expect that the price will either immediately start an upward movement and reach the psychological resistance level of 90,000, or will update the low in the area of 75,866 a little more and then start moving towards the target.
In the second case, I advise using pending limit orders.
Manage your capital correctly and competently! Only enter trades based on reliable patterns!

BTC 2026 Bearish We can see after 2 halving cycle BTC will reach the Top Price Cycle within 500 days and will enter Bearish Cycle with the correction of almost 70 to 80 % for approx 300 + days. Will the 70 to 80% correction happen again even after Many Country make BTC legal and Put BTC into their Backup Fund ? Or It will happen but the correction only 30 to 40 % ? Let's see. 2026 will be Interesting

btcIf the green lines are broken, we can easily enter the green box. To reach higher points, it is important not to break these two points.

BTCUSDT RISING WEDGE PATTERN IN 30-MI Created This BTCUSDT Chart Analysis In 30-M Tf
Entry: SELL from 85700
Resistance zone : 86200
Target Will Be : 83200
BINANCE:BTCUSDT made Rising wedge pattern, It's Seems bearish momentum, Let me know your thought in comments section

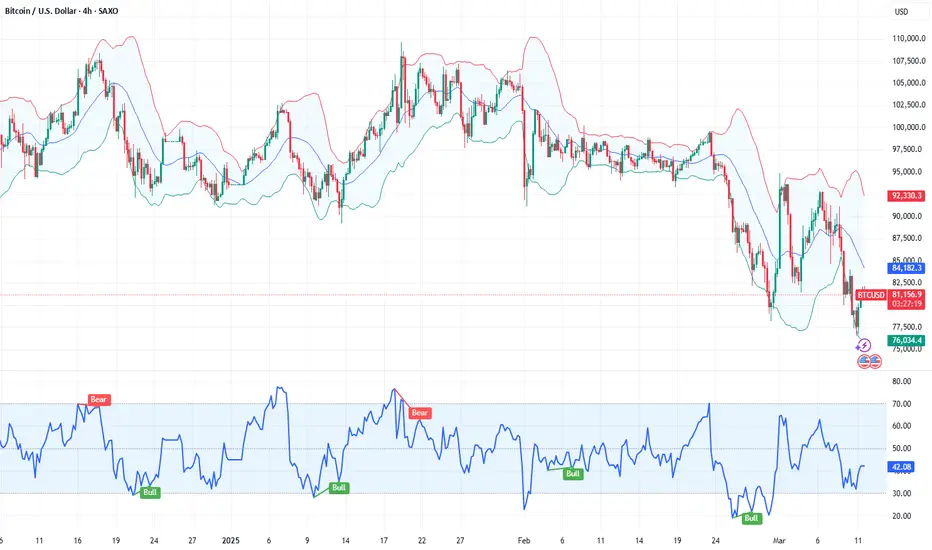
Bitcoin BTCUSDT – 4H Technical Analysis
Bitcoin is currently approaching a key downtrend resistance line that has been respected several times since early February. The price action suggests a potential rejection from this level, which could lead to a move toward the lower boundary of the broader descending channel.
🔹 Bearish Scenario: If the resistance holds, we may see a continuation of the downtrend with possible targets near the $71K– FWB:73K region.
🔹 Bullish Invalidator: A confirmed breakout above the trendline would invalidate the bearish setup and could signal a shift in market structure.
⚠️ Watch price action closely around this level for potential rejection or breakout confirmation.

BTCUSD Daily View Based on your 15-minute BTC/USD chart, here’s a structured technical analysis for **April 10, 2025**:
---
### 🧠 **Chart Breakdown**
- **Break of Structure (BOS)**: Bullish BOS occurred earlier, indicating short-term upward momentum.
- **Strong High**: Marked at **$83,568** — this is a **liquidity point** that could act as a magnet if bullish momentum resumes.
- **Weak Low Zone**: Around **$81,451** — a key liquidity area that might be swept before any significant move up.
- **Current Price**: **$81,814**, sitting just above the weak low zone and in a minor consolidation phase.
---
### 🔍 **Market Context**
- After a strong impulsive move up, BTC started pulling back with lower highs and lower lows, indicating **retracement** or **distribution**.
- The price is holding slightly above the weak low, meaning:
- Smart money may be trying to **trap shorts or induce longs** before a deeper sweep or reversal.
- There's potential for **liquidity sweep below $81,451** before heading back up to test the strong high ($83,568).
---
### 🔮 **Today's Bias: Neutral-to-Bullish (Scalp or Swing)**
#### 🎯 **Bullish Scenario (Preferred if $81,451 holds)**
- Price holds above or sweeps $81,451 and **reclaims the zone quickly**.
- Expect a bounce toward:
- **$82,500** (intermediate resistance)
- **$83,568** (strong high / liquidity target)
#### 🛑 **Bearish Scenario (Only if clean break below $81,451)**
- Price breaks and holds below **$81,451** → retest failure = bearish.
- Target downside levels:
- **$80,500**
- Potentially **$79,500** if momentum is strong.
---
### 🧭 **Action Plan for Today**
| Type | Strategy |
|-------------|----------------------------------------------------------|
| Intraday Long | Buy near $81,451 zone with tight SL below $81,200 |
| Confirmation Entry | Wait for 15m bullish engulfing / BOS above GETTEX:82K |
| Short Setup | Only valid on clear 15m breakdown + retest below $81,451 |
---

BTC - 4 Different Wider Looks at BTC1️⃣ Weekly EMA 55. Many legit touches.
2️⃣ Possible Elliot Wave in Log chart.
3️⃣ 4H EMA 200.
4️⃣ A valid Pitchfork since Dec 2024
Follow for more ideas/Signals. 💲
Look at my other ideas 😉
Just donate some of your profit to Animal rights and rescue or other charity :)✌️

BTCUSDT, We were moved like ...Hello everyone
According to the chart that you can see the price movement was exactly moved to our route but at this time we expect because of the reason in world and US Reciprocal Tariffs at this time Gold movement is important after the Gold start the corretion wave the smart money comes to the cryptocurrency market and we expect the excitement movement.be patient until ...
Be Lucky
AA
Short Position EOS/USDT#Singal
EOS/USDT
🔴 Short Position
🎲 Entry @ 0.6990
✅ Target1@ 0.6664
✅ Target2 @ 0.6220
✅ Target3 @ 0.5476
✅ Target4 @ 0.4856
✅ Target5 @ 0.4263
❌ Stop Loss @ 0.8509
Leverage: 5X_15X
Margin: 10% of Wallet Balance
⚠️"Take Care of Risk Management for Your Account"

Bitcoin in Ascending Wedge?Looks like a rising wedge guys - I'm not a charting TA expert but would love to here your thoughts. Many bears keep posting a drop to $70K level.. I guess that drop is written in some prophecy somewhere, and they believe (or hope) it MUST happen, before we go for new ATH. Maybe so... however can anyone explain WHY that must play out like that? A couple of weeks back i was in that camp but after I see the slow and steady Bitcoin recovery, I have changed my mind.

BTCUSDT | H4 Market OutlookWait for the price to retest the entry level before executing a buy trade. If the price fails to revisit that level, avoid taking the trade to maintain a disciplined approach.

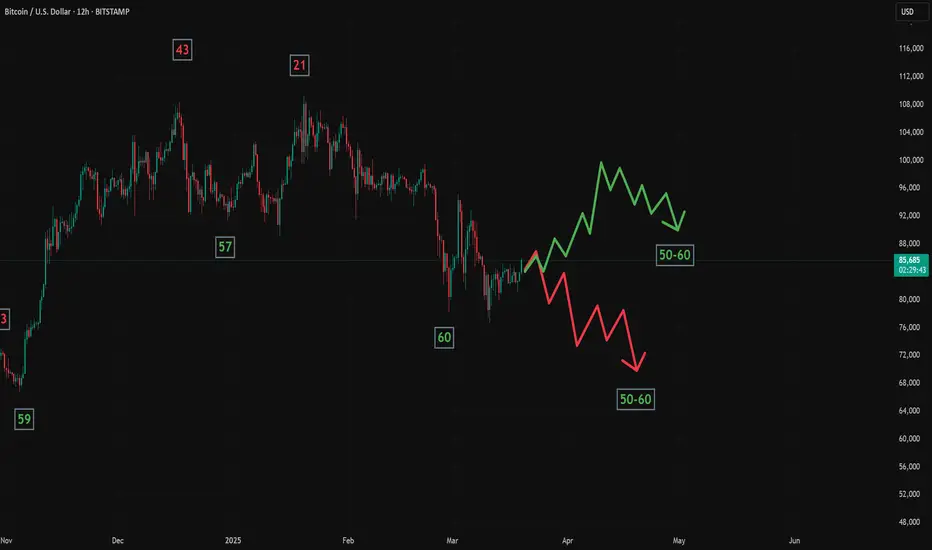
2 Paths for Bitcoin in this 60-Day CycleThere are two possible scenarios for the rest of this cycle:
1️⃣ Bearish Scenario (Most Likely)
Bitcoin hit a cycle low at $78,000 on February 28th.
It initially showed strength but quickly reversed, forming a failed cycle.
This suggests a lower low is likely before the cycle ends.
If holding BTC, the best strategy is to sell at the next 3-day Cycle high (message me if you don’t have access to the Cycle indicators), expected next week.
2️⃣ Bullish Alternative
If the recent drop was caused by macro factors rather than natural cycle movement, we could still see a higher high before the cycle ends.
The 1-week Cycle (red line) is forming a bottoming pattern, which could indicate upside potential toward $90,000+.
How I’m Approaching This Cycle
I purchased BTC below the current price and plan to hold through this cycle. My reasoning:
We are currently at the bottom of the mid-term trend, and I expect a strong rally in the near future.
As mentioned in my previous newsletter, it’s crucial to combine the 60-day cycle with other timeframes:
2-week, 1-week, 3-day, and 1-day cycles all provide additional confirmation.
BTCUSD - A fresh look on the current supportIf you understand the mechanics of the Medianlines aka Pitchfork, then you understand the projected movement of the markets.
Whatever you measure with them, the same principal applies.
In the prior analysis, the framework of the Medianlines pointed us in the right direction.
Now it's time to reassess this product.
The 0 to 5 Count:
It's often a good indication when the last sprint happens. After P5, the count starts again from 0, up to 5 again. Here we see that the P5 was reached and we get the bounce, down to the Center-Line aka Medianline, where it finds support.
Could it move upward again? Absolutely, even if it where just for a pullback and the a further continuation to the downside. In fact, I even expect it to bounce up to the red resistance zone.
This would mark P2 before a harder drop down to P3, cracking the Centerline.
Most often after the Centerline is breached, we see a test/retest to it. (P3-P4), an exhaustion of the buyers and then the final hit on the head with a target at P5. In between P4 and P5, there's also the 1/4 line, where we often see a sudo-support. But it's not often that price starts to turn again and negating P5. It's mostly just a try, before the last drop to P5.
So there you have my coffee-ground reading.
Always remember, that even with such an accurate TA-Framework, we only shall trade what we see.
Many thanks to the loyal followers and all likes and sharing. I always love your feedback and constructive criticism. §8-)

BTCUSDT: Possible sell setupBTCUSDT: Possible sell setup. Watch the candles at the selected area. If you see good rejection, Sell.
Cheers

Bitcoin's Natural Correction and the $141K Target Based on Fibonhello dear trader and investors
The cryptocurrency market is always accompanied by strong fluctuations and natural corrections. Bitcoin, as the market leader, requires corrections and liquidity accumulation after each significant rally to pave the way for higher price targets. In this article, we analyze Fibonacci structures and harmonic patterns to demonstrate that Bitcoin's next target could be $141K.
1. Bitcoin Corrections: A Natural Part of an Uptrend
Price corrections in bullish trends are a normal phenomenon that helps shake out weak hands and allows major players to accumulate liquidity. Historically, Bitcoin has experienced 20-30% corrections before resuming its upward trajectory. The current correction is no different and may serve as a base for the next strong move toward higher targets.
2. The $141K Target Based on Fibonacci
Fibonacci levels are among the most reliable tools for predicting price targets. Assuming Bitcoin's recent high was around FWB:73K and the ongoing pullback is a healthy retracement, we can use harmonic AB=CD pattern to project potential upside targets. Based on these levels, Bitcoin could reach $141K in the next bullish phase.
Confirmation Through Harmonic Patterns
Harmonic patterns like Butterfly and Gartley suggest that the current correction is forming a potential reversal structure. If this correction completes within the PRZ (Potential Reversal Zone), Bitcoin could see a strong continuation of its uptrend. The Fibonacci ratios in these harmonic structures indicate that the final price target for this bullish wave could be around $141K.
Volume and Liquidity: Key Drivers for the Rally
Bitcoin needs increased volume and liquidity inflows to reach higher levels. On-chain data shows that trading volumes are rising and large investors (whales) are accumulating rather than selling. This behavior typically precedes a strong bullish move.
Bitcoin's current correction is entirely natural, and technical structures suggest that it could be laying the foundation for a new bullish wave. Based on Fibonacci and harmonic pattern analysis, Bitcoin's next major target is around $141K. Traders and investors should consider these levels in their analysis and avoid emotional decisions during market corrections
good luck
mehdi

Why did stocks and crypto crash, and when will they rebound?At the beginning of March 2025, markets experienced a significant decline due to several key factors. One of the main reasons was increased economic uncertainty following the introduction of new U.S. trade tariffs against China, Mexico, and Canada. As a result of the trade wars initiated by Trump, the world’s wealthiest individuals lost over $40 billion since the beginning of the year. From March 7 to March 10, 2025, shares of leading tech companies and the Nasdaq 100 index (#NQ100) suffered a sharp drop: Tesla’s stock (#Tesla) plunged by 15%, Apple’s shares (#Apple) declined by 4.9%, Nvidia’s stock (#NVIDIA) fell by 5.1%, and the #NQ100 index dropped by 4%.
In the digital asset market, the downturn accelerated after investors failed to see the expected government support for cryptocurrencies. Initial regulatory announcements, which initially sparked optimism, turned out to be vague, leading to disappointment and profit-taking. Finally, fears of a potential recession, fueled by statements from the U.S. president, further eroded investor confidence in both the stock and crypto markets. Collectively, these factors led to a broad market decline and heightened volatility. As a result, Bitcoin dropped nearly 15% between March 7 and March 10, 2025, reaching $77,500.
Despite the current challenges, several factors could contribute to market recovery and growth in 2025:
Advancements in technology and artificial intelligence: Companies specializing in AI and high-tech development continue to attract investments. Giants like Microsoft (#Microsoft) and Google (#Google) are expected to strengthen their positions by expanding AI applications in business and daily life.
Growth in the healthcare and biotechnology sectors: Pharmaceutical and biotech companies remain resilient to economic downturns due to sustained demand for healthcare and innovative treatments. Companies researching cancer and autoimmune disease treatments are expected to draw increasing investor attention.
Transition to green energy: Renewable energy companies are showing steady growth. Tesla (#Tesla) remains a key player, and 2025 is expected to see further expansion in solar, wind energy, and battery technology companies.
Macroeconomic policy stabilization: The U.S. Federal Reserve is expected to adopt a more predictable monetary policy, potentially reducing market volatility and boosting investor confidence. In 2024, the Fed aggressively raised interest rates to combat inflation, which pressured stock markets and limited access to cheap money. However, by 2025, inflation has begun to slow, which could lead to a more accommodative monetary policy and possible rate cuts.
Institutional investments in cryptocurrencies: A crucial factor is the integration of blockchain technology into the financial sector. Companies like Visa (#Visa) and Mastercard (#Mastercard) are expanding their support for crypto payments, while PayPal (#PayPal) is actively incorporating stablecoins into its ecosystem. This trend is driving broader adoption of digital assets and their practical use in the real economy.
Despite the current challenges, there are significant chances for recovery and growth in both stock and cryptocurrency markets. Analysts at FreshForex predict a market rebound in the second and third quarters of 2025 — don’t miss out!
Our trading platform offers 270 instruments, including CFDs on stocks, cryptocurrencies, and indices with leverage up to 1:2000. Stay ahead of the market and capitalize on trading chances!
BTC shortFollowing this pullback, my prediction suggests a further decline with a target at $70,000, marking the first Fibonacci extension level in this sequence. This $70,000 target is particularly significant as it closely aligns with Bitcoin’s previous all-time high of around $69,000, reached in November 2021.

Russel 2000 Compared to General MarketTVC:RUT has continued to sell off since my last couple posts and I believe we could see a huge market correction this year if price doesn't look to stop selling.
The next play on RUT I would like to see price pullback to the last breakout zone ($2,200) to confirm a continuation in trend
This play also looks very familiar to the 2022 selloff with equal highs to our current price structure. Seeing that AMEX:SPY is at a higher high tells me there is market-wide divergence and a topping pattern could be in play.
Now when we add CRYPTOCAP:BTC and $OTHER to the mix we can see bitcoin actually tops out first while Alts and SPX look to make one more leg up before crashing out.
The Trend Reader at the lower tab has topped out and has a bearish crossing in the overbought zone indicating we can see a long term play to the downside.
