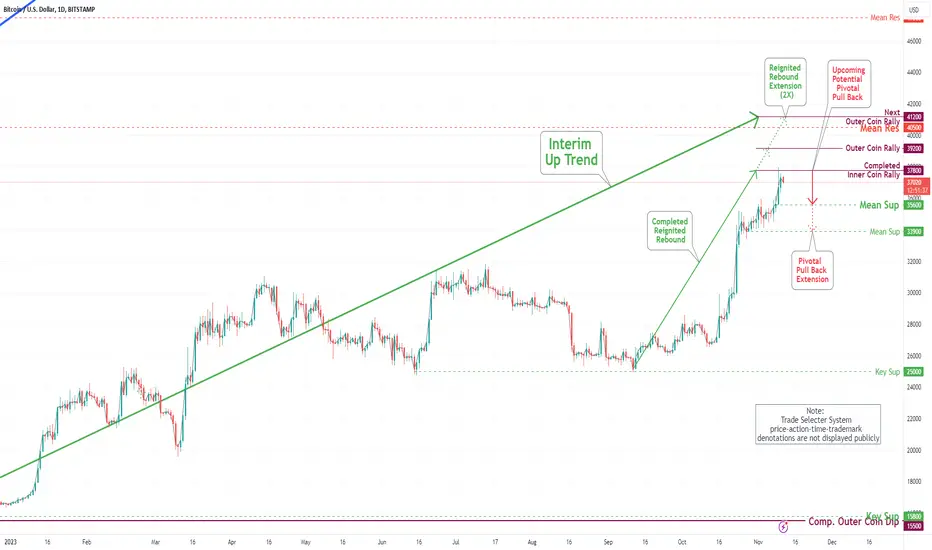
Bitcoin(BTC/USD) Daily Chart Analysis For Week of Dec 15, 2023Technical Analysis and Outlook:
Throughout this week's trading session, Bitcoin has been trading within a specific range, defined by two fundamental values: the Completed Outer Coin Rally 44500 and Mean Res 44100. This range has created a level of stability in the market and has allowed for some predictability in the short term.
The market is on an upward trend that is expected to continue. Bitcoin is projected to reach the newly established intermediary Mean Res 43100 and surpass it in the coming days. In a downturn, the intermediate target is the robust Mean Sup 41200. This is a crucial level for traders to watch, representing a solid support level for Bitcoin.
Blockchain

Why are you sitting on your hands?There are numerous indicators screaming buy for the last 4 months. we are in the best buy zone of our time RIGHT NOW!!. The evidence is over whelming that the bottom is in!!! Why are you waiting? Why are you listening to the news? is it different this time? Not really.
In previous history by the time the lower BLUE band flashed the CM ADX the bear market was ending . so lowered prices preceded the blue. This time was different... what?? yes it was. the BLUE flashed and then the price followed, however the stochastics are CM MACD is about to cross up and this is a bullish indicator. One other trend is this blue buy zone is getting smaller every time it happens.
The bear market looks like it will be ending by March/April of 2023.
Thanks for looking
comments and questions down below.

Protesting Your Acquiescence!Stop denying the facts!
Your acquiescence is just fear, conquer it and you will see and think clearly!
The bottom is in, everything you need is right in front of you!
Come, March with me into April and beyond. REMEMBER, WE ARE SATOSHI!!
If you need help comment below.
*Look first, then jump. Tradingview.com*

The Grand Inquisitor & Kenobi #2This chart is to be looked at like an inquisition.
You are the Grand inquisitor and Kenobi is Bitcoin . You simply track him to gauge possible future movements. Prices points and time lines are all hypothetical, but are based off past movements. This charts purpose is to get a greater perspective on where we are and where we might be going, seeing the big picture . So, will Kenobi be predictable or does he have some tricks up his sleeve.
In the chart we can clearly see diminishing returns and also there are signs of possibly lengthened cycles, however I'm not fully convinced of that just yet.
I hope so far you can follow up to this point. If you are having trouble understanding please ask in the comments.
Thank you for looking
WeAreSat0shi

The strongest evidence that bulls are gaining momentumSo here we have The CM ultimate Moving average MFA on the 2 week time frame with the PI Cycle Bottom. On the bottom we have the Stochastic RSI. Combining these three indicators is showing a very powerful case for the bottom being in and that we will in the next few weeks flip bullish. The interactions of these indicators go back all the way to 2011.
The PI cycle bottom is has been modified to only on show the short MA and the color has been changed to orange while the long MA has been deleted to keep the chart clean as it's not useful in this chart.
As we can see here for the entire bitcoin history, when ever the PI SHORT MA has crossed into the ULTIMATE MA it sparked the beginning of the downfall and the ULTIMATE MA only weeks later turned red and prices would start to plummet. The bear market on every occasion has ended when the PI SHORT MA crosses back up through the ULTIMATE MA and shortly after would confirm the bull market by turning Green again. We also have the stochastic backing all this movement by showing the rise in momentum.
This indicator is so good it even caught the COVID crash of 2020 and warned that trouble was brewing weeks in advance.
So... where are we now on the timeline? It's showing that not only is the bottom in most likely but the the bull market could be only weeks away as the stochastics have made a cross up and momentum is building. also the PI SHORT has stopped it's downward momentum and is preparing for it's eventual cross up of the ULTIMATE MA.
The only question left is, where do you stand? Have you bought the dip or are you waiting for lower prices?
My evaluation from this analysis is that we are at least half way through the bear the market.
Please feel free to ask questions or add any comments below
Thanks for your looking and please hit the like.
*Chart analysis is risk management... There is always risk, hence the reward*

Dragons are the most powerful creatures!!Let's take a look at Tsuka.
This is a meme coin, yes, a dragon meme coin.
Just by looking at the technicals of this coin, it looks like it could be turning the corner. There could be a fairly substantial move coming soon. Of course nothing is confirmed yet, especially on this time frame (weekly) other than the volume. The volume has spiked up in a big way this is confirmed for two weeks straight now.
The price action
The first week lead to a 100% move (mostly in one day) which did not hold as it sold off with that very large wick. The key to all of this is even though the sell off happened the volume has remained high price action has bounced again, while the technicals are still showing strength and gaining momentum.
Final analysis
Putting all the meme coin non sense and Japanese dragon lore aside, the technicals for this coin look strong. Although the weekly is a bigger time frame and is showing some signs of a reversal, the smaller time frames have also turned even more so. The 3day time frame is worth noting. On the 3 day the stochastics are showing the momentum gaining strength and are in the buy position, the MACD looks like it will cross in the next few days as the histogram is slowly creeping into the green from red. If this follows to the 5 day it should then all translate to the weekly.
My thoughts
Although still not a popular belief, bitcoin and crypto are in the early stages of a bull market. I think it will take sometime for Tsuka to work through some price levels and conquer some Moving Averages. As it grows and gains momentum and the trend flips, it will most likely move fast. This all could happen when the belief of Bitcoin comes back and investors realize the market isn't going much lower over the next few weeks. I think the risk of this coin going lower than it's recent price of of 3 cents is very low at this time.
As always, this is not financial advice. The Markets are chaotic and there is always risk of more down side.
Kind regards
WeAreSat0shi

RAiN: $0.0030 | Warehousing every Blockchain Game in the SCENEa one stop shop for blockchain games
like every issue...
when you are down
you can go lower to WEED out TOURiST
and pump it back to fresh highs for STRONG hands to be rwarded
float SECURED
handler Gang of 8
lead manager Polygon STUDiOS
settlement $100M
pre arranged $50M at $1.0
sureplay $20M or at $0.40 cents
semi guaranteed at $.012
Catalyst: Asian Summer Gaming Season + Dubai Q4 Circus

Bitcoin(BTC/USD) Daily Chart Analysis For Week of Dec 8, 2023Technical Analysis and Outlook:
Bitcoin has completed our three consecutive Outer Coin Rallies 39200, 41200, and 43700 in this week's trading. On the downside, the intermediate down target is Mean Sup 43100. The subsequent squeeze will likely be Mean Sup 41500.
The upside price movement is expected to be aggressive and intense, as the market sentiment is tilted towards bullishness. The market participants will likely be actively buying, leading to a surge in demand for the asset pushing the price higher. However, it is essential to note that the market is volatile and subject to sudden changes, so investors should remain cautious and closely monitor the support and rally outcome price targets.

BTC pennat breakoutBTC sideways since 24th Oct.
and finally we see a pennant breakout on 1st November.
next level to clear = $36,000 , then $40,000.
$34,000 supported quite well.
MACD is bullish bias.
DYODD.

Bitcoin(BTC/USD) Daily Chart Analysis For Week of Dec 1, 2023Technical Analysis and Outlook:
With prices trading in a relatively narrow range, Bitcoin penetrated our exhausted completed Inner Coin Rally 37800 and is heading towards the Next #1 Outer Coin Rally 39200 and beyond. On the downside, the intermediate down target is Mean Sup 37300. The subsequent squeezes will likely be significant and turbulent once the market successfully achieves these Outer Coin targets.

#BTC/USDT 2D (ByBit) Rising wedge breakdown and retestBitcoin is facing historical supply zone and seems likely to get rejected on it, especially with that overbought RSI.
Probably wise to hedge short towards 100EMA support for the months to come.
⚡️⚡️ #BTC/USDT ⚡️⚡️
Exchanges: ByBit USDT, Binance Futures
Signal Type: Regular (Short)
Leverage: Isolated (4.0X)
Amount: 4.9%
Current Price:
33884.4
Entry Zone:
34464.6 - 36135.0
Take-Profit Targets:
1) 30982.8
1) 27731.6
1) 24480.3
Stop Targets:
1) 38912.3
Published By: @Zblaba
CRYPTOCAP:BTC BYBIT:BTCUSDT.P #Bitcoin #PoW bitcoin.org
Risk/Reward= 1:1.2 | 1:2.1 | 1:3.0
Expected Profit= +48.9% | +85.8% | +122.6%
Possible Loss= -40.9%
Estimated Gaintime= 2-5 months


Bitcoin(BTC/USD) Daily Chart Analysis For Week of Nov 24, 2023Technical Analysis and Outlook:
Like last week, Bitcoin's price has remained within the 37800 Inner Coin Rally range and the robust 35600 Mean Support level. This indicates that the market has been relatively stable, with neither bulls nor bears having a strong grip on it.
On the upside, there is potential for intermediate upward momentum in Bitcoin's price, which could lead to a breakout above the current Inner Coin Rally of 37800. If this occurs, the next price target would be at the Outer Coin Rally #1 of 39200, followed by #2 of 41200 and #3 of 43700. This suggests that there is significant room for expansion in the near future, which could attract more investors/traders to the market.
On the downside, the Mean Support level of 35600 is expected to support Bitcoin's price strongly. If the price were to drop, it would likely find support at this level. Overall, the market is consolidating, with prices trading within a relatively narrow two-thousand-dollar range.

SOL 🎵 Playing Out LoudHello TradingView Family / Fellow Traders. This is Richard, also known as theSignalyst.
Weekly : Left Chart
📊 As per our last analysis, SOL broke above the 50.0 round number signaling the start of the MarkUp phase.
H4 : Right Chart
📈 From a medium-term perspective, SOL is still bullish trading within the green rising broadening wedge.
📉 SOL will remain bullish and we will be looking for trend-following buy setups after every correction, unless the 50.0 support is broken downward, in which case a bearish correction would begin.
📚 Always follow your trading plan regarding entry, risk management, and trade management.
Good luck!
All Strategies Are Good; If Managed Properly!
~Rich

dYdX's (DYDX) Buying Momentum DecreasingdYdX (DYDX)
DYDX has surged more than 200% over the first three weeks of November. This growth is primarily linked to the cryptocurrency project's recent launch of its own blockchain, which increased the visibility of the dYdX exchange and boosted the demand for its token.
At present, DYDX is trading between a support zone of $2.80-$3.15 and a resistance range of $3.50-$3.75. A slightly higher seller's zone is observed at $4.00-$4.35. Testing this higher range is seen as the next step in maintaining the upward trend. Nevertheless, the likelihood of reaching a new yearly high seems uncertain due to the gradual waning of the buying momentum.
In the event of a correction, DYDX could potentially fall back to support levels of $2.15-$2.40 and $1.8-$2.0. It's also crucial to consider fundamental factors, such as the significant unlocking of DYDX coins that took place at the beginning of November. In a scenario where the price drops, the market might witness a substantial sell-off of coins, which could further negatively affect the asset's price.

Bitcoin(BTC/USD) Daily Chart Analysis For Week of Nov 17, 2023Technical Analysis and Outlook:
Currently, the price of Bitcoin has been contained within our completed Inner Coin Rally of 37800 and vital Mean Sup of 35600. This has resulted in a trading tunnel that is particularly beneficial for those experienced in active trading. However, it is worth noting that the price is currently dropping towards the Mean Sup of 35600, and there could be a possibility of a further correction to the Mean Sup of 33900. On the upside side, Bitcoin's price has the potential to reach the Next #1 Outer Coin Rally of 39200, #2 41200, and #3 43700. This indicates a prospect for upward momentum in the near future.
Observing these price-action developments closely is crucial, as they could allow investors/traders to profit from the market. Understanding these price fluctuations and knowing when to act can be extremely beneficial in maximizing returns.

XRP - Impulse - Correction - Impulse ↗️Hello TradingView Family / Fellow Traders. This is Richard, also known as theSignalyst.
📈 According to my latest analysis (attached on the chart), we expected XRP to reject the 0.7345 zone.
This week, XRP entered a correction phase, and it is currently approaching the support zone.
🏹 For the bulls to regain control and initiate the next impulse movement, we need a break above the red channel and the last major high.
Meanwhile, XRP would be bearish, trading inside the falling red channel, and could still move lower to test the 0.55 support.
📚 Always follow your trading plan regarding entry, risk management, and trade management.
Good luck!
All Strategies Are Good; If Managed Properly!
~Rich

AVAX EXPLOSIVE Growth Potential - DAPP BuilderPlease Excuse the audio, I have a version on my Youtube with far better audio, for some reason, my computer won't let me select my Microphone. You can find our youtube link in our trading view bio
With the recent announcement by JP Morgan's ONYX regarding their stake in AVAX I thought this would be the perfect time to cover this Incredible asset.
In short ONYX is predicting that subnets ( individual blockchains that have been specifically designed to suit the needs of institutions. That means extra consideration has been given to network privacy, gas, ETC) will be extremely valuable to institutions in the near future and are betting big, since this announcement we have already seen over a 20% increase in price, but how much more can we actually run?
From a Technical side, we are at a huge inflection point, In the past when we have crossed the $18 region we have seen explosive growth, anywhere from 200% - 700%. Although it is highly dependent on bitcoin / ETF approval/ overall market, If we can maintain above this zone its only a matter of time before we fly to our first targets / Resistance points
Outlined here are a few important zones to watch
Resistance Point 1 .382 level: $24.00 ( Just rejected off this 12 hours ago)
Target 1 : - $ 26.60
Target 2 (Midterm Major Resistance/Support Zone): $61.86
Strong Resistance Zone : $93.50
Target 3/ Breakout Resistance Zone: $112.75

BCH - Still Strong ↗️Hello TradingView Family / Fellow Traders. This is Richard, also known as theSignalyst.
📈 BCH has exhibited an overall bullish trend , trading inside the rising channel in red.
At present, BCH is undergoing a correction phase and it is currently approaching the lower bound of the channel.
Moreover, it is retesting a demand zone in blue.
🏹 Thus, the highlighted red circle is a strong area to look for buy setups as it is the intersection of the blue demand and lower red trendline acting as a non-horizontal support.
📚 As per my trading style:
As #BCH approaches the lower red circle zone, I will be looking for bullish reversal setups (like a double bottom pattern, trendline break , and so on...)
📚 Always follow your trading plan regarding entry, risk management, and trade management.
Good luck!
All Strategies Are Good; If Managed Properly!
~Rich

DOGEyyy-Doo, Where Are You🐕Hello TradingView Family / Fellow Traders. This is Richard, also known as theSignalyst.
📉 DOGE has been overall bearish trading inside the falling red channel and it is currently approaching the lower bound / red trendline.
Moreover, the 0.05 - 0.055 is a strong demand zone.
🏹 So the highlighted red circle is a strong area to look for buy setups as it is the intersection of the green demand and lower red trendline acting as a non-horizontal support.
📚 As per my trading style:
As DOGE approaches the lower red circle zone, I will be looking for bullish reversal setups (like a double bottom pattern, trendline break , and so on...)
🔎 From a long-term perspective, for the bulls to take over, we need a break above the last major high around 0.084 highlighted in blue.
📚 Always follow your trading plan regarding entry, risk management, and trade management.
Good luck!
All Strategies Are Good; If Managed Properly!
~Rich

BTC - Macro View 🌐Hello TradingView Family / Fellow Traders,
📈 Following the rejection of the 25,000 support, BTC experienced a significant 50% surge , forming another bullish impulse that confirms the ongoing upward trend.
Consequently, we've identified and outlined a rising channel in orange.
BTC is currently approaching the upper boundary of the orange channel, coinciding with the 40,000 resistance zone.
🏹 To sustain bullish control and assert dominance from a macro perspective, a crucial requirement is a weekly candle close above 40,000. Such a development would likely lead to a parabolic movement, aiming for the 50,000 resistance level.
📉 Meanwhile , considering BTC's proximity to a formidable resistance zone, there remains a possibility of bearish intervention, potentially pushing it back into a range reminiscent of the 25,000 to 30,000 range.
This scenario's confirmation would depend on lower timeframes, especially if a bearish reversal setup is triggered.
📚 Always follow your trading plan regarding entry, risk management, and trade management.
Good luck!
All Strategies Are Good; If Managed Properly!
~Richard Nasr

Bitcoin(BTC/USD) Daily Chart Analysis For Week of Nov 10, 2023Technical Analysis and Outlook:
The latest update on Cryptocurrency indicates that it has completed the Inner Coin Rally 37800 and is currently in the correction phase. The correction is expected to take it down to the intermediate target of Mean Sup 35600, but there is also a possibility of the correction extending further to Mean Sup 33900. On the upside, there are two crucial levels that investors/traders should keep a close eye on. These are the Outer Coin Rally 39200 and the Outer Coin Rally 41200. These levels are significant as they can influence the future trend of Cryptocurrency.
All Eyes on ETH 👀Hello TradingView Family / Fellow Traders. This is Richard, also known as theSignalyst.
📈 After rejecting the lower boundary of the red wedge pattern, ETH has displayed bullish behavior.
However , it is currently approaching a robust resistance zone between 2150.0 and 2300.0, intersecting with the upper red trendline, thus acting as an overbought zone.
To maintain control and establish a long-term bullish perspective, a weekly candle close above 2300.0 is essential for the bulls. If achieved, a movement toward the next resistance at approximately 3000.0 could be anticipated.
📉 Conversely, as long as ETH trades below 2300.0, the possibility remains for bears to initiate a correction, with confirmation likely on lower timeframes.
Monitoring the price action around this key level will provide valuable insights into the market direction.
📚 Always follow your trading plan regarding entry, risk management, and trade management.
Good luck!
All Strategies Are Good; If Managed Properly!
~Rich
