BTC - Short-Term and Long-Term View ⛳️Hello TradingView Family / Fellow Traders. This is Richard, also known as theSignalyst.
on DAILY: Left Chart
As mentioned previously, BTC has been trading inside the orange channel as a correction phase inside the black rising wedge pattern.
Hence, As / If BTC approaches the green demand zone, we will be looking for short-term trend-following buy setups.
🏹 For the bulls to take over long-term, we need a break above the current major high in orange.
on H1: Right Chart
From a short-term perspective, BTC has been stuck inside a range in the shape of an inverse head and shoulders.
🏹 For the bulls to take over short-term, we need a beak above the blue neckline. In this case, a movement till the upper orange trendline from daily would be expected.
📉 Meanwhile, if BTC breaks below the last low in red, we will expect further bearish movement.
For now, we wait ⏱
📚 Always follow your trading plan regarding entry, risk management, and trade management.
Good luck!
All Strategies Are Good; If Managed Properly!
~Rich
Blockchain

The Quant Monster :) Quant Network GPW:QNT
Quant launched in June 2018 with the goal of connecting blockchains and networks on a global scale, without reducing the efficiency and interoperability of the network. It is the first project to solve the interoperability problem through the creation of the first blockchain operating system.
Many have said it's a 4 digit coin (left side of the decimal) and I have a good feeling their right and come next bull run it'll more than likely do very well. What I have noticed is it doesn't like to move much unless Bitcoin is moving sure many are the same of course but some are even more so and QNT seems to be that case so, lets see if Bitcoin can get to moving :)
Daily chart MACD impulse line has crossed the signal line (highlighted below) along with trading above the MA. Just could use more volume to kick things off perhaps :) will see soon enough some have priced next gains between 240 - 320 not bad at all perhaps it'll happen today but time will tell soon enough.

Is the Crypto total looking to complete the 5th wave?Could we see another leg up for wave 5 completion before the ABC correction?
"
Yes it's possible, the market cap could make it's local blow off top and get a re rejection off the 200 3day MA. The mechanicals are lining up for a "possible" move. We wait for the confirmation as there is non yet. The RSI would have to get above it's mid ranging uptrend line with a possible short term break above the top, and the Stochastics would have to make a strong move up. The first glimmer is the Stochastics and there is no confirmation yet.
The Sentiment Oscillator is showing clear bear divergence but it doesn't mean that the final wave isn't possible.
So far this is a text book Elliot wave pattern. It even has a deep wave 2 correction which then usually means a shallower wave 4 correction into the blow off wave 5, and then the eventual A,B,C correction.
We wait and see... signals need to confirm.
Thanks
WeAreSat0shi

ETH - Critical Resistance Ahead 🗝Hello TradingView Family / Fellow Traders. This is Richard, also known as theSignalyst.
ETH has been slight bullish for the last couple of weeks trading inside the orange flat rising broadening wedge pattern.
📈 Lately, ETH rejected the upper bound of the wedge pattern and now retesting it again.
For the bulls to take over again medium-term , we need a break above the red resistance.
📉 Meanwhile , If / As ETH approaches the lower bound of the wedge pattern and blue support, we will be looking for buy setups.
Which scenario is more likely to happen next? and why?
📚 Always follow your trading plan regarding entry, risk management, and trade management.
Good luck!
All Strategies Are Good; If Managed Properly!
~Rich

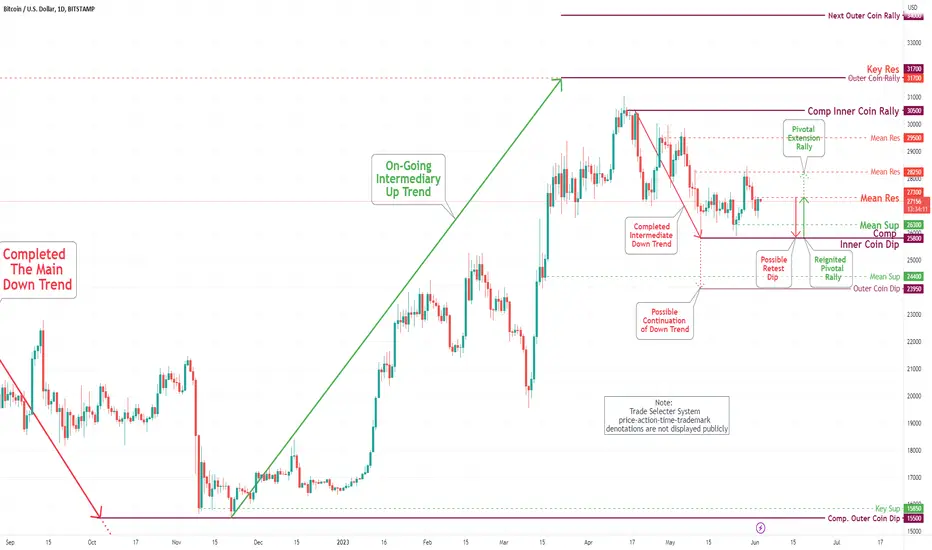
Bitcoin(BTC/USD) Daily Chart Analysis For Week of June 2, 2023Technical Analysis and Outlook:
In this week's session, the coin has achieved the projected prices of Mean Res $27,500 and Mean Res $28,750 as outlined in the Daily Chart Analysis for the Week of May 26. Based on the current price action, the coin will likely test the Inner Coin Dip of $25,800 and potentially make a significant drop to the Outer Coin Dip of $23,950. The upside potential will address the Mean Res $28,250 as a ''Do That To Me One More Time''.
FUTURE ICP X1000The Internet Computer (ICP) is an ambitious project aiming to revolutionize the way we think about decentralized computing. It envisions a future where the internet itself becomes a powerful and scalable computer, enabling a wide range of decentralized applications and services.
One of the key advantages of the Internet Computer is its ability to provide a secure and tamper-proof environment for running applications. By leveraging blockchain technology, the ICP creates a trustless and transparent platform that can execute smart contracts and host decentralized applications with the utmost integrity. This decentralized nature eliminates the need for intermediaries, reducing costs and enhancing security.
Scalability is another crucial aspect of the Internet Computer. Traditional blockchain platforms often struggle with scalability limitations, leading to congestion and high transaction fees. However, the ICP aims to overcome these challenges by utilizing a unique protocol called Chain Key Technology, which allows for horizontal scalability. This means that as the network grows, its capacity to handle more users and transactions expands, ensuring a smooth and efficient user experience.
Moreover, the Internet Computer promotes interoperability among different systems and protocols. It aims to create a unified internet ecosystem where various applications and services can seamlessly interact and share data. This interoperability opens up new possibilities for collaboration, innovation, and the creation of decentralized applications that can leverage the strengths of multiple platforms.
Additionally, the Internet Computer empowers developers by providing a rich set of tools and resources to build and deploy decentralized applications. Its developer-friendly environment supports multiple programming languages, making it accessible to a wide range of developers with different skill sets. This inclusivity encourages creativity and diversity in the development community, leading to a vibrant ecosystem of decentralized applications.
As the Internet Computer continues to evolve, it has the potential to disrupt various industries, such as finance, governance, supply chain, and more. It offers the promise of a decentralized internet that is resilient, transparent, and accessible to all. With its scalability, interoperability, and developer-friendly approach, the Internet Computer is poised to shape the future of decentralized computing.
In conclusion, the Internet Computer (ICP) holds great promise as a transformative technology in the realm of decentralized computing. Its focus on security, scalability, interoperability, and developer empowerment positions it as a significant player in the evolving landscape of blockchain-based platforms. As the Internet Computer continues to mature and gain adoption, we can anticipate exciting developments and innovative applications that harness the full potential of decentralized computing.

DOGE - Critical Zone / Time ⏱Hello TradingView Family / Fellow Traders. This is Richard, also known as theSignalyst.
DOGE has been stuck inside a range around the 0.065 support zone in green.
📈 For the bulls to take over, we need a daily candle close above the last major high in orange.
📉 Meanwhile , as we approach the green support again, we will be looking for short-term buy setups again.
Which scenario is more likely to happen next? and why?
📚 Always follow your trading plan regarding entry, risk management, and trade management.
Good luck!
All Strategies Are Good; If Managed Properly!
~Rich

ETH - Rejection Zones Ahead 🔃Hello TradingView Family / Fellow Traders. This is Richard, also known as theSignalyst.
ETH has been slight bullish for the last couple of weeks trading inside the orange flat rising broadening wedge pattern.
📈 Lately, ETH rejected the upper bound of the wedge pattern and now trading lower as a correction phase.
For the bulls to take over again medium-term, we need a break above the red resistance.
📉 Meanwhile , If / As ETH approaches the lower bound of the wedge pattern and blue support, we will be looking for buy setups.
Which scenario is more likely to happen next? and why?
📚 Always follow your trading plan regarding entry, risk management, and trade management.
Good luck!
All Strategies Are Good; If Managed Properly!
~Rich

BTC - The Road Not Taken 🛣Hello TradingView Family / Fellow Traders. This is Richard, also known as theSignalyst.
As per my last BTC analysis (attached on the chart), we were expecting a short-term bullish movement till the upper orange trendline before we get one more deep bearish dive till the 25,000 zone.
📈 Now BTC is sitting around that the upper orange trendline.
For the bulls to remain in control , and invalidate that bearish trend / channel, we need a momentum H4 candle close above the upper orange trendline.
Meanwhile , the bears can still kick in; and the confirmation would be by breaking below the previous highs (in red) downward again.
Which scenario do you think is more likely to happen next? and why?
📚 Always follow your trading plan regarding entry, risk management, and trade management.
Good luck!
All Strategies Are Good; If Managed Properly!
~Rich

FTM Price Analysis: Long-Term Targets Suggest a Mind-Blowing 30xFTM/USDT Technical Analysis: A Bullish Outlook with Long-Term Targets
( FTM Price Analysis: Long-Term Targets Suggest a Mind-Blowing 30x-40x Growth )
In this technical analysis of the FTM/USDT pair, we will explore the current price action and chart patterns of Fantom (FTM) in relation to the Tether (USDT) stablecoin. Please note that this analysis is based on historical price data and personal interpretation, and it is important to conduct your own research before making any investment decisions.
Cup & Handle Pattern:
On the higher time frame (HTF) chart, FTM is showing signs of a Cup & Handle pattern. The cup has already formed, and the handle is currently being shaped. This pattern suggests that FTM may experience a significant price increase after breaking above the neckline resistance.
Long-Term Targets:
Based on the chart analysis, there is a strong bullish sentiment surrounding FTM. It is anticipated that FTM could potentially reach $10 during the next bullish run, representing a substantial 30x-40x increase from its current price level.
Support and Resistance Levels:
Key levels to watch for support include $0.25 and $0.170. These levels may present attractive entry points if the price experiences a significant dip. On the other hand, resistance levels are situated at $0.46, $0.60, $1.18, and $3.31. Breaking above these resistance levels could indicate further bullish momentum.
Opportunities for Accumulation:
According to this analysis, every significant dip in the FTM price presents an opportunity for accumulation. If the price approaches the strong support level at $1.75, it could be an advantageous entry point for investors looking to accumulate FTM tokens.
Conclusion:
In summary, the technical analysis of the FTM/USDT pair suggests a bullish outlook for Fantom (FTM). The Cup & Handle pattern, combined with the projected long-term targets of $10, indicates potential substantial gains in the future. However, it is essential to remember that this analysis is subjective and not financial advice. Conduct your own research and exercise caution when making investment decisions.
Takeaways:
FTM/USDT is showing a Cup & Handle pattern on the higher time frame chart.
A breakout above the neckline resistance at $0.60 could trigger a significant bullish move.
Long-term targets indicate a potential rise to $10 during the next bull run.
Strong support is found at $1.75, presenting an attractive entry point.
Consider every significant dip as an opportunity to accumulate FTM tokens.
Disclaimer: This analysis is for informational purposes only and should not be considered as financial advice. Always conduct your own research and consult with a professional financial advisor before making investment decisions.
Follow us for more Chart Analysis.
Thank you.

The secrete trend line no one will show you and the buy signalsJust a quick look here.
Another trend line that the BTC price broke through with that big candle in March. BTC first broke through MA Pi bottom resistance kin January then held it as support. Look at when it happened... Literally right after it crossed!!! It is now playing with the top of WHITE trend line. I believe it will continue to do so for a period of time. This is a similar trend line BTC formed in 2015 of of it's lows back then.
Pi Cycle bottom being held as support. BUY
The MZ BTC Oscillator is dark green making confluence for the BUY.
Steve's NVT HV. This one is 100% accurate. When the RED AND WHITE LINE (volatility) goes below the YELLOW line and comes back up and is RED a move is to follow in the upward direction. If it's WHITE then it will correct. The color before entering is insignificant to the confirmation signal. NVT coming up RED Confirms the BUY!
There is a move brewing and it smells like a pump.
Kind Regards
WeAreSat0shi

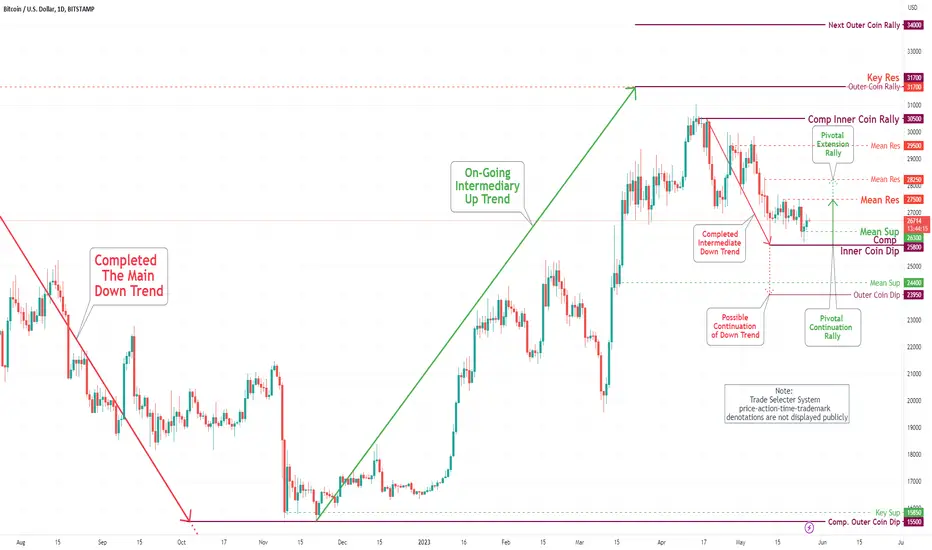
Bitcoin(BTC/USD) Daily Chart Analysis For Week of May 26, 2023Technical Analysis and Outlook:
During this week's trading, the coin has successfully retested the Inner Coin Dip zone and is now expected to bounce back towards the newly established Mean Res $27,500 target. Furthermore, it is anticipated to continue its upward movement towards Mean Res $28,250 in the upcoming week, thereby reigniting the price action upward direction.
BTC - Detailed Video From Daily to M30 📹Hello TradingView Family / Fellow Traders. This is Richard, also known as theSignalyst.
Here is a detailed update top-down analysis for Bitcoin.
Which scenario do you think is more likely to happen? and Why?
Always follow your trading plan regarding entry, risk management, and trade management.
Good Luck!.
All Strategies Are Good; If Managed Properly!
~Rich

ETH - Rejection Zones 🔃Hello TradingView Family / Fellow Traders. This is Richard, also known as theSignalyst.
ETH has been slight bullish for the last couple of weeks trading inside the red channel as a bullish correction.
📈 However , ETH is now approaching a strong resistance zone marked in purple, as it is the intersection of the upper red and orange trendlines.
For the bulls to remain in control, we need a break above the green zone and both trendlines.
📉 Meanwhile , ETH can still reject the purple zone and trade lower to test the lower red trendline again.
If the red channel is broken downward, then we will expect a deeper bearish movement till the 1700 support zone.
Which scenario is more likely to happen next? and why?
📚 Always follow your trading plan regarding entry, risk management, and trade management.
Good luck!
All Strategies Are Good; If Managed Properly!
~Rich

BTC - The Range Is Getting Narrower 📦Hello TradingView Family / Fellow Traders. This is Richard, also known as theSignalyst.
BTC has been boring for the last couple of weeks as it is stuck inside a range.
📉 The range is getting narrower because BTC is forming lower highs and equal lows as a descending triangle pattern.
As per the textbook, the descending triangle is usually a bearish continuation pattern. But to me, it can be broken either side.
If we break the last major low in red downward, we will expecting further bearish movement till around 25,000
🏹 Here is why the 25,000 zone marked by purple circle is a strong support:
1- Round number => 25,000
2- Classic Resistance Zone Turned Support
3- Lower red trendline from daily acting as a non-horizontal support
4- Lower orange trendline from H4 acting as a non-horizontal support
5- Demand zone
📈 In parallel, if BTC breaks above the last high in blue, we will be expecting a bullish correction till the upper orange trendline.
Which scenario is more likely to happen next? and why?
📚 Always follow your trading plan regarding entry, risk management, and trade management.
Good luck!
All Strategies Are Good; If Managed Properly!
~Rich

DGB!! Preparing for it's big entry!As we can see here this is the Monthly chart of Digibyte and we can see a distinct pattern. The MACD makes a cross up and during this time price action make goes up very fast and vast. I have the crosses marked with a circle and the bear market trading range marked with a rectangle shape.
The real important information is not the move that historically has followed, it's the fact the that bottom was always behind this cross as well , so the risk is very low after this cross. We don't have this cross yet, but it looks to happen very soon. The buy is a confirmation of this cross on the monthly. We need to keep in mind that just because this cross will happen, doesn't mean prices will soar right away, it could, and most likely will take some time.
Confirming the parabolic move up is the CM_Ultimate_MA. Right now is red but when it turns green and price action is above it, confirms the bullish moves ahead for months to come.
Thank you
WeAreSat0shi

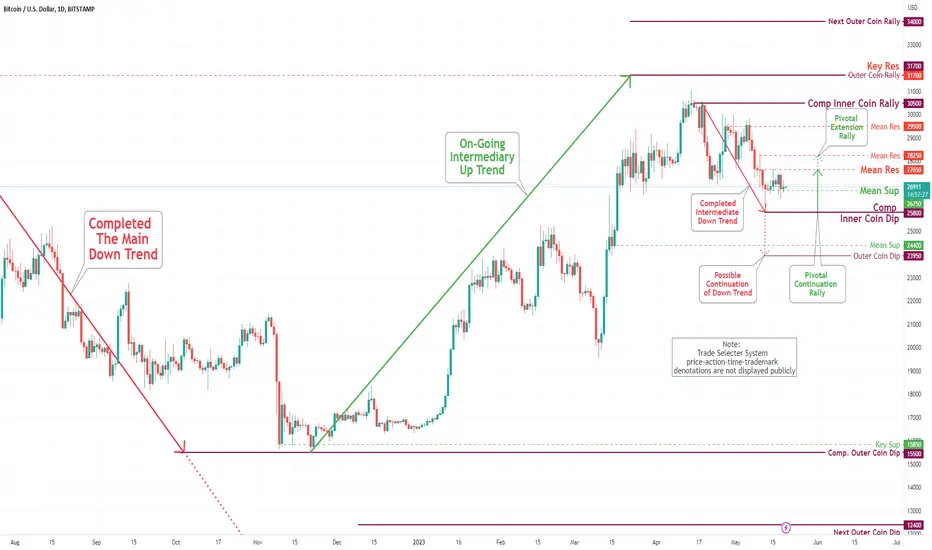
Bitcoin(BTC/USD) Daily Chart Analysis For Week of May 19, 2023Technical Analysis and Outlook:
Throughout the week, the coin's prices remained relatively stable, fluctuating between the Completed Inner Coin Dip of $25,800 and the Mean Res of $27,650. However, the emergence of a new, less significant Mean Sup of $26,750 indicates the possibility of a drop in price to the Inner Coin Dip of $25,800 or even lower to the Outer Coin Dip of $23,950. Conversely, there is currently no indication of an increase in price action to and beyond the Mean Res of $27,650 and $28,250.
XRP - TRIO RETEST 3️⃣ UPDATEHello TradingView Family / Fellow Traders. This is Richard, also known as theSignalyst.
As per my last analysis (attached on the chart), we were waiting for XRP to approach the 0.42 zone to look for buy setups as it was the intersection of three rejection zones.
Now XRP rejected our purple zone and traded higher sitting around the upper red trendline acting as a non-horizontal resistance.
🏹 For the bulls to remain in control, we need a break above the last major high in orange and upper red trendline.
Meanwhile, the bears can still kick in for one more correction. In this case, as we approach the green support again, we will be looking for new short-term buy setups.
📚 Always follow your trading plan regarding entry, risk management, and trade management.
Good luck!
All Strategies Are Good; If Managed Properly!
~Rich

ETH - Trend-Following Setup Ahead ❗️Hello TradingView Family / Fellow Traders. This is Richard, also known as theSignalyst.
ETH has been overall bullish from a long-term perspective trading inside the rising broadening wedge in red.
After rejecting the 2000 resistance, ETH has been in a bearish correction trading inside the falling orange channel.
🏹 Here is why the 1700 - 1750 zone marked by purple circle is a strong support:
1- Round number 1700
2- Classic Resistance Zone Turned Support
3- Lower red trendline acting as a non-horizontal support
4- Lower orange trendline acting as oversold zone
5- Demand zone
📈 As per my trading style:
As ETH approaches the purple circle zone, I will be looking for bullish reversal setups (like a double bottom pattern, trendline break , and so on...)
📚 Always follow your trading plan regarding entry, risk management, and trade management.
Good luck!
All Strategies Are Good; If Managed Properly!
~Rich

DIE HARD (BITCOIN) Bitcoin is a decentralized digital currency that was created in 2009 by an anonymous person or group of people using the pseudonym Satoshi Nakamoto. It operates on a technology called blockchain, which is a distributed ledger that records all transactions made with Bitcoin.
There are several benefits to using Bitcoin. Firstly, it allows for peer-to-peer transactions without the need for intermediaries like banks. This means that individuals can send and receive payments directly, reducing the reliance on traditional financial institutions. Additionally, Bitcoin transactions are generally faster and can be completed within minutes, especially compared to traditional banking systems that can take several days for international transfers.
Another benefit of Bitcoin is its potential for increased financial privacy. While Bitcoin transactions are recorded on the public blockchain, the identities of the parties involved are not directly linked to the transactions. This can provide a level of anonymity, although it is not completely anonymous since transactions can be traced through blockchain analysis.
If everyone were to use Bitcoin for transactions and everything became decentralized, it would have both positive and negative implications. On the positive side, a decentralized network would reduce the control and influence of centralized authorities, such as governments and banks, over the financial system. This could potentially lead to greater financial inclusivity, as individuals who are unbanked or underbanked could access financial services through Bitcoin.
Moreover, a decentralized network would make transactions more resistant to censorship and control, allowing for greater freedom in conducting financial activities. It would also enable cross-border transactions to be more efficient and cost-effective, as there would be no need for intermediaries or currency conversions.
However, there are also challenges and potential drawbacks to consider. One major concern is the scalability of the Bitcoin network. Currently, the Bitcoin blockchain has a limited capacity to process transactions, which has led to issues with network congestion and higher transaction fees during periods of high demand. If everyone were to use Bitcoin, the network would need to scale significantly to accommodate the increased transaction volume.
Additionally, the lack of centralized control and regulation in a decentralized network can pose challenges related to security, consumer protection, and legal frameworks. Without a central authority, it becomes more difficult to address issues such as fraud, disputes, or illegal activities conducted using Bitcoin.
In summary, Bitcoin is a decentralized digital currency that offers benefits such as peer-to-peer transactions, increased financial privacy, and potential for financial inclusivity. If everyone were to use Bitcoin and the entire financial system became decentralized, it could bring advantages like reduced control by centralized authorities and increased financial freedom. However, challenges related to scalability, security, and regulation would need to be addressed to ensure the stability and viability of such a system.

BTC - Short-Term Correction!Hello TradingView Family / Fellow Traders. This is Richard, also known as theSignalyst.
As per my last BTC analysis, I have mentioned that if we break below the green previous low, we will be expecting a movement till the 25,000 support.
🏹 Here is why the 25,000 zone marked by red circle is a strong support:
1- Round number => 25,000
2- Classic Resistance Zone Turned Support
3- Lower red trendline acting as a non-horizontal support
4- Lower orange trendline acting as a non-horizontal support
5- Demand zone
📈 BTC is now sitting around that green area and since the daily candle hasn't closed below it, the bulls can still kick in for a correction.
Yes, we will keep calling every bullish movement a correction as long as we are trading inside the falling orange channel.
For the bulls to take over medium-term again, we need a break above the upper orange channel.
For now, we are expecting a short=term bullish correction followed by another bearish impulse.
📚 Always follow your trading plan regarding entry, risk management, and trade management.
Good luck!
All Strategies Are Good; If Managed Properly!
~Rich

BTC - Critical Zone ❗️Hello TradingView Family / Fellow Traders. This is Richard, also known as theSignalyst.
As per my last analysis (attached on the chart), we have been waiting for the bulls to approach the green major low to look for buy setups.
BTC is now sitting around that green area and since the daily candle hasn't closed below it, we will be looking for buy setups.
🏹 For the bulls to take over, we need a break above the red channel and last minor high in gray.
📈 Meanwhile, until the bulls take over, the bears will remain in control, especially if we break below the green zone. Then a movement till the 25,000 support zone as mentioned on my last week's BTC analysis
Which scenario do you think is more likely to happen first? and why?
📚 Always follow your trading plan regarding entry, risk management, and trade management.
Good luck!
All Strategies Are Good; If Managed Properly!
~Rich

Bitcoin(BTC/USD) Daily Chart Analysis For Week of May 12, 2023Technical Analysis and Outlook:
During the week, the coin experienced a price decrease and completed an Inner Coin Dip of $25,800. However, the current price action indicates a likely increase to Mean Res $27,650 and even Mean Res $28,250. If the price continues to fall, it may reach an Outer Coin Dip of $23,950.
