Blockchain

ETH - Strong Support Ahead 🏹Hello TradingView Family / Fellow Traders. This is Richard, also known as theSignalyst.
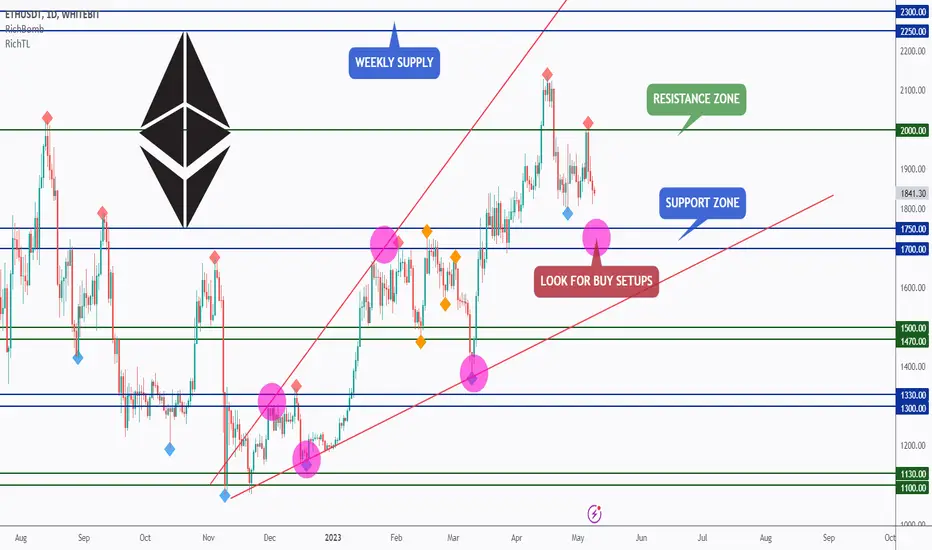
🏹 Here is why the 1700 - 1750 zone marked by purple circle is a strong support:
1- Round number 1700
2- Classic Resistance Zone Turned Support
3- Lower red trendline acting as a non-horizontal support
4- Lower orange trendline acting as oversold zone
5- Demand zone
📈 As per my trading style:
As ETH approaches the purple circle zone, I will be looking for bullish reversal setups (like a double bottom pattern, trendline break , and so on...)
📚 Always follow your trading plan regarding entry, risk management, and trade management.
Good luck!
All Strategies Are Good; If Managed Properly!
~Rich

🔗 What is a Blockchain? (simple guide)📍What is blockchain?
The blockchain is a distributed ledger that offers transparency decentralization and data integrity.
🔹 Digital Ledger: A Blockchain is a digital ledger which keeps records of all transactions taking place on a peer to peer network.
🔹 Encrypted Information: All information transferred via blockchain is encrypted and every occurrence recorded, meaning once the block is created and added to the chain, it cannot be altered.
🔹 Peer to Peer: Lets you interact or send transactions with a peer, without an intermediary. Removes the middle man.
🔹 Data Sharing: The blockchain can be used for more than the transfer or currency. It can also be used to share contracts, records and any other type of data.
🔹 Decentralization: The blockchain is decentralized, so there isn’t a need for a central, certifying authority.
📍What are the Blockchain Core Components?
🔸 Blocks can be written and read by certain participants and entries are permanent, transparent, and searchable.
🔸 Transactions are recorded in chronological order on a continuously growing database.
🔸 A system of computers, connected via the internet, in which users at any computer can receive or send value to another computer.
🔸 Data is replicated and stored across the system over a peer-to-peer network.
🔸 It facilitates peer-to-peer transfer of value without a central intermediary, e.g. a bank.
🔸 Digital signatures and cryptography are used to secure the transfer.
👤 @AlgoBuddy
📅 Daily Ideas about market update, psychology & indicators
❤️ If you appreciate our work, please like, comment and follow ❤️

BTC - Key Rejection Zone!Hello TradingView Family / Fellow Traders. This is Richard, also known as theSignalyst.
BTC rejected the 30,000 resistance zone and now trading lower for a bearish correction.
If BTC breaks below 27,000 previous major low, we will expect a movement till 25,000 zone where we will be looking for long-term trend-following buy setups.
🏹 Here is why the 25,000 zone marked by red circle is a strong support:
1- Round number => 25,000
2- Classic Resistance Zone Turned Support
3- Lower red trendline acting as a non-horizontal support
4- Lower orange trendline acting as a non-horizontal support
5- Demand zone
📈 As per my trading style:
As BTC approaches the red circle zone, I will be looking for bullish reversal setups (like a double bottom pattern, trendline break , and so on...)
📚 Always follow your trading plan regarding entry, risk management, and trade management.
Good luck!
All Strategies Are Good; If Managed Properly!
~Rich

ETH - Long-Term Trend-Following Setup 🏹Hello TradingView Family / Fellow Traders. This is Richard, also known as theSignalyst.
After rejecting the 2000 resistance, ETH has been bearish short-term making lower lows and lower highs on H4.
🏹 Here is why the 1750 zone marked by purple circle is a strong support:
1- Round number => 1750
2- Classic Resistance Zone Turned Support
3- Lower red trendline acting as a non-horizontal support
4- Demand zone
📈 As per my trading style:
As ETH approaches the purple circle zone, I will be looking for bullish reversal setups (like a double bottom pattern, trendline break , and so on...)
📚 Always follow your trading plan regarding entry, risk management, and trade management.
Good luck!
All Strategies Are Good; If Managed Properly!
~Rich
BTC - Correction Started ❗️Hello TradingView Family / Fellow Traders. This is Richard, also known as theSignalyst.
As per my last analysis (attached on the chart), we know that the correction already started as BTC broke below the last H1 low.
Now what?
🏹 BTC is still overall bearish, and we are expecting a movement till the lower bound of the orange channel which is also lining up with the previous daily low in green.
📈 As per my trading style:
As BTC approaches the purple circle zone, I will be looking for bullish reversal setups (like a double bottom pattern, trendline break , and so on...)
UNLESS the green daily low is broken downward. In this case a deeper correction movement till the 25,000 support would be expected.
Which scenario do you think is more likely to happen first? and why?
📚 Always follow your trading plan regarding entry, risk management, and trade management.
Good luck!
All Strategies Are Good; If Managed Properly!
~Rich
#SUIUSDT - CURRENT PARITY FORECAST #SUI ##SuiCommunity #suipadFirst of all, the chart didn't quite fit. It's my own guess. It is not investment advice. If the market goes down, there is a pullback to 0.60 among the options. If I see 5 billion market cap, I will sell my sui. Good luck.

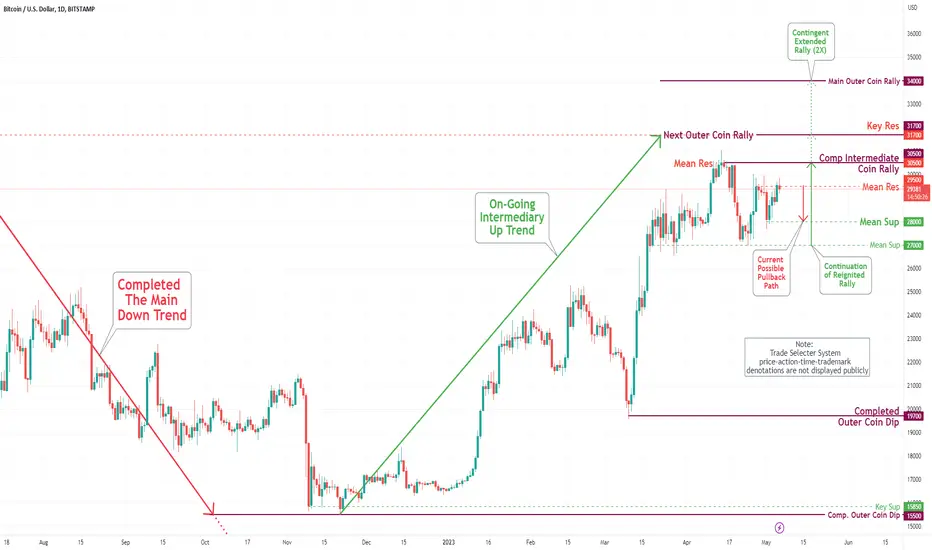
Bitcoin(BTC/USD) Daily Chart Analysis For Week of May 5, 2023Technical Analysis and Outlook:
Throughout the week, the coin remained steady between our Mean Res $30,500, Intermediate Coin Rally of the same, and Mean Sup $27,000. It established a new soft Mean Res at $29,500 and a strong Mean Sup at $28,000, which most likely will be retested. This price action indicates that there will be robust progress in reaching the Next Outer Coin Rally point of $31,700 and, ultimately the Main Outer Coin Rally at $34,000.
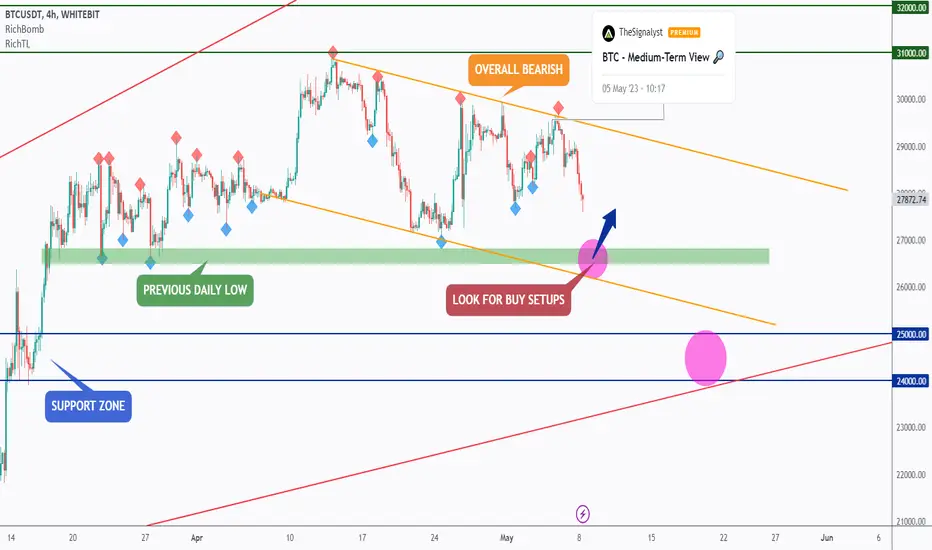
BTC - Medium-Term View 🔎Hello TradingView Family / Fellow Traders. This is Richard, also known as theSignalyst.
📌 H4: Left Chart
BTC is currently overall bearish from a medium-term perspective trading inside the falling channel in orange.
Now BTC is sitting around the upper orange trendline acting as a non-horizontal resistance.
📌 on H1: Right Chart
BTC bullish short-term as a correction trading inside the rising channel in red.
If BTC breaks below the lower red trendline and zone, we will expect the next bearish impulse to start pushing till the lower orange trendline.
📉 Meanwhile, BTC is still bullish short-term and can still break above the upper orange trendline to retest the 30k-32k zone.
Which scenario do you think is more likely to happen first? and why?
📚 Always follow your trading plan regarding entry, risk management, and trade management.
Good luck!
All Strategies Are Good; If Managed Properly!
~Rich

Bitcoin $27k Damn. I don't like the way #Bitcoin looks on this chart. It's worth being careful and not hoping for a miracle, it's a f#cking cryptocurrency, anything can happen.
Bro, write your thoughts in the comments

ETH - Bullish Channel inside a Bearish Channel 📉📈Hello TradingView Family / Fellow Traders. This is Richard, also known as theSignalyst.
After rejecting the 2000 resistance, ETH has been bearish trading inside the falling channel in red.
ETH is now bullish from a short-term perspective as a correction phase trading inside the rising channel in orange.
📉 If ETH breaks below the lower orange trendline, then we will expect the bears to take over for one more bearish impulse till the lower red trendline.
📈 Meanwhile, we are bullish short-term, and if ETH breaks above the upper red trendline, then we will expect further bullish movement till the 2000 resistance again.
📚 Always follow your trading plan regarding entry, risk management, and trade management.
Good luck!
All Strategies Are Good; If Managed Properly!
~Rich

THETA/USD looks to turning around to the upside!Based on the weekly candles and moving average, combined with the THETA Network's development and partnership news, including Cannes 2023, the price action looks to be moving to the upside.

NWC Trading WebNews crypto is an altcoin that in this bear market is showing strength especially against BTC. This is good, especially for the macro. Having said that it all can change very quickly we must pay attention to the support and resistance lines in the price and the RSI to really get a better grasp on the macro.
The trading web is an idea I have made from a couple years back on a couple other coins that had very good success. Basically it's the support and resistance areas of price action going up and going down, they eventually cross each and look like a spiders web, hence the name.
What to look for now
NWC must close and hold the weekly above 322 sats and the RSI above 38. That shows strength and the likeliness of making a higher high this year is much more likely.
NWC mobile platform.
I personally use the platform and really like it, with still lots of new addons coming in the future this platform will be very big IMO. Check it out on your device, I'm using the Android version.
I will periodically update the chart when there is any moves of importance.
This not financial advice.
keep in mind the move could happen much earlier or not at all.
WeAreSat0shi
Stay Blessed is 2023!

BTC - Ready Steady Shoot 🎯Hello TradingView Family / Fellow Traders. This is Richard, also known as theSignalyst.
As per my last analysis, we know that BTC rejected 30,000 resistance and now trading lower for a bearish correction.
Now what?
🏹 Here is why the 25,000 zone marked by red circle is a strong support:
1- Round number => 25,000
2- Classic Resistance Zone Turned Support
3- Lower red trendline acting as a non-horizontal support
4- Lower orange trendline acting as a non-horizontal support
5- Demand zone
📈 As per my trading style:
As BTC approaches the red circle zone, I will be looking for bullish reversal setups (like a double bottom pattern, trendline break , and so on...)
📚 Always follow your trading plan regarding entry, risk management, and trade management.
Good luck!
All Strategies Are Good; If Managed Properly!
~Rich

ANKR (ANKR) WCA - Inverted Head and Shoulders PatternHello and thank you for taking the time to read my post. Today, we analyze the ANKR chart with the ticker ANKR/USDT on the weekly scale, focusing on a classic price pattern called "Inverted Head and Shoulders."
Inverted Head and Shoulders Pattern:
This pattern consists of three parts, always in the same order: the left shoulder, the head, and the right shoulder. These can be sharp or rounded. Ideally, the shoulders should have symmetry, which makes the pattern easier to identify. The bottoms between the troughs form a recognizable trend line. Additionally, we have a trendline called the neckline, which acts as the current resistance line. Technicians refer to this line as the neckline. Ideally, the neckline should be horizontal.
Chart Analysis:
Upon examining the ANKR (ANKR) price chart, we can clearly see that this classic price formation is taking shape. The neckline can be found in price terms at 0.04881. The formation can span from weeks to months, making this more of a watch-list candidate than a direct trade.
Moreover, the weekly 50 EMA is also moving downwards and is clearly rejecting the price, providing yet another reason to observe rather than to trade at this time.
The pattern exhibits the necessary criteria and symmetry between the lines. Although we cannot predict when or if the price pattern will break out, we can certainly prepare for it.
Conclusion:
The ANKR (ANKR) weekly chart showcases a classic Inverted Head and Shoulders pattern with a neckline at 0.04881. Although the exact timing of a breakout remains uncertain, the pattern provides valuable insights into potential market movements. By closely monitoring the neckline and the downward trending weekly 50 EMA, which is rejecting the price, traders can be better prepared for any potential price action in the future. As always, it's essential to consider risk management and proper position sizing when trading based on chart patterns.
Please note that this analysis is not financial advice. Always do your own due diligence when investing or trading.
If you found this analysis helpful, please like, share, and follow for more updates. Happy trading!
Best regards,
Karim Subhieh

Bitcoin Dominance Elephant/Mammoth in the room The Bitcoin dominance has been doing something seemingly unnatural with the limited information available to us. I find that a lot of people are sleeping on this or just unaware.
First off, this chart is very busy. I don't normally make charts with this many indicators but there is a lot of confliction in the information and I only want to make a single chart of this to follow on. There is are even a few indicators I have deleted for sanities sake.
Secondly, the elephant is that we have basically gone through a bear market in a range with the dominance. What we have known or at least what we think we knew is that in bear markets the dominance of bitcoin goes up. That so far has proven to be false or is it that the bear market isn't over yet? I will explain all of this with my opinion at the bottom with a third option.
THE INDICATORS
On the Monthly chart
50 month MA
CM_Ultimate_MA_MTF
Volume
Down below, from top to bottom
RSI
Vortex (VI)
Traders Dynamic Indicator (TDIGM)
Historical Volatility (HV)
Bitcoin Dominance Oscillator (BTCD_O)
Sentiment Oscillator (ASO)
So, lets start from the top
The CM Ultimate has turned green, the only other time that's happened on this chart has shown an upward dominance move for Bitcoin. The RSI is climbing, the blue vortex has crossed above the pink line that all show a support for this upward dominance move. The sentiment oscillator has closed the gap (Blue vs pink) and looks to make across that would add to the upward move, but, has not crossed as of yet (possibly this month it may).
The conflict or size of the move
The last time dominance went up it was met with very heavy resistance the 50 month MA (yellow line), it finally did break through but did not hold for even one month and broke back down again. This shows us the 50 month is very very strong resistance for now. The question is, will it go above this time around? This is what remains to be seen and what will follow here.
The volatility and traders dynamic could be pointing at small move. We can clearly see the volatility going down as the move is going up. The TDI has been saying a move is coming and has been made but it might already be over, or there is isn't much left in the move. So, it could go to the 50 month and get rejected from there. Why? We can also see the TDI's range is narrowing which coincides with the volatility. Also, along with all this the RSI is showing hidden bearish divergence for 4 years now, that started in 2015, but has it played out fully yet? Again that remains to be seen.
I have zoomed in on the volatility so it can be clearly seen but what is being missed is the giant wedge that it is in. This wedge does eventually end in about 2 years, so it's still aways away.
What I think and what my analysis is.
First off, it's not to be taken as advice.
I think BTC dominance is going up for now. I also think it gets rejected by the 50 month and goes back down for an alt-season and could make a double bottom and hit the lows of 2018 @ 35% or possible even slightly lower for a very short time. It then would go back up substantially.
Keep in mind this could take 2 to 3 years to play out in full or even longer.
The keys in all of this are the 50 month, the Volatility and the volume. We can also see the volume is in a downward trend. A big volume spike could bean early sign of a trend reversal too. Once all this plays out and if the dominance was to go back up the volatility would have to break out of the wedge in a fairly violent way, just as it did when it broke down in 2017/18.
The other option is it just gets more and more stable and less volatile as time goes on and keeps following this trend. I don't think this is likely as a permanent fixture though.
Another hidden key here could be Ethereum. ETH has also closed the gap on BTC during this bear market, so it's another thing I'm looking at and could also be used as an indicator to all this data. I have linked a chart to this analysis in this one called "Is Ethereum going to dethrone the king". Also, I have included is an altcoin lengthening cycles analysis based on XRP.
I do suggest you replicate this chart in multiple ways by breaking down the indicators for cleanliness sake and even adding in the ones I removed listed down bellow.
Removed but still relevant Indicators
Stochastic RSI
Bollinger Bands
MACD
Thank you for looking and please feel free to let me know what you think in the comment section down below.
Stay Blessed
WeAreSat0shi

ETH - Stuck Inside A Range 📦Hello TradingView Family / Fellow Traders. This is Richard, also known as theSignalyst.
ETH has been stuck inside a range between 1750 support and 2000 resistance.
Lately, ETH rejected the 2000 and now trading lower.
As per my trading style, here is my plan:
📉 1- Wait for ETH to approach the 1750 support to look buy setups
📈 2- Wait for ETH to break above 2000 (daily candle) then look for buy setups on its retest
📌 Meanwhile , as long as ETH is sitting midway it would be a no trade zone for me. So I will be waiting patiently!
Remember: Good things come to those who wait!
📚 Always follow your trading plan regarding entry, risk management, and trade management.
Good luck!
All Strategies Are Good; If Managed Properly!
~Rich

Bitcoin(BTC/USD) Daily Chart Analysis For Week of April 28, 2023Technical Analysis and Outlook:
The coin made a significant pullback to our Mean Sup of HKEX:26 ,900, which was achieved with a substantial price increase following the Mean Res and Intermediate Coin Rally levels of HKEX:30 ,500, which is in process. This will be followed by a further boost to reach the Next Outer Coin Rally point of 31,700 and, eventually, the Main Outer Coin Rally point of HKEX:34 ,000.

BTCUSD will DropWe have a very strong supply area that the price has not penetrated before, and we also have a strong resistance area at the top, so we will prefer the downside trend, but we will wait for the flag to be broken and then retest it until the price rises to the supply or resistance area, then we enter our deal with little risk and with great profit

ETH - All Eyes on 2000 & 1750 👀Hello TradingView Family / Fellow Traders. This is Richard, also known as theSignalyst.
From a long-term perspective, ETH has been overall bullish trading inside the rising broadening wedge pattern just like BTC.
Lately, from a medium-term perspective, ETH got stuck inside 1750 support and 2000 resistance.
As per my trading style, here is my plan:
📉 1- Wait for ETH to approach the 1750 support to look buy setups
📈 2- Wait for ETH to break above 2000 (daily candle) then look for buy setups on its retest
📌 Meanwhile, as long as ETH is sitting midway it would be a no trade zone for me. So I will be waiting patiently!
Remember: Sometimes No Trade, is also a Trade.
Which scenario do you think is more likely to happen first? and why?
📚 Always follow your trading plan regarding entry, risk management, and trade management.
Good luck!
All Strategies Are Good; If Managed Properly!
~Rich

BTC - Bulls Took Over Short-Term ❗️Hello TradingView Family / Fellow Traders. This is Richard, also known as theSignalyst.
As per my last BTC video analysis (attached on the chart) we know that the bulls would take over short-term by breaking above the last minor high in gray.
Yesterday, BTC broke above the high and approaching a minor resistance in red. Now What?
🏹 For the bulls to remain in control, we need a break above the red zone 29250, in this case we will be expecting further bullish movement till the 31,000 resistance zone.
The bears will take over short-term again, if we break below the last minor low (currently around 28250)
Which scenario do you think is more likely to happen next? and why?
📚 Always follow your trading plan regarding entry, risk management, and trade management.
Good luck!
All Strategies Are Good; If Managed Properly!
~Rich

90k Bitcoin by Dec 2023?2023 looks like it will be bullish.
Is it possible that that Bitcoin could reach 90k by late 2023 or even early 2024? Yes anything is possible, however it's not likely. What is likely is the beginning of the new bull market (March/April) is what I believe. Until then, we will only see small movements with volatility growing upward into second quarter of 2023.
The Stochastic RSI on the monthly has never had a false signal and historical marked the beginning of the Bull market.
Only time will tell, Invest responsible.
This is by no means investment advice.

BTC - Detailed Top-Down Analysis 🔎Hello TradingView Family / Fellow Traders. This is Richard, also known as theSignalyst.
Here is a detailed update top-down analysis for BTC .
Which scenario do you think is more likely to happen? and Why?
Always follow your trading plan regarding entry, risk management, and trade management.
Good Luck!.
All Strategies Are Good; If Managed Properly!
~Rich
