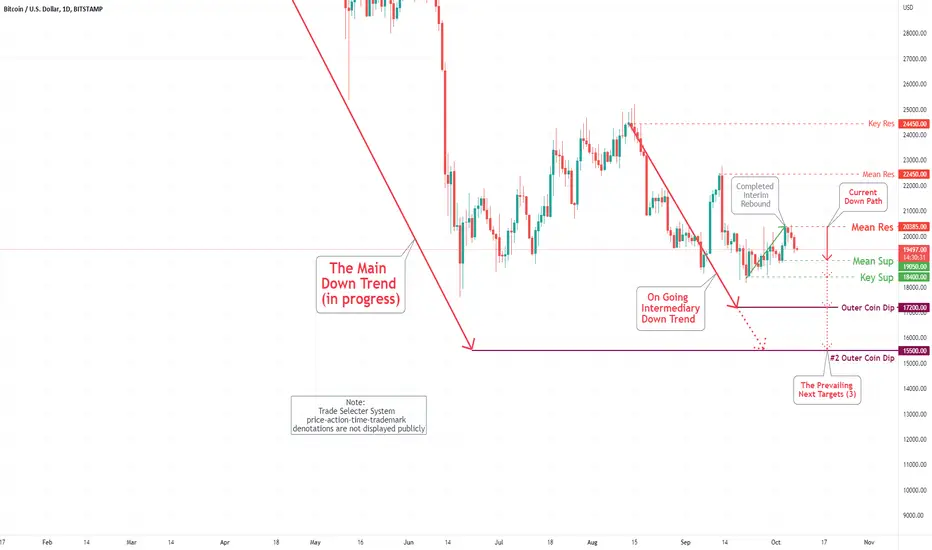
Bitcoin(BTC/USD)Daily Chart Analysis For Week of October 7, 2022Technical Analysis and Outlook:
The Bitcoin completed our interim rebound as specified Bitcoin (BTC/USD) Daily Chart Analysis For September 30. On the downside, the main target is our newly created Mean Sup $19,050, Key Sup at $18,400, and the next Outer Coin Dip at $17,200, with the possibility of extending to the prevailing move to #2 Outer Coin Dip at $15,500 - There are possible short-term upside moves to Mean Res $20,385.
Blockchain
October 8 BTCUSD BingX Chart Analysis and Today's HeadlineBingX’s Bitcoin Chart
According to the latest nonfarm payrolls report from the Bureau of Labor Statistics (BLS), U.S. employers added 263,000 jobs in September, above expectations of 250,000. Bitcoin is down 2.64% over the last 24 hours and fell to an intraday low of $19,323.16. The largest cryptocurrency dropped alongside the traditional equity market, because the report from BLS shows the U.S. jobs market remains strong, which suggests the Federal Reserve is unlikely to pivot from its hawkish interest rate hikes. The CME FedWatch Tool now assigns a 79.6% chance for a 75 basis point rate hike in November, up from 56.5% just a week ago.
Today’s Cryptocurrency Headline
Bitcoin Miner Argo Blockchain Raises $27M to Ease Liquidity Pressures
Bitcoin miner Argo Blockchain has raised $27 million by issuing 87 million shares to ease liquidity pressures. The company’s chief executive, Peter Wall, said the combination of rising energy prices and falling bitcoin prices hit Argo’s profitability, leading to a cash crunch. Additionally, the company raised $7 million through the sale of 3,400 Antminer S19s.
Disclaimer: BingX does not endorse and is not responsible for or liable for any content, accuracy, quality, advertising, products, or other materials on this page. Readers should do their own research before taking any actions related to the company. BingX is not responsible, directly or indirectly, for any damage or loss caused or alleged to be caused by or in connection with the use of or reliance on any content, goods, or services mentioned in the article.

Bitcoin $20,000 Resistance The Downtrend ContinuesIt seems like Bitcoin wants to get back above $20,000 but it is starting to face resistance getting back above $20,000. We've been ranging from $18,200 - $20,300 for over a month now. Due to the stochastic RSI wave peaking and being at overbought levels on the daily I believe short term Bitcoin will be going back down to the low $19,000 levels within the next week or two. We've formed our daily wave and now it's starting to crest out. I put in a short above $20k looking for Bitcoin to hit around $19,500 level to close the trade. Much peace, love, health, and wealth!

LBC Library still under monthly resistance The monthly stochastic RSI is showing strength and momentum but price is still under the resistance. LBC needs to move above 3 cents and hold it as support on the monthly chart. doing so would make the next move be to the resistance of 7 cents and the same rules apply to this resistance area as the previous.
Momentum growing I would not be surprised to see the price move above the 3 cent mark and make it support.
Library is great media platform that is decentralized and open sourced. By being decentralized the platform protects freedom of speech rights and ensures freedom of press. There also is a mobile app on Android.
There is a court judgement against this project awaiting the final ruling as the SEC has filled a securities claims against LBRY. Regardless of the outcome, this jurisdiction is bound only to USA borders so to the rest of the globe it means nothing.
Thanks for looking
Any questions or comments can be left below.

Litecoin Remains Bounded in the Mid $50'sLitecoin has gained traction, tending toward our upper target of $55.84. The price seems to be equilibrating just below this level, with a possible bull pennant pattern forming. It is not likely that we will see much momentum come through as risk-on markets remained inhibited by higher weekly unemployment and a hawkish Fed. But if so, $55.84 is likely to provide resistance and remains a barrier to higher levels in the $50's. If we retrace, then we should see support again at $51.92 with an absolute floor price of $50.64.

Weakness in Ethereum?Ethereum has trekked higher, breaking through $1341. We are starting to see increased resistance above this level confirmed by multiple red triangles on the KRI. The Kovach OBV is edging up, but we don't expect much momentum to come through today on account of higher weekly unemployment and hawkish Fed-speak. Current levels are likely to hold, but if not, we could retrace back to the $1200's with $1235 a likely lower bound. It is not likely that we will see any significant buying come through but if so, $1424 is the next target.

Bitcoin Struggles with $20KBitcoin is facing resistance around $20.4K, with several red triangles on the KRI to serve as confirmation around this level. This follows a higher than expected weekly unemployment figures and statements from the Fed that their rate hike outlook will remain hawkish. The Kovach OBV has wavered a bit suggesting we will need more momentum to come through to hit $20.7K. We expect the current range to hold with $19.5K as a lower bound and $18.6K to hold as a floor price. We don't expect any strong momentum to come through, but if so, we must break $20.7K to reestablish the $20K's and consider higher levels.

Push through the VWAP candles?...I'm in waiting...I'm trying to determine if the price action will bounce off of the VWAP candles on the 4 hour chart or not. As you can see in the recent history, when it jumps on top of the VWAP candles it will make a measured move upwards toward the $22,500 range. If it bounces off of the VWAP, we are sure to see more downside action. I'm in a holding pattern...until I see the response to the VWAP, I will remain holding as far as my short term trades.

Litecoin Maintains the RangeLitecoin edged higher, hitting our level of $55.84, then immediately turning south, as expected and voiced here in these reports. We anticipate Litecoin to continue to hold this range in the low to mid $50's. Anticipate a floor of $51.92 or $50.64. We are not likely to break through $55.84 but if we do, the next target is $61.75.

Ethereum Runs into ResistanceEthereum is currently running into resistance with $1341 giving it some issues. We are seeing red triangles on the KRI confirming resistance just above this level. If we can somehow find a burst of momentum, then $1424 is the next target, otherwise, $1341 should continue to provide support with $1235 a likely floor for now.

Bitcoin Faces Resistance Around $20KBitcoin has gained some steam but appears to have topped out in the low $20K's. We are seeing red triangles build confirming resistance. We could not even hit our next target at $20.7K, which is a sign of weakness for BTC. This remains a target to the upside. If we retrace, which is highly likely, we should see support at $20K, then $19.5K, with a floor of $18.6K.

XLM - Wait For The Bulls!Hello TradingView Family / Fellow Traders. This is Richard, also known as theSignalyst.
XLM has been overall bearish for a while trading inside the red wedge pattern.
Lately we can see that the bears are getting exhausted, not being able to push lower as before, getting stuck inside a range forming an accumulation phase.
Moreover, XLM is sitting around a strong support and round number 0.1 and forming a double bottom pattern.
But of course, the bulls aren't in control yet.
Trigger => For the bulls to take over, we need a momentum candle close above the gray neckline.
Meanwhile, until the bulls take over, XLM would be stuck inside a range between 0.1 and 0.14
Which scenario do you think is more probable and why?
Always follow your trading plan regarding entry, risk management, and trade management.
Good luck!
All Strategies Are Good; If Managed Properly!
~Rich

Litecoin Makes a Run for the Mid $50'sLitecoin pivoted off lows with $51.92 providing support, as anticipated. We made a run for higher levels, with an upside target of $55.84, but have run out of steam just below this level. Several red triangles on the KRI seem to indicate that LTC is running into resistance. If are able to continue the rally then $55.84 is sure to provide resistance. We are likely to retrace back to support at $51.94, with $50.64 a likely floor.

Can Ethereum Sustain Higher Levels?Ethereum has rallied with the rest of the crypto markets as risk-on assets catch a bid from increased expectations that the Fed will pivot from their pervasively hawkish rhetoric. We are currently testing our level at $1341, with red triangles on the KRI indicating that we are meeting resistance. The Kovach OBV is still relatively flat, suggesting that a rejection of current levels is likely. If so, then we are sure to return to our previous value with $1235 a likely floor for now. If we can continue to rally then $1424 is the next target.

Relief Rally in Bitcoin Stalls at $20KBitcoin rallied off of a bid in risk-on assets, as investors become hopeful that the Fed will pivot from their hawkish stance. Risk-on assets have rallied, and the sentiment has bled into the crypto markets, with Bitcoin breaking through $19.5K. We are meeting resistance at $20K, which is anticipated. If we are able to break through then we will meet immediate resistance at $20.7K. We are meeting resistance at current levels confirmed by a red triangle on the KRI, and if we reject this level, then $19.5K or $18.6K are sure to provide support.

Can Litecoin Hold The $50's?Litecoin still remains bounded between $51.92 and $55.84, as we have mentioned many times. The price action has edged downward, but $51.92 is providing good support at the moment. If this breaks, then there is another level immediately below at $50.64, which should hold. if momentum comes through, then $55.84 is a likely ceiling, as it will take significant momentum to break this level.

Can Ethereum Regain $1300?Ethereum has edged lower with the rest of the crypto market. We have pulled back further and further from $1341, our support level above. Multiple red triangles on the KRI confirm resistance to the upside. We made a run deeper into the $1200's, but have found some meager support and are currently hugging the $1300. If we see more momentum come through, the next target is $1341 which is sure to provide resistance. As a floor, we should expect $1235 to provide support.

Will Bitcoin Test Lower Levels?Bitcoin has been meandering between $18K and $19K, maintaining a very narrow range. The Kovach OBV has completely leveled off and is starting to turn downwards and the price wanes. This suggesets we will most likely maintain the range between $18.6K and $19.5K, unless some momentum comes through either way. Gloom in risk-on markets suggests another dump is likely before any serious buying occurs. If so, we can expect $18.6K to provide support, then $17.6K after that. We are placing some limit orders at $17.6K, as this is a significant low and a likely floor price for now.

iExec RLC - Inverted Head & Shoulder inside Symmetrical TriangleOn the monthly chart I see a head and shoulders pattern formed inside of a symmetrical triangle.
Potential 430% from neckline of H & S or over 1000% from current price.
Thoughts?

Bitcoin (BTC/USD) Daily Chart Analysis For September 30, 2022Technical Analysis and Outlook:
The Bitcoin completed our interim rebound as specified Bitcoin (BTC/USD) Daily Chart Analysis For September 23. On the downside, the main target is our Key Sup at $18,400 and the next Outer Coin Dip at $17,200, with the possibility of extending to the prevailing move to #2 Outer Coin Dip at $15,500 - There are possible short-term upside moves.

Can Litecoin Claw Back the Mid $50's?Litecoin has been hovering in the low $50's, bounded between $51.92 and $55.84. We do appear to be seeing some momentum come through with a large green candle wicking up toward the upper bound of the range. We anticipate this to be short lived, but if we can keep up momentum, we are sure to encounter further resistance at $55.84. If not, then we will likely see support at $51.92 or $50.64.

Bull Wedge Breakout in Ethereum?Ethereum has formed a bull wedge at $1341 and appears to be breaking out. We are wicking just above this level, but the Kovach momentum indicators have actually turned south suggesting this may be short lived. If we can keep the momentum going, then $1424 is the next target. It appears we are already running into resistance. If things turn south, expect stability around $1341, with $1235 a likely lower bound for now.

Bitcoin Attempts a BreakoutBitcoin has established value in the mid $19K's and appears to be making an attempt to break out. At the time of this writing we are seeing a wick above $19.5K, a strong level of resistance and upper bound to the bull wedge BTC was forming. The Kovach OBV is incredibly bullish suggesting a divergence in price that is being realized at this moment. We are currently running into resistance at $20K, but if we can break through then $20.7K will provide resistance, and is our next target. If we retrace, then $19.5K or $18.6K will provide support.
