VIDEO ANALYSIS: CAN USDJPY REACH 114.00 AGAIN?!In this video update, we take a look at USDJPY on the monthly chart as we approach month end.
Price is currently printing a bullish candle after finding support off 105.30. The daily chart
is forming an uptrend and price is currently consolidating, if we see a break above the consolidation
we can look for prices to continue higher.
Blueberrymarkets

VIDEO ANALYSIS: DXY FINDING SUPPORTIn this video update, we take a look at the USD currency index (DXY) and how the price is finding support
at the key $96.00 level with 38.2 Fibonacci confluence. If the daily chart finishes bullish here we could expect upside
to continue with expectations of the major currency pairs being affected.

VIDEO TRADE: USDSGD FORMS INVERSE HEAD AND SHOULDERSIn this video update, we take a look at USDSGD and how the trade posted in our telegram is progressing.
If the daily chart closes higher we can look for short term trades going forward on the 1hr chart.
Wait for the daily close to look for pullbacks on to structure highs.

VIDEO TRADE ANALYSIS: USDCAD TO 1.3080In this video update, we take a look at USDCAD as it rejected the key 1.3300 resistance last week. Expecting further downside
to continue here on this market and looking for a pullback into the previous 4hr lows which holds a 50% fib retracement.
A sell limit order may be appropriate here as the news may cause the market to spike into the key zone.

ANALYSIS: EURGBP ATTACKING LOWS AGAINEURGBP has spiked through the lows today as the GBP continues to gain strength off the back of Governor
Carneys comments that the data shows continual growth with the potential to hike interest rates. How sustainable
that is will remain to be seen as PM May sets upon delaying the exit from the EU. Technically we will need the weekly chart to close below the supporting zone before looking for the opportunity to short the market.

ANALYSIS: NZDUSD FLAG PATTERN TO 0.7000NZDUSD on the 4hr timeframe shows price impulsing from the 0.6770 in line with the weekly timeframe.
Price now seems to be forming a small correction with the potential to breakout and head towards the 0.7000 key zone.
As you can see the 4hr chart candles are small in range which suggests sellers aren't involved in this market and price is accumulating before a move higher. Look for the breakout here.

TRADE: USDCAD TO 1.3080We have been looking for short opportunities on USDCAD for a while now and our previous trade from the video analysis previously hit targets. The market is now lining up for a potential move lower again working within this weekly channel. Price on the weekly chart suggests we could see further downside back into the key support of 1.3080. Look for a bearish reversal signal here as we do expect the DXY to drop to $96.00.

TRADE UPDATE: UKOUSD CLOSE TO TARGETSIn our telegram channel, we identified that the current impulse move on UKOUSD
looked to be running out of steam. Price action suggested we could get a move back into the moving averages
on a mean reversion.

ANALYSIS: EURUSD TRAPPED IN ANOTHER RANGEEURUSD played out as expected last week as various weakness in both the EURO and USD kept the market
quiet and trapped within this 4hr range. As you can see price found support around the 1.1300 range and has formed a 4hr consolidation zone. Before making a trading decision here we need to wait for a clear direction.

ANALYSIS: DXY BREAKS PATTERNThe USD remains under pressure as price failed to find support last week. The 4hr chart formed a bearish
descending triangle pattern and has now broken the supporting trendline. $96.00 support looks likely to be tested before we see any further developments for the USD. This level also hosts 38.2% Fibonacci retracement from the daily timeframe.

VIDEO ANALYSIS: GOLD PLAYING OUT AS PLANNEDYesterday we provided an update on gold with the potential for price to re-test the $1320 highs before
continuing higher. Price on the 1hr chart formed a double bottom and price has since pushed higher forming a higher high.
If the daily trend is going to continue we will expect to see price head towards the key $1350 resistance level.

TRADE ANALYSIS: USDJPY TO 110.00USDJPY is currently trapped at key resistance of 111.00 and price looks to be preparing for a breakout.
If price breaks lower we should expect the price to head towards the 110.00 support level. The BOJ has discussed
with a local newspaper that they will intervene with more easing if they feel it necessary.

VIDEO ANALYSIS: USD FNISHES LOWER FOR THE WEEKIn this video update, we take a look at how the USD is finishing for the week and with the 4hr continuing
to look bearish we could expect a breakout of the current bearish pattern. If we do see price break lower
we should see prices head towards the key support of $96.00.

ANALYSIS: GOLD TO $1320 BEFORE ONE LAST MOVEGold could be heading back to the $1320 highs were price found structure resistance before.
If price prints bullish price action here we could see another push into the key resistance zone.
Daily trend will remain intact if price can hold above the key lows around $1300.00.

VIDEO ANALYSIS: AUDUSD WOES CONTINUEIn this video update, we discuss the current downturn in the AUDUSD as price breaks out of the bearish flag on the 4hr timeframe.
China is potentially adding a ban on coal imports from Australia which has caused the sudden downturn in the AUD. With this breakout
we could expect prices to re-test the key 0.7050 demand zone.

VIDEO ANALYSIS: USDNOK TO 8.4515In this video update, we take a look USDNOK and how this market could benefit from any USD weakness.
The weekly chart showed price rejecting a key resistance zone, looking to the 4hr chart we can see price is
currently back at previous structure lows where we could see sellers re-enter the market.

VIDEO TRADE ANALYSIS: EURUSD AHEAD OF THE FOMC MEETING MINUTESIn this video update, we take a look at EURUSD and how it could play out ahead of the FOMC meeting minutes this evening.
The market is expecting the FOMC to continue to set a dovish tone and with that suggest rate increases or unlikely anytime soon.
The 4hr chart is forming an uptrend and could see further upside if the weakness comes into play.

VIDEO TRADE: SILVER TO 16.40...(XAGUSD)In this video update, we take a look at the Silver and the potential for the Weekly to re-enter the current uptrend. Metals are outperforming
and look likely to continue to do so. The USD is under pressure with recent weak data which is helping the price of the metals push higher.
Looking at the market technically the 4hr chart has printed a bullish engulfing candle off the key moving averages.

VIDEO ANALYSIS: EURUSD...WHAT NEXT?In this video update, we take a look at EURUSD and how the pair could play out for the week. The Eurozone
is showing slowdown and the USD data continues to be softer which means both currencies could be weaker this week.
If that's the case then we are likely to see the market remain in a smaller range with breakout being the best
indicator of direction in the short-term.

VIDEO TRADE UPDATE: AUDJPY CONTINUES TO SHOW WEAKNESSIn this video update, we take a look at the AUDJPY trade and how it is progressing. We took the trade in our
telegram channel as the 4hr chart showed price failing at the previous structure highs. Trade remains valid with
targets set at 2:1.

ANALYSIS: AUDUSD TO KEY WEEKLY TRENDLINEAUDUSD will also benefit from any USD weakness this week and price is currently sitting in a minor resistance zone.
With the USD weakness, we could see prices push towards the weekly trendline resistance. If price can pullback into the 61.8 Fibonacci retracement tool we could look for bullish price action into the 1.1618 Fibonacci extension.

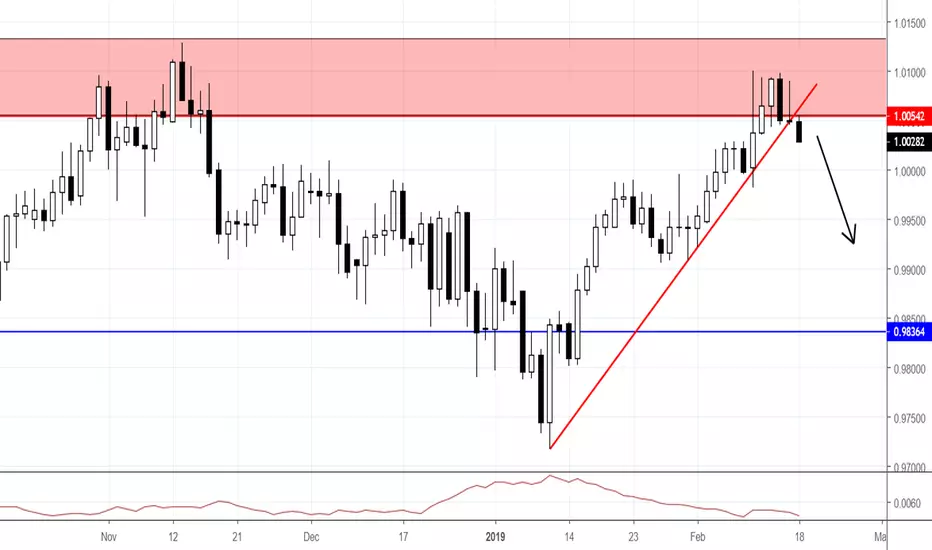
ANALYSIS: USDCHF TO 0.9840USDCHF could benefit from the short-term USD weakness and with price sitting at the key weekly resistance
zone of 1.0050 we could see price move considerably lower.
Looking at the daily chart we can see price has broken through a trendline support if we see price pullback and form
a daily double top we can look for trades short.
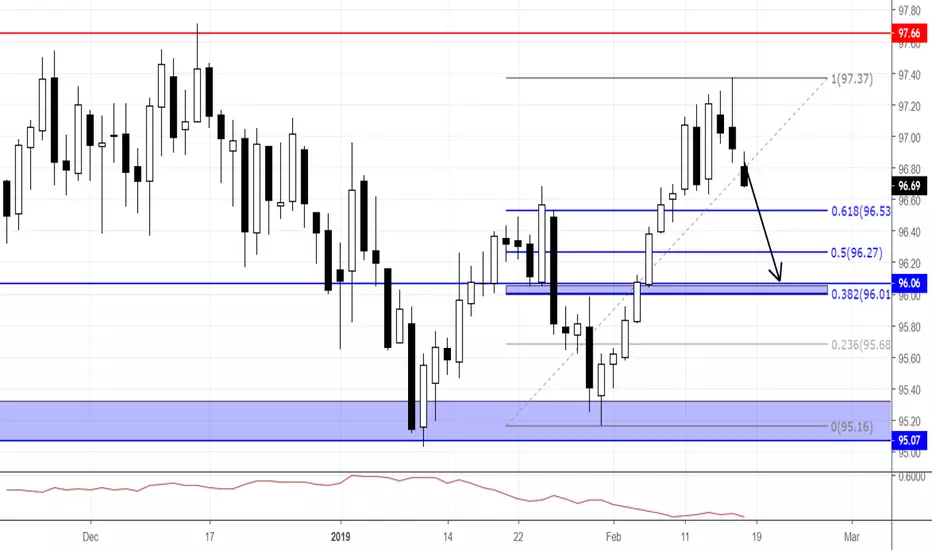
ANALYSIS: DXY BACK TO $96.00...USD DOWNSIDE TO CONTINUEThe USD could suffer a setback this week as the trade war risk continues despite there being some advancements. The FOMC is set to release their latest meeting minutes with it expected to re-iterate the FOMC stance on data and with the data out of the US becoming softer a dovish tone is more likely. Price could push back into the 38.2 fib and key $96.00 level.